Races in Milton, Washington (WA) Detailed Stats
Data:
Races - White alone (%)
Races - White alone (% change since 2000)
Races - Black alone (%)
Races - Black alone (% change since 2000)
Races - American Indian alone (%)
Races - American Indian alone (% change since 2000)
Races - Asian alone (%)
Races - Asian alone (% change since 2000)
Races - Hispanic (%)
Races - Hispanic (% change since 2000)
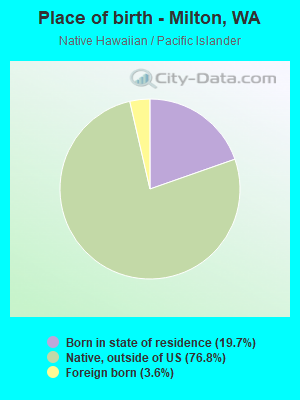
Races - Native Hawaiian and Other Pacific Islander alone (%)
Races - Native Hawaiian and Other Pacific Islander alone (% change since 2000)
Races - Two or more races(%)
Races - Two or more races(% change since 2000)
Races - Other race alone (%)
Races - Other race alone (% change since 2000)
Racial diversity
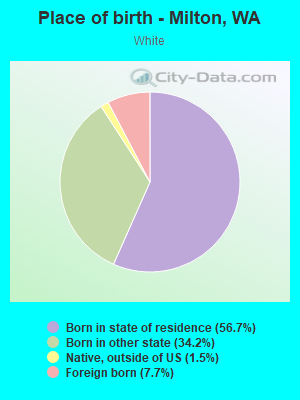
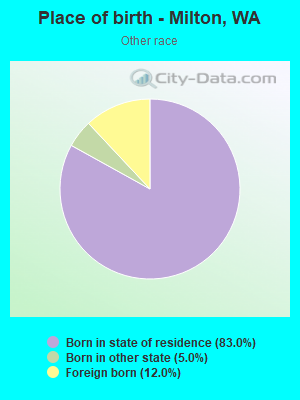
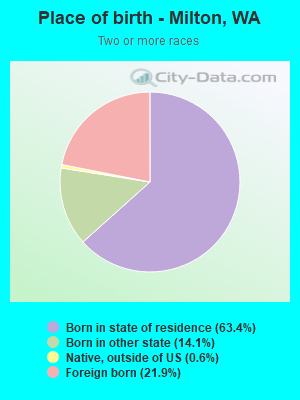
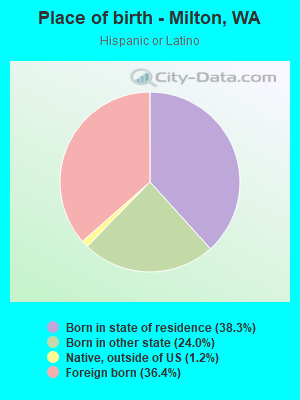
Place of birth - Born in state of residence (%)
Place of birth - Born in state of residence (%) - White
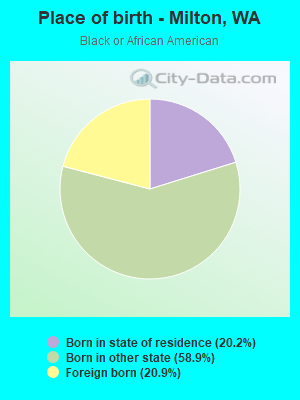
Place of birth - Born in state of residence (%) - Black or African American
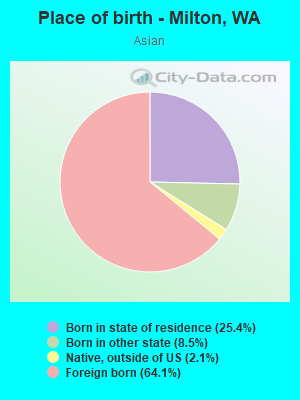
Place of birth - Born in state of residence (%) - Asian
Place of birth - Born in state of residence (%) - Hispanic or Latino
Place of birth - Born in state of residence (%) - American Indian and Alaska Native
Place of birth - Born in state of residence (%) - Multirace
Place of birth - Born in state of residence (%) - Other Race
Place of birth - Born in other state (%)
Place of birth - Born in other state (%) - White
Place of birth - Born in other state (%) - Black or African American
Place of birth - Born in other state (%) - Asian
Place of birth - Born in other state (%) - Hispanic or Latino
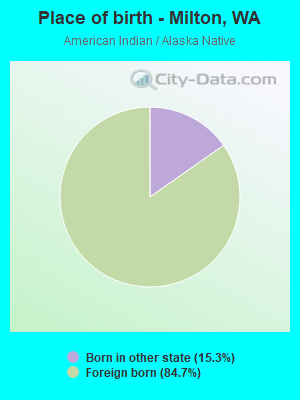
Place of birth - Born in other state (%) - American Indian and Alaska Native
Place of birth - Born in other state (%) - Multirace
Place of birth - Born in other state (%) - Other Race
Place of birth - Native, outside of US (%)
Place of birth - Native, outside of US (%) - White
Place of birth - Native, outside of US (%) - Black or African American
Place of birth - Native, outside of US (%) - Asian
Place of birth - Native, outside of US (%) - Hispanic or Latino
Place of birth - Native, outside of US (%) - American Indian and Alaska Native
Place of birth - Native, outside of US (%) - Multirace
Place of birth - Native, outside of US (%) - Other Race
Place of birth - Foreign born (%)
Place of birth - Foreign born (%) - White
Place of birth - Foreign born (%) - Black or African American
Place of birth - Foreign born (%) - Asian
Place of birth - Foreign born (%) - Hispanic or Latino
Place of birth - Foreign born (%) - American Indian and Alaska Native
Place of birth - Foreign born (%) - Multirace
Place of birth - Foreign born (%) - Other Race
Residents speaking English at home (%)
Residents speaking English at home - Born in the United States (%)
Residents speaking English at home - Native, born elsewhere (%)
Residents speaking English at home - Foreign born (%)
Residents speaking Spanish at home (%)
Residents speaking Spanish at home - Born in the United States (%)
Residents speaking Spanish at home - Native, born elsewhere (%)
Residents speaking Spanish at home - Foreign born (%)
Residents speaking other language at home (%)
Residents speaking other language at home - Born in the United States (%)
Residents speaking other language at home - Native, born elsewhere (%)
Residents speaking other language at home - Foreign born (%)
Marital status - Never married (%)
Marital status - Now married (%)
Marital status - Separated (%)
Marital status - Widowed (%)
Marital status - Divorced (%)
Ancestries Reported - Arab (%)
Ancestries Reported - Czech (%)
Ancestries Reported - Danish (%)
Ancestries Reported - Dutch (%)
Ancestries Reported - English (%)
Ancestries Reported - French (%)
Ancestries Reported - French Canadian (%)
Ancestries Reported - German (%)
Ancestries Reported - Greek (%)
Ancestries Reported - Hungarian (%)
Ancestries Reported - Irish (%)
Ancestries Reported - Italian (%)
Ancestries Reported - Lithuanian (%)
Ancestries Reported - Norwegian (%)
Ancestries Reported - Polish (%)
Ancestries Reported - Portuguese (%)
Ancestries Reported - Russian (%)
Ancestries Reported - Scotch-Irish (%)
Ancestries Reported - Scottish (%)
Ancestries Reported - Slovak (%)
Ancestries Reported - Subsaharan African (%)
Ancestries Reported - Swedish (%)
Ancestries Reported - Swiss (%)
Ancestries Reported - Ukrainian (%)
Ancestries Reported - United States (%)
Ancestries Reported - Welsh (%)
Ancestries Reported - West Indian (%)
Ancestries Reported - Other (%)
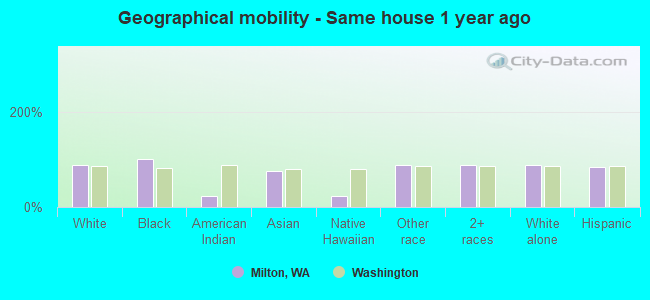
Geographical mobility - Same house 1 year ago (%)
Geographical mobility - Same house 1 year ago (%) - White
Geographical mobility - Same house 1 year ago (%) - Black or African American
Geographical mobility - Same house 1 year ago (%) - Asian
Geographical mobility - Same house 1 year ago (%) - Hispanic or Latino
Geographical mobility - Same house 1 year ago (%) - American Indian and Alaska Native
Geographical mobility - Same house 1 year ago (%) - Multirace
Geographical mobility - Same house 1 year ago (%) - Other Race
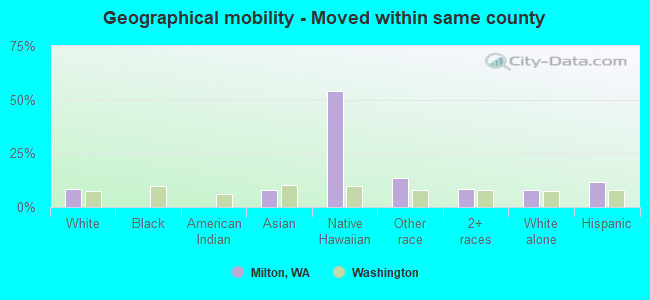
Geographical mobility - Moved within same county (%)
Geographical mobility - Moved within same county (%) - White
Geographical mobility - Moved within same county (%) - Black or African American
Geographical mobility - Moved within same county (%) - Asian
Geographical mobility - Moved within same county (%) - Hispanic or Latino
Geographical mobility - Moved within same county (%) - American Indian and Alaska Native
Geographical mobility - Moved within same county (%) - Multirace
Geographical mobility - Moved within same county (%) - Other Race
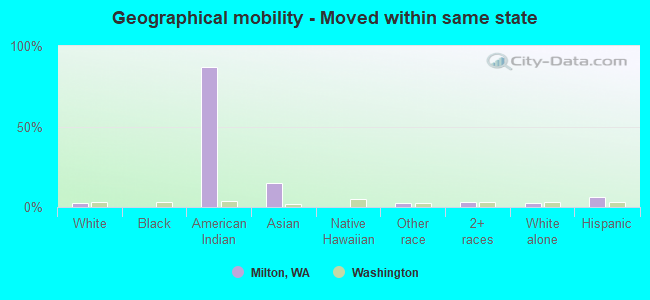
Geographical mobility - Moved from different county within same state (%)
Geographical mobility - Moved from different county within same state (%) - White
Geographical mobility - Moved from different county within same state (%) - Black or African American
Geographical mobility - Moved from different county within same state (%) - Asian
Geographical mobility - Moved from different county within same state (%) - Hispanic or Latino
Geographical mobility - Moved from different county within same state (%) - American Indian and Alaska Native
Geographical mobility - Moved from different county within same state (%) - Multirace
Geographical mobility - Moved from different county within same state (%) - Other Race
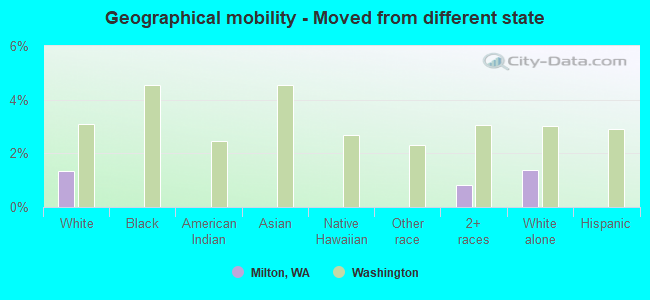
Geographical mobility - Moved from different state (%)
Geographical mobility - Moved from different state (%) - White
Geographical mobility - Moved from different state (%) - Black or African American
Geographical mobility - Moved from different state (%) - Asian
Geographical mobility - Moved from different state (%) - Hispanic or Latino
Geographical mobility - Moved from different state (%) - American Indian and Alaska Native
Geographical mobility - Moved from different state (%) - Multirace
Geographical mobility - Moved from different state (%) - Other Race
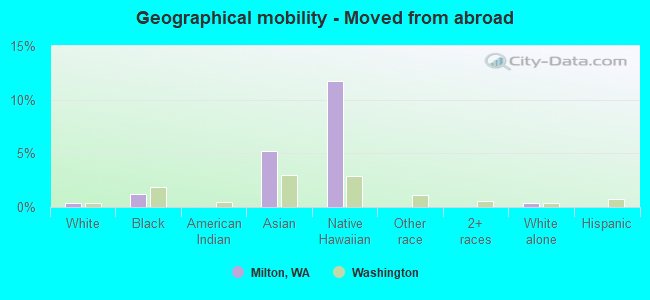
Geographical mobility - Moved from abroad (%)
Geographical mobility - Moved from abroad (%) - White
Geographical mobility - Moved from abroad (%) - Black or African American
Geographical mobility - Moved from abroad (%) - Asian
Geographical mobility - Moved from abroad (%) - Hispanic or Latino
Geographical mobility - Moved from abroad (%) - American Indian and Alaska Native
Geographical mobility - Moved from abroad (%) - Multirace
Geographical mobility - Moved from abroad (%) - Other Race
Place of birth for the foreign-born population - Ireland (%)
Place of birth for the foreign-born population - Denmark (%)
Place of birth for the foreign-born population - Norway (%)
Place of birth for the foreign-born population - Sweden (%)
Place of birth for the foreign-born population - United Kingdom (%)
Place of birth for the foreign-born population - England (%)
Place of birth for the foreign-born population - Scotland (%)
Place of birth for the foreign-born population - Other Northern Europe (%)
Place of birth for the foreign-born population - Austria (%)
Place of birth for the foreign-born population - Belgium (%)
Place of birth for the foreign-born population - France (%)
Place of birth for the foreign-born population - Germany (%)
Place of birth for the foreign-born population - Netherlands (%)
Place of birth for the foreign-born population - Switzerland (%)
Place of birth for the foreign-born population - Other Western Europe (%)
Place of birth for the foreign-born population - Greece (%)
Place of birth for the foreign-born population - Italy (%)
Place of birth for the foreign-born population - Portugal (%)
Place of birth for the foreign-born population - Spain (%)
Place of birth for the foreign-born population - Other Southern Europe (%)
Place of birth for the foreign-born population - Albania (%)
Place of birth for the foreign-born population - Belarus (%)
Place of birth for the foreign-born population - Bosnia and Herzegovina (%)
Place of birth for the foreign-born population - Bulgaria (%)
Place of birth for the foreign-born population - Croatia (%)
Place of birth for the foreign-born population - Czechoslovakia (%)
Place of birth for the foreign-born population - Hungary (%)
Place of birth for the foreign-born population - Latvia (%)
Place of birth for the foreign-born population - Lithuania (%)
Place of birth for the foreign-born population - North Macedonia (Macedonia) (%)
Place of birth for the foreign-born population - Moldova (%)
Place of birth for the foreign-born population - Poland (%)
Place of birth for the foreign-born population - Romania (%)
Place of birth for the foreign-born population - Russia (%)
Place of birth for the foreign-born population - Serbia (%)
Place of birth for the foreign-born population - Ukraine (%)
Place of birth for the foreign-born population - Other Eastern Europe (%)
Place of birth for the foreign-born population - China (%)
Place of birth for the foreign-born population - Hong Kong (%)
Place of birth for the foreign-born population - Taiwan (%)
Place of birth for the foreign-born population - Japan (%)
Place of birth for the foreign-born population - Korea (%)
Place of birth for the foreign-born population - Other Eastern Asia (%)
Place of birth for the foreign-born population - Afghanistan (%)
Place of birth for the foreign-born population - Bangladesh (%)
Place of birth for the foreign-born population - India (%)
Place of birth for the foreign-born population - Iran (%)
Place of birth for the foreign-born population - Kazakhstan (%)
Place of birth for the foreign-born population - Nepal (%)
Place of birth for the foreign-born population - Pakistan (%)
Place of birth for the foreign-born population - Sri Lanka (%)
Place of birth for the foreign-born population - Uzbekistan (%)
Place of birth for the foreign-born population - Other South Central Asia (%)
Place of birth for the foreign-born population - Burma (%)
Place of birth for the foreign-born population - Cambodia (%)
Place of birth for the foreign-born population - Indonesia (%)
Place of birth for the foreign-born population - Laos (%)
Place of birth for the foreign-born population - Malaysia (%)
Place of birth for the foreign-born population - Philippines (%)
Place of birth for the foreign-born population - Singapore (%)
Place of birth for the foreign-born population - Thailand (%)
Place of birth for the foreign-born population - Vietnam (%)
Place of birth for the foreign-born population - Other South Eastern Asia (%)
Place of birth for the foreign-born population - Armenia (%)
Place of birth for the foreign-born population - Iraq (%)
Place of birth for the foreign-born population - Israel (%)
Place of birth for the foreign-born population - Jordan (%)
Place of birth for the foreign-born population - Kuwait (%)
Place of birth for the foreign-born population - Lebanon (%)
Place of birth for the foreign-born population - Saudi Arabia (%)
Place of birth for the foreign-born population - Syria (%)
Place of birth for the foreign-born population - Turkey (%)
Place of birth for the foreign-born population - Yemen (%)
Place of birth for the foreign-born population - Other Western Asia (%)
Place of birth for the foreign-born population - Eritrea (%)
Place of birth for the foreign-born population - Ethiopia (%)
Place of birth for the foreign-born population - Kenya (%)
Place of birth for the foreign-born population - Somalia (%)
Place of birth for the foreign-born population - Uganda (%)
Place of birth for the foreign-born population - Zimbabwe (%)
Place of birth for the foreign-born population - Other Eastern Africa (%)
Place of birth for the foreign-born population - Cameroon (%)
Place of birth for the foreign-born population - Congo (%)
Place of birth for the foreign-born population - Democratic Republic of Congo (Zaire) (%)
Place of birth for the foreign-born population - Other Middle Africa (%)
Place of birth for the foreign-born population - Egypt (%)
Place of birth for the foreign-born population - Morocco (%)
Place of birth for the foreign-born population - Sudan (%)
Place of birth for the foreign-born population - Other Northern Africa (%)
Place of birth for the foreign-born population - South Africa (%)
Place of birth for the foreign-born population - Other Southern Africa (%)
Place of birth for the foreign-born population - Cabo Verde (%)
Place of birth for the foreign-born population - Ghana (%)
Place of birth for the foreign-born population - Liberia (%)
Place of birth for the foreign-born population - Nigeria (%)
Place of birth for the foreign-born population - Senegal (%)
Place of birth for the foreign-born population - Sierra Leone (%)
Place of birth for the foreign-born population - Other Western Africa (%)
Place of birth for the foreign-born population - Australia (%)
Place of birth for the foreign-born population - New Zealand (%)
Place of birth for the foreign-born population - Fiji (%)
Place of birth for the foreign-born population - Micronesia (%)
Place of birth for the foreign-born population - Bahamas (%)
Place of birth for the foreign-born population - Barbados (%)
Place of birth for the foreign-born population - Cuba (%)
Place of birth for the foreign-born population - Dominica (%)
Place of birth for the foreign-born population - Dominican Republic (%)
Place of birth for the foreign-born population - Grenada (%)
Place of birth for the foreign-born population - Haiti (%)
Place of birth for the foreign-born population - Jamaica (%)
Place of birth for the foreign-born population - St. Vincent and the Grenadines (%)
Place of birth for the foreign-born population - Trinidad and Tobago (%)
Place of birth for the foreign-born population - West Indies (%)
Place of birth for the foreign-born population - Other Caribbean (%)
Place of birth for the foreign-born population - Belize (%)
Place of birth for the foreign-born population - Costa Rica (%)
Place of birth for the foreign-born population - El Salvador (%)
Place of birth for the foreign-born population - Guatemala (%)
Place of birth for the foreign-born population - Honduras (%)
Place of birth for the foreign-born population - Mexico (%)
Place of birth for the foreign-born population - Nicaragua (%)
Place of birth for the foreign-born population - Panama (%)
Place of birth for the foreign-born population - Other Central America (%)
Place of birth for the foreign-born population - Argentina (%)
Place of birth for the foreign-born population - Bolivia (%)
Place of birth for the foreign-born population - Brazil (%)
Place of birth for the foreign-born population - Chile (%)
Place of birth for the foreign-born population - Colombia (%)
Place of birth for the foreign-born population - Ecuador (%)
Place of birth for the foreign-born population - Guyana (%)
Place of birth for the foreign-born population - Peru (%)
Place of birth for the foreign-born population - Uruguay (%)
Place of birth for the foreign-born population - Venezuela (%)
Place of birth for the foreign-born population - Other South America (%)
Place of birth for the foreign-born population - Canada (%)
Place of birth for the foreign-born population - Other Northern America (%)
Place of birth for the foreign-born population - Other (%)
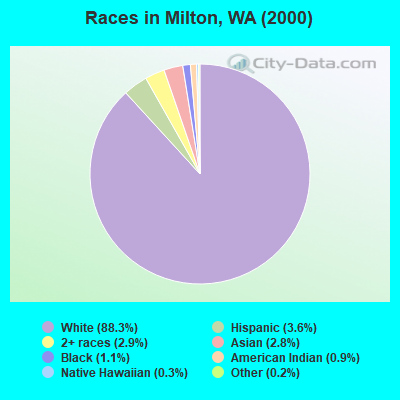
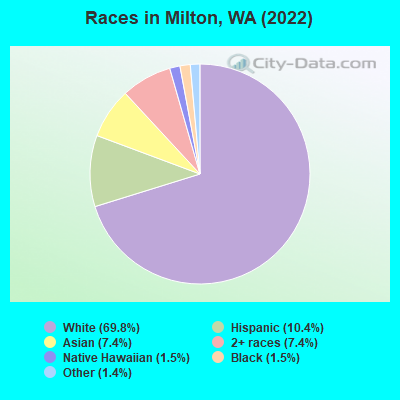
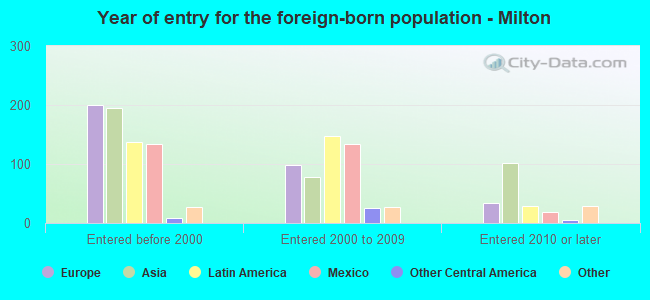
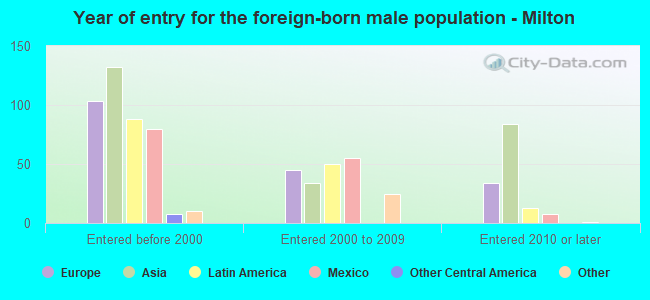
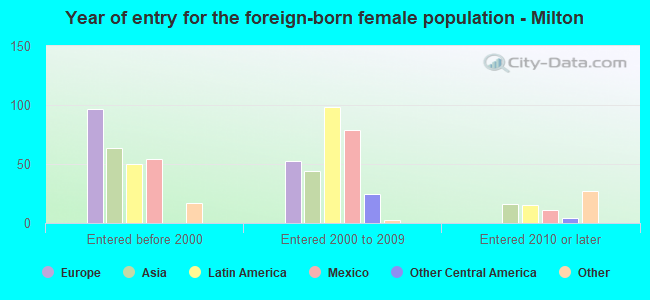
According to 2022 data, the most numerous races in Milton, WA are White alone (6,018 residents), Hispanic (895 residents), and Asian alone (642 residents). 78.9% of Milton residents speak English at home. 13.5% of Milton, WA residents are foreign-born (4.2% born in Asia, 4.1% born in Europe, 3.6% born in Latin America), which is 10.7% less than the foreign-born rate of 15.0% across the entire state of Washington.
Race distribution in Milton
2000 2022
4,652,490 78.9% White alone 441,509 7.5% Hispanic 319,401 5.4% Asian alone 184,631 3.1% Black alone 175,926 3.0% Two or more races 85,396 1.4% American Indian alone 22,779 0.4% Native Hawaiian and Other 11,989 0.2% Other race alone
4,941,456 63.5% White alone 1,093,313 14.0% Hispanic 755,832 9.7% Asian alone 523,448 6.7% Two or more races 299,537 3.8% Black alone 69,024 0.9% American Indian alone 52,231 0.7% Native Hawaiian and Other 50,945 0.7% Other race alone
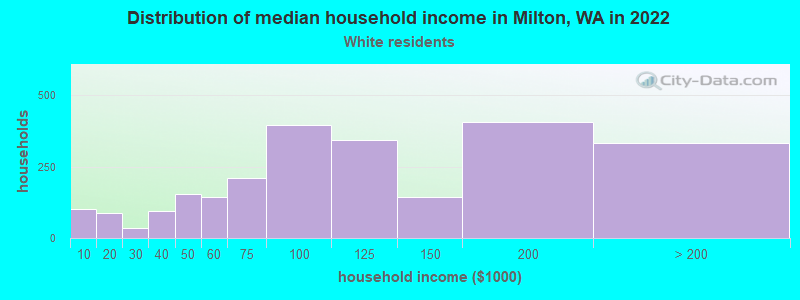
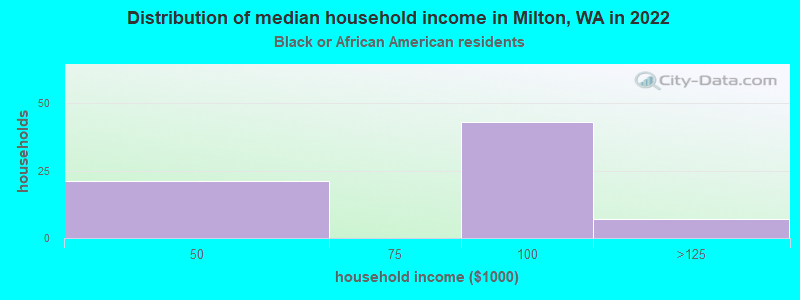
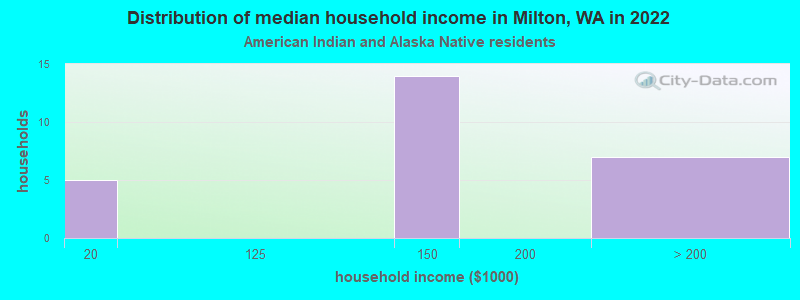
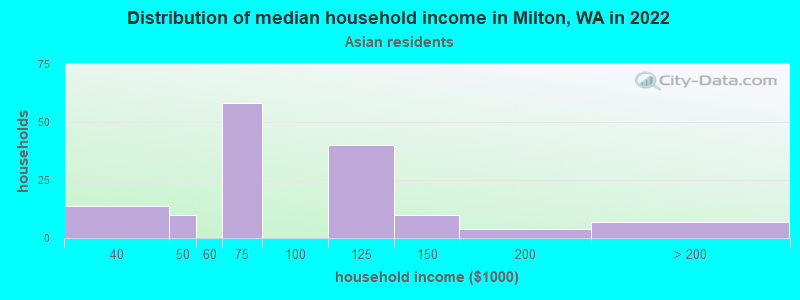
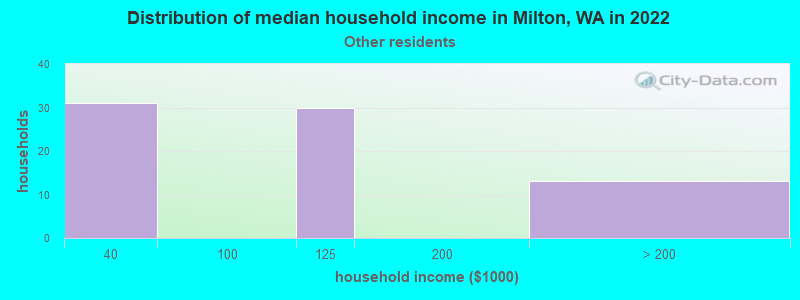
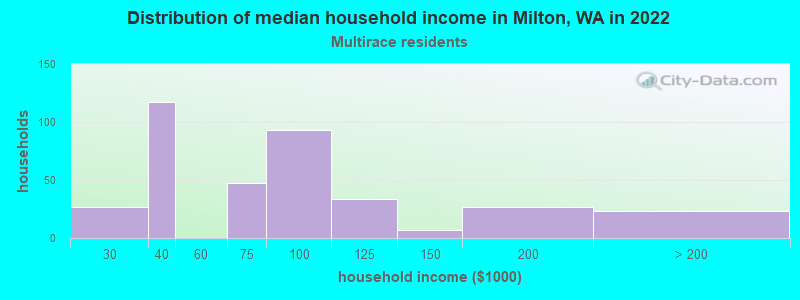
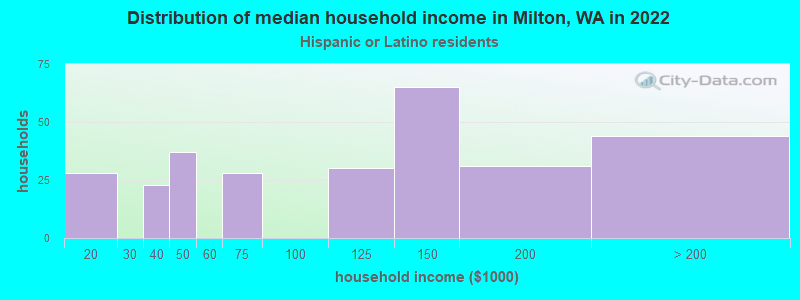
Income and house value in Milton Median household income in 2022 $95,476 White non-Hispanic householders$87,393 Black householders$190,432 American Indian and Alaska Native householders$69,342 Asian householders$85,607 Two or more races householders$112,556 Hispanic or Latino race householdersMedian 2022 house value $548,583 White Non-Hispanic householders$230,696 American Indian or Alaska Native householders $389,470 Asian householders$527,888 Two or more races householders$567,242 Hispanic or Latino householders
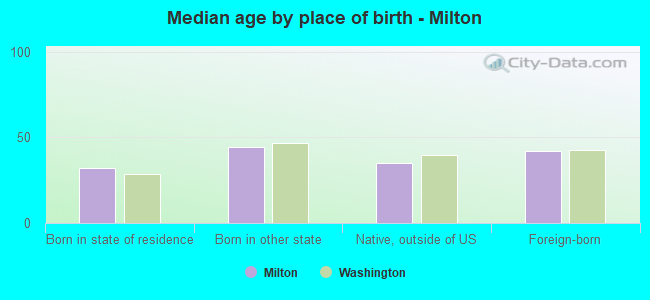
Median age by race in Milton
40.3 Median age for White residents40.9 39.9 53.2 Median age for Black or African American residents66.0 22.5 26.3 Median age for American Indian / Alaska Native residents35.6 24.3 42.7 Median age for Asian residents44.3 41.1 30.2 Median age for Native Hawaiian / Pacific Islander residents39.8 28.0 32.6 Median age for Other race residents38.2 34.4 24.4 Median age for Two or more races residents32.9 24.6 41.5 Median age for White alone residents42.6 40.4 27.8 Median age for Hispanic or Latino residents24.9 32.0
Owner/renter occupied households by race in Milton
House owners and renters - White residents 1,503 61.8% Owner occupied930 38.2% Renter occupiedHouse owners and renters - Black or African American residents 72 100.0% Renter occupiedHouse owners and renters - American Indian / Alaska Native residents 17 100.0% Owner occupiedHouse owners and renters - Asian residents 168 77.4% Owner occupied49 22.6% Renter occupiedHouse owners and renters - Native Hawaiian / Pacific Islander residents 20 37.4% Owner occupied34 62.6% Renter occupiedHouse owners and renters - Other race residents 14 25.3% Owner occupied41 74.7% Renter occupiedHouse owners and renters - Two or more races residents 61 15.6% Owner occupied328 84.4% Renter occupiedHouse owners and renters - White alone residents 1,440 62.3% Owner occupied871 37.7% Renter occupiedHouse owners and renters - Hispanic or Latino residents 127 48.1% Owner occupied137 51.9% Renter occupied
Language usage in Milton
English speakers - Total 78.9% of residents of Milton speak English at home.
7.2% of residents speak Spanish at home 367 61.2% Speak English very well233 38.8% Speak English less than very well14.0% of residents speak other language at home 729 63.1% Speak English very well426 36.9% Speak English less than very well
English speakers - Born in the United States 90.9% of residents of Milton speak English at home.
5.4% of residents speak Spanish at home 129 97.0% Speak English very well4 3.0% Speak English less than very well3.6% of residents speak other language at home 78 86.7% Speak English very well12 13.3% Speak English less than very well
English speakers - Native, born elsewhere 91.1% of residents of Milton speak English at home.
3.3% of residents speak Spanish at home 7 100.0% Speak English very well8.4% of residents speak other language at home 18 100.0% Speak English less than very well
English speakers - Foreign-born 16.9% of residents of Milton speak English at home.
22.1% of residents speak Spanish at home 65 24.4% Speak English very well201 75.6% Speak English less than very well61.0% of residents speak other language at home 385 52.5% Speak English very well349 47.5% Speak English less than very well
White (Caucasian) - Speak only English Native:
91.5% (5,169)Foreign-born:
12.5% (60)
White (Caucasian) - Speak another language Native:
6.6% (371)Foreign-born:
90.7% (437)
Black or African American - Speak only English Native:
99.6% (103)Foreign-born:
4.8% (1)
American Indian / Alaska Native - Speak another language Native:
55.7% (8)Foreign-born:
100.0% (68)
Asian - Speak only English Native:
66.9% (147)Foreign-born:
33.4% (136)
Asian - Speak another language Native:
33.4% (73)Foreign-born:
70.1% (285)
Other race - Speak another language Native:
31.7% (50)Foreign-born:
99.0% (23)
Two or more races - Speak only English Native:
87.3% (628)Foreign-born:
14.8% (37)
Two or more races - Speak another language Native:
12.2% (88)Foreign-born:
82.3% (206)
White alone - Speak only English Native:
93.7% (5,102)Foreign-born:
14.6% (64)
White alone - Speak another language Native:
5.4% (295)Foreign-born:
92.1% (402)
Hispanic or Latino - Speak only English Native:
44.8% (234)Foreign-born:
7.9% (26)
Hispanic or Latino - Speak another language Native:
53.0% (277)Foreign-born:
92.0% (303)
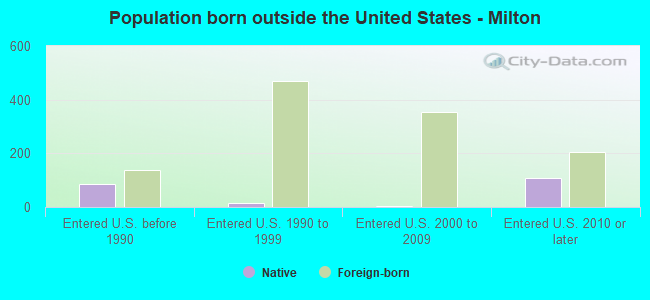
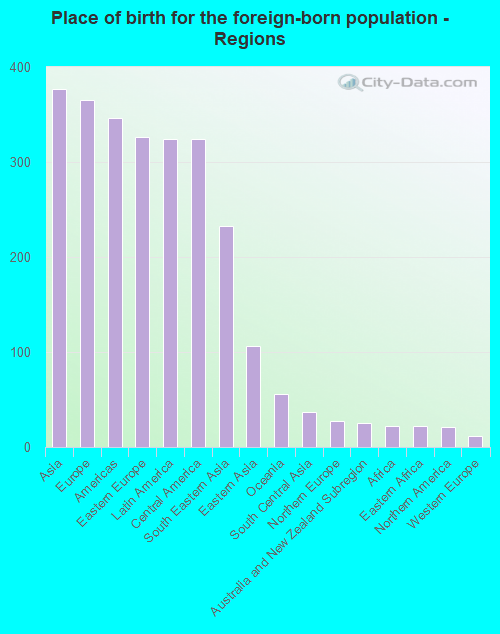
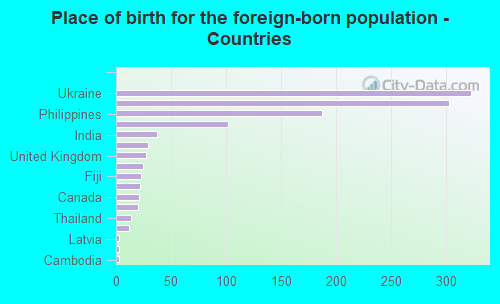
Foreign-born residents in Milton 1,168 residents are foreign born (4.2% Asia , 4.1% Europe , 3.6% Latin America ).
This city:
13.5%Washington:
14.9%
Marital status for residents in Milton Marital status - White (Caucasian) population 15 years and over
Males 38.9% Never married44.5% Now married0.0% Separated3.1% Widowed13.5% DivorcedFemales 26.1% Never married45.1% Now married2.2% Separated10.8% Widowed15.8% DivorcedWomen who gave birth in the past 12 months Now married:
100.0% (20)Unmarried:
0.0% (0)
Women who did not give birth in the past 12 months Now married:
43.4% (562)Unmarried:
56.6% (733)
Marital status - Black or African American population 15 years and over
Males 36.4% Never married7.6% Now married0.0% Separated0.0% Widowed56.1% DivorcedFemales 100.0% Never married0.0% Now married0.0% Separated0.0% Widowed0.0% DivorcedWomen who did not give birth in the past 12 months Now married:
0.0% (0)Unmarried:
100.0% (39)
Marital status - American Indian / Alaska Native population 15 years and over
Males 24.3% Never married43.2% Now married0.0% Separated16.2% Widowed16.2% DivorcedFemales 0.0% Never married100.0% Now married0.0% Separated0.0% Widowed0.0% DivorcedWomen who did not give birth in the past 12 months Now married:
100.0% (9)Unmarried:
0.0% (0)
Marital status - Asian population 15 years and over
Males 31.8% Never married50.2% Now married0.0% Separated13.0% Widowed5.1% DivorcedFemales 28.3% Never married28.7% Now married0.0% Separated4.2% Widowed38.8% DivorcedWomen who did not give birth in the past 12 months Now married:
30.8% (42)Unmarried:
69.2% (94)
Marital status - Native Hawaiian / Pacific Islander population 15 years and over
Males 48.7% Never married51.3% Now married0.0% Separated0.0% Widowed0.0% DivorcedFemales 97.3% Never married2.7% Now married0.0% Separated0.0% Widowed0.0% DivorcedWomen who did not give birth in the past 12 months Now married:
2.7% (2)Unmarried:
97.3% (82)
Marital status - Other race population 15 years and over
Males 83.6% Never married16.4% Now married0.0% Separated0.0% Widowed0.0% DivorcedFemales 55.7% Never married19.0% Now married0.0% Separated0.0% Widowed25.3% DivorcedWomen who did not give birth in the past 12 months Now married:
21.4% (16)Unmarried:
78.6% (60)
Marital status - Two or more races population 15 years and over
Males 53.6% Never married42.0% Now married3.2% Separated1.2% Widowed0.0% DivorcedFemales 46.6% Never married51.0% Now married0.0% Separated0.0% Widowed2.4% DivorcedWomen who did not give birth in the past 12 months Now married:
40.1% (145)Unmarried:
59.9% (216)
Marital status - White alone, not Hispanic / Latino population 15 years and over
Males 38.0% Never married45.8% Now married0.0% Separated3.3% Widowed12.9% DivorcedFemales 26.0% Never married45.5% Now married0.9% Separated11.5% Widowed16.1% DivorcedWomen who gave birth in the past 12 months Now married:
100.0% (13)Unmarried:
0.0% (0)
Women who did not give birth in the past 12 months Now married:
41.5% (492)Unmarried:
58.5% (694)
Marital status - Hispanic or Latino population 15 years and over
Males 41.3% Never married44.0% Now married0.0% Separated0.0% Widowed14.8% DivorcedFemales 21.4% Never married53.7% Now married12.2% Separated0.0% Widowed12.6% DivorcedWomen who gave birth in the past 12 months Now married:
100.0% (9)Unmarried:
0.0% (0)
Women who did not give birth in the past 12 months Now married:
61.9% (160)Unmarried:
38.1% (98)
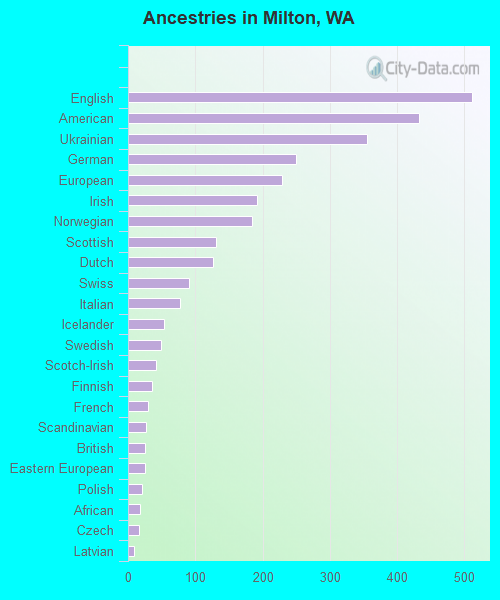
Ancestries in Milton
511 12.1% English433 10.3% American355 8.4% Ukrainian250 5.9% German229 5.4% European191 4.5% Irish185 4.4% Norwegian131 3.1% Scottish127 3.0% Dutch90 2.1% Swiss77 1.8% Italian53 1.3% Icelander49 1.2% Swedish41 1.0% Scotch-Irish35 0.8% Finnish29 0.7% French27 0.6% Scandinavian26 0.6% British26 0.6% Eastern European21 0.5% Polish18 0.4% African17 0.4% Czech9 0.2% Latvian2 0.05% Danish2 0.05% Portuguese
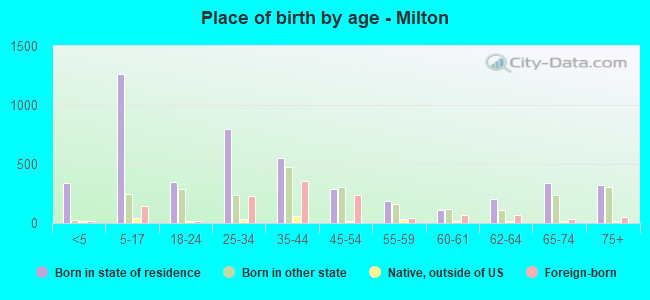
Children Nativity (place of birth) in Milton
Children under 6 years - Living with two parents Both parents native 174 100.0% NativeBoth parents foreign-born 75 65.4% Native40 34.6% Foreign-bornOne native, one foreign-born parent 22 100.0% NativeChildren under 6 years - Living with one parent Native parent 210 100.0% NativeChildren 6 to 17 years - Living with two parents Both parents native 387 100.0% NativeBoth parents foreign-born 290 89.4% Native34 10.6% Foreign-bornOne native, one foreign-born parent 67 100.0% NativeChildren 6 to 17 years - Living with one parent Native parent 355 100.0% NativeForeign-born parent 100 49.7% Native101 50.3% Foreign-born
Grandparents responsible for own grandchildren in Milton
Grandparents (30 to 59 years) White / Caucasian 15 100.0% Not responsible for grandchildrenNative Hawaiian / Pacific Islander 10 100.0% Not responsible for grandchildrenTwo or more races 7 35.0% Responsible for grandchildren13 65.0% Not responsible for grandchildrenWhite alone, not Hispanic / Latino 15 100.0% Not responsible for grandchildrenHispanic or Latino 9 33.8% Responsible for grandchildren18 66.2% Not responsible for grandchildren
Grandparents (60 years and over) White / Caucasian 45 100.0% Not responsible for grandchildrenWhite alone, not Hispanic / Latino 46 100.0% Not responsible for grandchildren