Races in Mineola, New York (NY) Detailed Stats
Data:
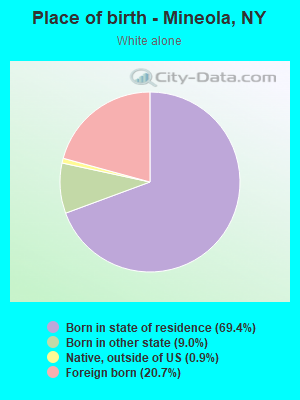
Races - White alone (%)
Races - White alone (% change since 2000)
Races - Black alone (%)
Races - Black alone (% change since 2000)
Races - American Indian alone (%)
Races - American Indian alone (% change since 2000)
Races - Asian alone (%)
Races - Asian alone (% change since 2000)
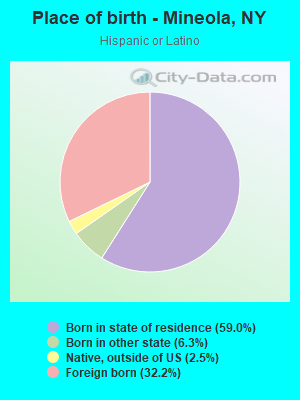
Races - Hispanic (%)
Races - Hispanic (% change since 2000)
Races - Native Hawaiian and Other Pacific Islander alone (%)
Races - Native Hawaiian and Other Pacific Islander alone (% change since 2000)
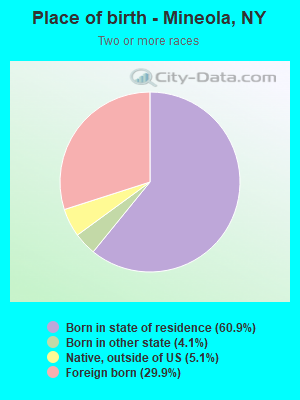
Races - Two or more races(%)
Races - Two or more races(% change since 2000)
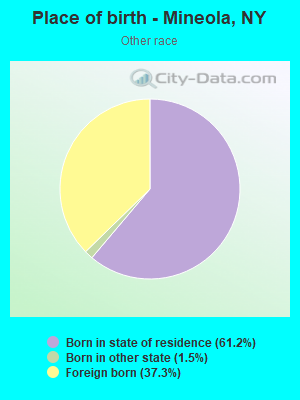
Races - Other race alone (%)
Races - Other race alone (% change since 2000)
Racial diversity
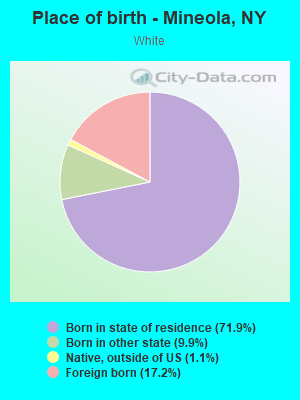
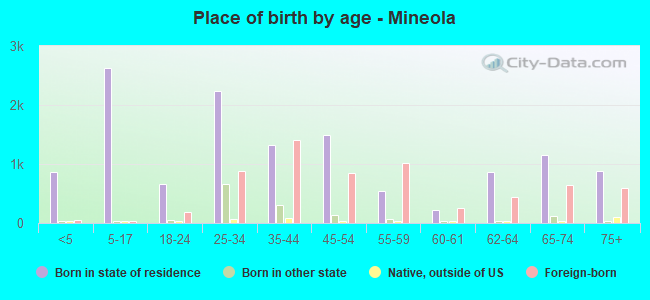
Place of birth - Born in state of residence (%)
Place of birth - Born in state of residence (%) - White
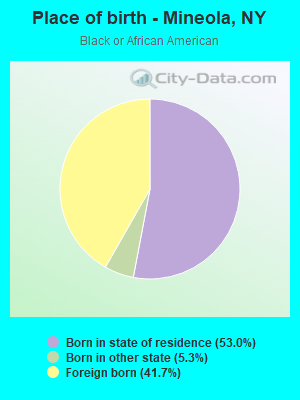
Place of birth - Born in state of residence (%) - Black or African American
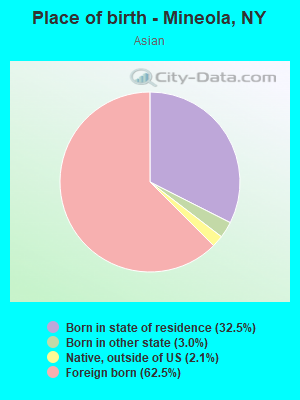
Place of birth - Born in state of residence (%) - Asian
Place of birth - Born in state of residence (%) - Hispanic or Latino
Place of birth - Born in state of residence (%) - American Indian and Alaska Native
Place of birth - Born in state of residence (%) - Multirace
Place of birth - Born in state of residence (%) - Other Race
Place of birth - Born in other state (%)
Place of birth - Born in other state (%) - White
Place of birth - Born in other state (%) - Black or African American
Place of birth - Born in other state (%) - Asian
Place of birth - Born in other state (%) - Hispanic or Latino
Place of birth - Born in other state (%) - American Indian and Alaska Native
Place of birth - Born in other state (%) - Multirace
Place of birth - Born in other state (%) - Other Race
Place of birth - Native, outside of US (%)
Place of birth - Native, outside of US (%) - White
Place of birth - Native, outside of US (%) - Black or African American
Place of birth - Native, outside of US (%) - Asian
Place of birth - Native, outside of US (%) - Hispanic or Latino
Place of birth - Native, outside of US (%) - American Indian and Alaska Native
Place of birth - Native, outside of US (%) - Multirace
Place of birth - Native, outside of US (%) - Other Race
Place of birth - Foreign born (%)
Place of birth - Foreign born (%) - White
Place of birth - Foreign born (%) - Black or African American
Place of birth - Foreign born (%) - Asian
Place of birth - Foreign born (%) - Hispanic or Latino
Place of birth - Foreign born (%) - American Indian and Alaska Native
Place of birth - Foreign born (%) - Multirace
Place of birth - Foreign born (%) - Other Race
Residents speaking English at home (%)
Residents speaking English at home - Born in the United States (%)
Residents speaking English at home - Native, born elsewhere (%)
Residents speaking English at home - Foreign born (%)
Residents speaking Spanish at home (%)
Residents speaking Spanish at home - Born in the United States (%)
Residents speaking Spanish at home - Native, born elsewhere (%)
Residents speaking Spanish at home - Foreign born (%)
Residents speaking other language at home (%)
Residents speaking other language at home - Born in the United States (%)
Residents speaking other language at home - Native, born elsewhere (%)
Residents speaking other language at home - Foreign born (%)
Marital status - Never married (%)
Marital status - Now married (%)
Marital status - Separated (%)
Marital status - Widowed (%)
Marital status - Divorced (%)
Ancestries Reported - Arab (%)
Ancestries Reported - Czech (%)
Ancestries Reported - Danish (%)
Ancestries Reported - Dutch (%)
Ancestries Reported - English (%)
Ancestries Reported - French (%)
Ancestries Reported - French Canadian (%)
Ancestries Reported - German (%)
Ancestries Reported - Greek (%)
Ancestries Reported - Hungarian (%)
Ancestries Reported - Irish (%)
Ancestries Reported - Italian (%)
Ancestries Reported - Lithuanian (%)
Ancestries Reported - Norwegian (%)
Ancestries Reported - Polish (%)
Ancestries Reported - Portuguese (%)
Ancestries Reported - Russian (%)
Ancestries Reported - Scotch-Irish (%)
Ancestries Reported - Scottish (%)
Ancestries Reported - Slovak (%)
Ancestries Reported - Subsaharan African (%)
Ancestries Reported - Swedish (%)
Ancestries Reported - Swiss (%)
Ancestries Reported - Ukrainian (%)
Ancestries Reported - United States (%)
Ancestries Reported - Welsh (%)
Ancestries Reported - West Indian (%)
Ancestries Reported - Other (%)
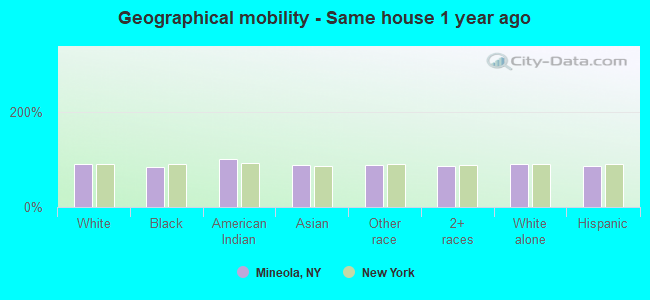
Geographical mobility - Same house 1 year ago (%)
Geographical mobility - Same house 1 year ago (%) - White
Geographical mobility - Same house 1 year ago (%) - Black or African American
Geographical mobility - Same house 1 year ago (%) - Asian
Geographical mobility - Same house 1 year ago (%) - Hispanic or Latino
Geographical mobility - Same house 1 year ago (%) - American Indian and Alaska Native
Geographical mobility - Same house 1 year ago (%) - Multirace
Geographical mobility - Same house 1 year ago (%) - Other Race
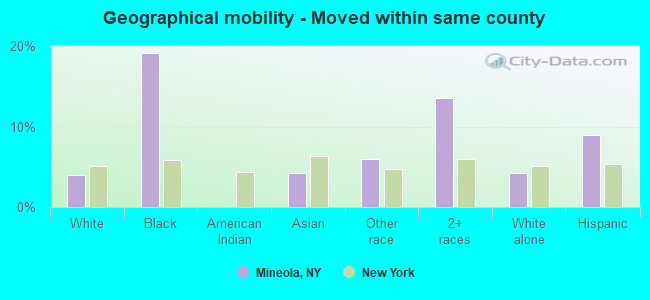
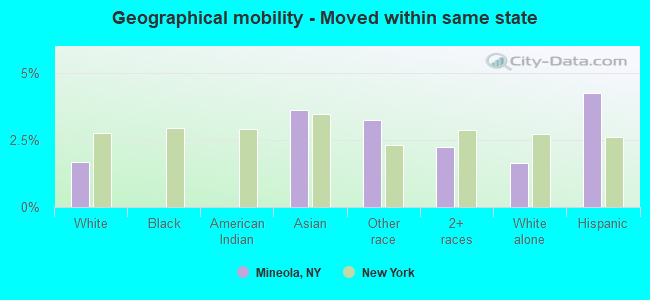
Geographical mobility - Moved within same county (%)
Geographical mobility - Moved within same county (%) - White
Geographical mobility - Moved within same county (%) - Black or African American
Geographical mobility - Moved within same county (%) - Asian
Geographical mobility - Moved within same county (%) - Hispanic or Latino
Geographical mobility - Moved within same county (%) - American Indian and Alaska Native
Geographical mobility - Moved within same county (%) - Multirace
Geographical mobility - Moved within same county (%) - Other Race
Geographical mobility - Moved from different county within same state (%)
Geographical mobility - Moved from different county within same state (%) - White
Geographical mobility - Moved from different county within same state (%) - Black or African American
Geographical mobility - Moved from different county within same state (%) - Asian
Geographical mobility - Moved from different county within same state (%) - Hispanic or Latino
Geographical mobility - Moved from different county within same state (%) - American Indian and Alaska Native
Geographical mobility - Moved from different county within same state (%) - Multirace
Geographical mobility - Moved from different county within same state (%) - Other Race
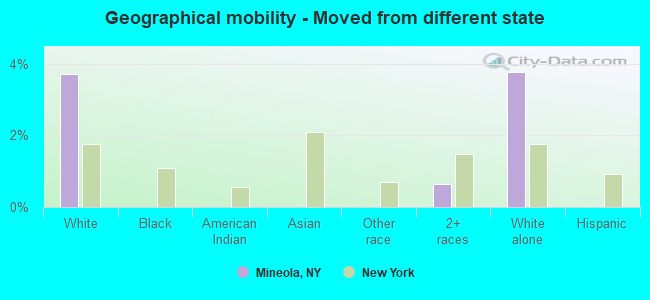
Geographical mobility - Moved from different state (%)
Geographical mobility - Moved from different state (%) - White
Geographical mobility - Moved from different state (%) - Black or African American
Geographical mobility - Moved from different state (%) - Asian
Geographical mobility - Moved from different state (%) - Hispanic or Latino
Geographical mobility - Moved from different state (%) - American Indian and Alaska Native
Geographical mobility - Moved from different state (%) - Multirace
Geographical mobility - Moved from different state (%) - Other Race
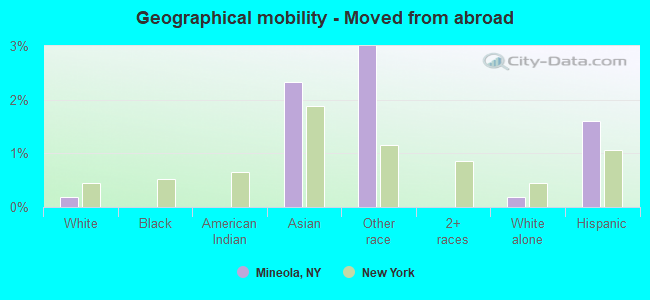
Geographical mobility - Moved from abroad (%)
Geographical mobility - Moved from abroad (%) - White
Geographical mobility - Moved from abroad (%) - Black or African American
Geographical mobility - Moved from abroad (%) - Asian
Geographical mobility - Moved from abroad (%) - Hispanic or Latino
Geographical mobility - Moved from abroad (%) - American Indian and Alaska Native
Geographical mobility - Moved from abroad (%) - Multirace
Geographical mobility - Moved from abroad (%) - Other Race
Place of birth for the foreign-born population - Ireland (%)
Place of birth for the foreign-born population - Denmark (%)
Place of birth for the foreign-born population - Norway (%)
Place of birth for the foreign-born population - Sweden (%)
Place of birth for the foreign-born population - United Kingdom (%)
Place of birth for the foreign-born population - England (%)
Place of birth for the foreign-born population - Scotland (%)
Place of birth for the foreign-born population - Other Northern Europe (%)
Place of birth for the foreign-born population - Austria (%)
Place of birth for the foreign-born population - Belgium (%)
Place of birth for the foreign-born population - France (%)
Place of birth for the foreign-born population - Germany (%)
Place of birth for the foreign-born population - Netherlands (%)
Place of birth for the foreign-born population - Switzerland (%)
Place of birth for the foreign-born population - Other Western Europe (%)
Place of birth for the foreign-born population - Greece (%)
Place of birth for the foreign-born population - Italy (%)
Place of birth for the foreign-born population - Portugal (%)
Place of birth for the foreign-born population - Spain (%)
Place of birth for the foreign-born population - Other Southern Europe (%)
Place of birth for the foreign-born population - Albania (%)
Place of birth for the foreign-born population - Belarus (%)
Place of birth for the foreign-born population - Bosnia and Herzegovina (%)
Place of birth for the foreign-born population - Bulgaria (%)
Place of birth for the foreign-born population - Croatia (%)
Place of birth for the foreign-born population - Czechoslovakia (%)
Place of birth for the foreign-born population - Hungary (%)
Place of birth for the foreign-born population - Latvia (%)
Place of birth for the foreign-born population - Lithuania (%)
Place of birth for the foreign-born population - North Macedonia (Macedonia) (%)
Place of birth for the foreign-born population - Moldova (%)
Place of birth for the foreign-born population - Poland (%)
Place of birth for the foreign-born population - Romania (%)
Place of birth for the foreign-born population - Russia (%)
Place of birth for the foreign-born population - Serbia (%)
Place of birth for the foreign-born population - Ukraine (%)
Place of birth for the foreign-born population - Other Eastern Europe (%)
Place of birth for the foreign-born population - China (%)
Place of birth for the foreign-born population - Hong Kong (%)
Place of birth for the foreign-born population - Taiwan (%)
Place of birth for the foreign-born population - Japan (%)
Place of birth for the foreign-born population - Korea (%)
Place of birth for the foreign-born population - Other Eastern Asia (%)
Place of birth for the foreign-born population - Afghanistan (%)
Place of birth for the foreign-born population - Bangladesh (%)
Place of birth for the foreign-born population - India (%)
Place of birth for the foreign-born population - Iran (%)
Place of birth for the foreign-born population - Kazakhstan (%)
Place of birth for the foreign-born population - Nepal (%)
Place of birth for the foreign-born population - Pakistan (%)
Place of birth for the foreign-born population - Sri Lanka (%)
Place of birth for the foreign-born population - Uzbekistan (%)
Place of birth for the foreign-born population - Other South Central Asia (%)
Place of birth for the foreign-born population - Burma (%)
Place of birth for the foreign-born population - Cambodia (%)
Place of birth for the foreign-born population - Indonesia (%)
Place of birth for the foreign-born population - Laos (%)
Place of birth for the foreign-born population - Malaysia (%)
Place of birth for the foreign-born population - Philippines (%)
Place of birth for the foreign-born population - Singapore (%)
Place of birth for the foreign-born population - Thailand (%)
Place of birth for the foreign-born population - Vietnam (%)
Place of birth for the foreign-born population - Other South Eastern Asia (%)
Place of birth for the foreign-born population - Armenia (%)
Place of birth for the foreign-born population - Iraq (%)
Place of birth for the foreign-born population - Israel (%)
Place of birth for the foreign-born population - Jordan (%)
Place of birth for the foreign-born population - Kuwait (%)
Place of birth for the foreign-born population - Lebanon (%)
Place of birth for the foreign-born population - Saudi Arabia (%)
Place of birth for the foreign-born population - Syria (%)
Place of birth for the foreign-born population - Turkey (%)
Place of birth for the foreign-born population - Yemen (%)
Place of birth for the foreign-born population - Other Western Asia (%)
Place of birth for the foreign-born population - Eritrea (%)
Place of birth for the foreign-born population - Ethiopia (%)
Place of birth for the foreign-born population - Kenya (%)
Place of birth for the foreign-born population - Somalia (%)
Place of birth for the foreign-born population - Uganda (%)
Place of birth for the foreign-born population - Zimbabwe (%)
Place of birth for the foreign-born population - Other Eastern Africa (%)
Place of birth for the foreign-born population - Cameroon (%)
Place of birth for the foreign-born population - Congo (%)
Place of birth for the foreign-born population - Democratic Republic of Congo (Zaire) (%)
Place of birth for the foreign-born population - Other Middle Africa (%)
Place of birth for the foreign-born population - Egypt (%)
Place of birth for the foreign-born population - Morocco (%)
Place of birth for the foreign-born population - Sudan (%)
Place of birth for the foreign-born population - Other Northern Africa (%)
Place of birth for the foreign-born population - South Africa (%)
Place of birth for the foreign-born population - Other Southern Africa (%)
Place of birth for the foreign-born population - Cabo Verde (%)
Place of birth for the foreign-born population - Ghana (%)
Place of birth for the foreign-born population - Liberia (%)
Place of birth for the foreign-born population - Nigeria (%)
Place of birth for the foreign-born population - Senegal (%)
Place of birth for the foreign-born population - Sierra Leone (%)
Place of birth for the foreign-born population - Other Western Africa (%)
Place of birth for the foreign-born population - Australia (%)
Place of birth for the foreign-born population - New Zealand (%)
Place of birth for the foreign-born population - Fiji (%)
Place of birth for the foreign-born population - Micronesia (%)
Place of birth for the foreign-born population - Bahamas (%)
Place of birth for the foreign-born population - Barbados (%)
Place of birth for the foreign-born population - Cuba (%)
Place of birth for the foreign-born population - Dominica (%)
Place of birth for the foreign-born population - Dominican Republic (%)
Place of birth for the foreign-born population - Grenada (%)
Place of birth for the foreign-born population - Haiti (%)
Place of birth for the foreign-born population - Jamaica (%)
Place of birth for the foreign-born population - St. Vincent and the Grenadines (%)
Place of birth for the foreign-born population - Trinidad and Tobago (%)
Place of birth for the foreign-born population - West Indies (%)
Place of birth for the foreign-born population - Other Caribbean (%)
Place of birth for the foreign-born population - Belize (%)
Place of birth for the foreign-born population - Costa Rica (%)
Place of birth for the foreign-born population - El Salvador (%)
Place of birth for the foreign-born population - Guatemala (%)
Place of birth for the foreign-born population - Honduras (%)
Place of birth for the foreign-born population - Mexico (%)
Place of birth for the foreign-born population - Nicaragua (%)
Place of birth for the foreign-born population - Panama (%)
Place of birth for the foreign-born population - Other Central America (%)
Place of birth for the foreign-born population - Argentina (%)
Place of birth for the foreign-born population - Bolivia (%)
Place of birth for the foreign-born population - Brazil (%)
Place of birth for the foreign-born population - Chile (%)
Place of birth for the foreign-born population - Colombia (%)
Place of birth for the foreign-born population - Ecuador (%)
Place of birth for the foreign-born population - Guyana (%)
Place of birth for the foreign-born population - Peru (%)
Place of birth for the foreign-born population - Uruguay (%)
Place of birth for the foreign-born population - Venezuela (%)
Place of birth for the foreign-born population - Other South America (%)
Place of birth for the foreign-born population - Canada (%)
Place of birth for the foreign-born population - Other Northern America (%)
Place of birth for the foreign-born population - Other (%)
Latest news about races in Mineola, NY collected exclusively by city-data.com from local newspapers, TV, and radio stations
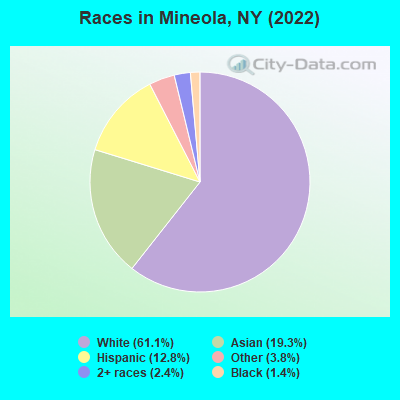
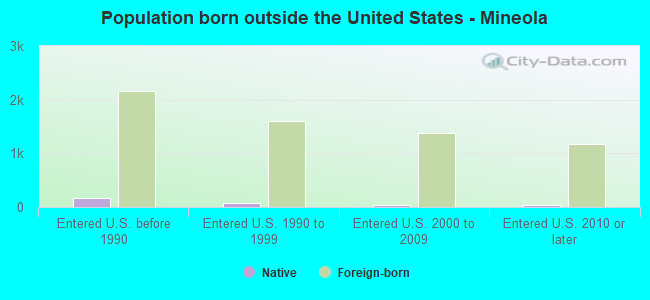
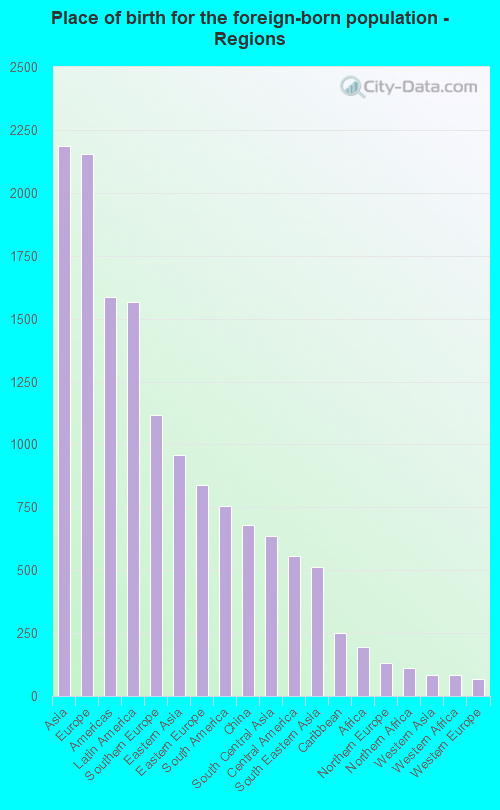
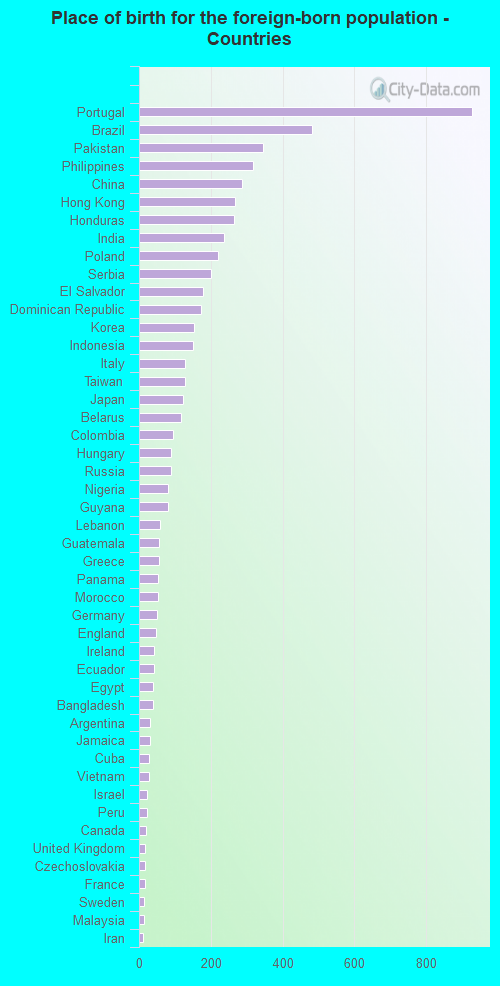
According to 2022 data, the most numerous races in Mineola, NY are White alone (12,753 residents), Hispanic (2,666 residents), and Black alone (301 residents). 62.0% of Mineola residents speak English at home. 29.3% of Mineola, NY residents are foreign-born (10.6% born in Asia, 10.4% born in Europe, 7.6% born in Latin America), which is 25.0% greater than the foreign-born rate of 22.0% across the entire state of New York.
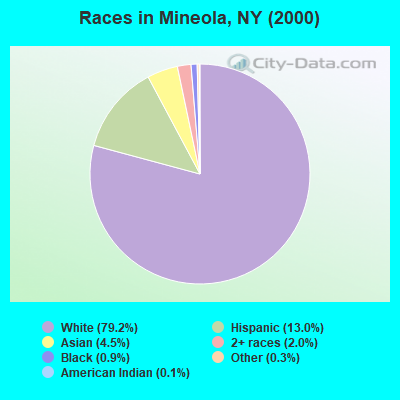
Race distribution in Mineola
2000 2022
11,760,981 62.0% White alone 2,867,583 15.1% Hispanic 2,812,623 14.8% Black alone 1,035,926 5.5% Asian alone 366,116 1.9% Two or more races 75,499 0.4% Other race alone 52,499 0.3% American Indian alone 5,230 0.03% Native Hawaiian and Other
10,408,933 52.9% White alone 3,867,299 19.7% Hispanic 2,633,840 13.4% Black alone 1,776,286 9.0% Asian alone 732,670 3.7% Two or more races 216,110 1.1% Other race alone 35,082 0.2% American Indian alone 6,931 0.04% Native Hawaiian and Other
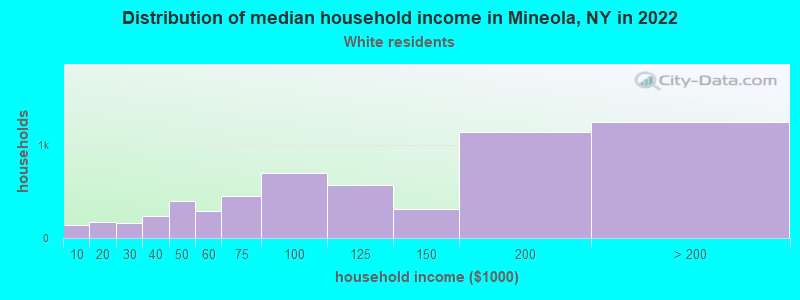
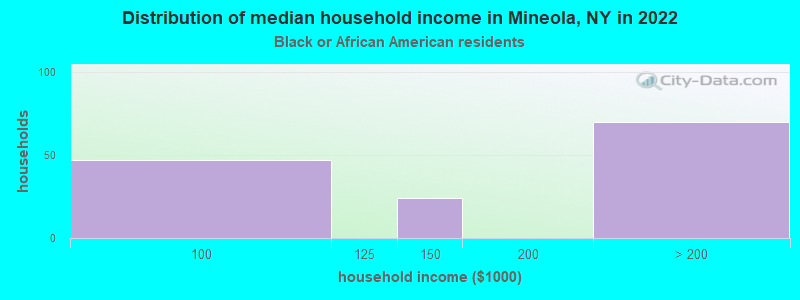
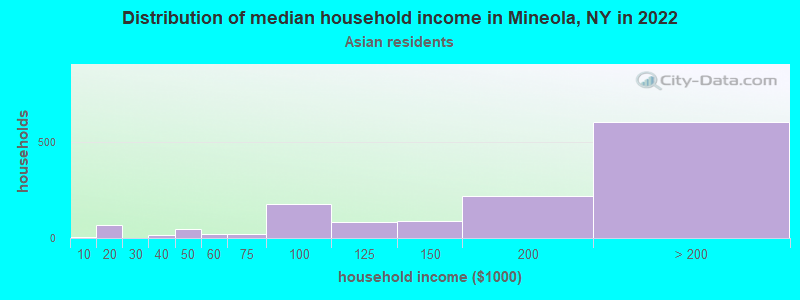
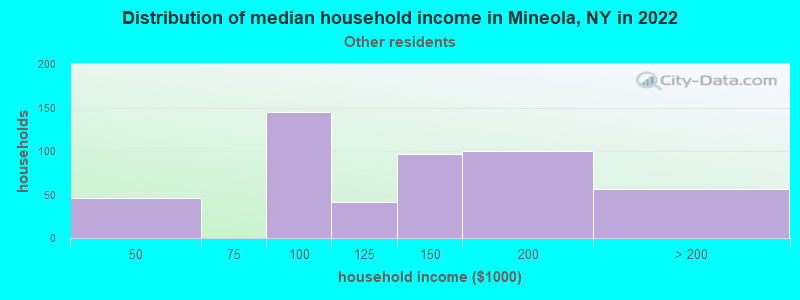
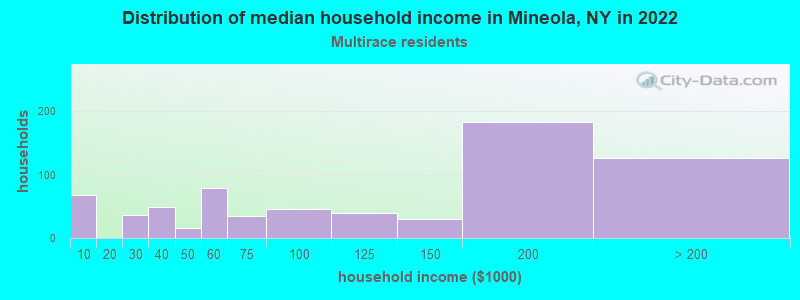
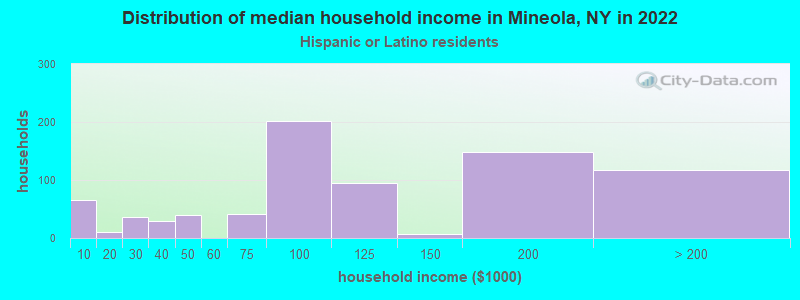
Income and house value in Mineola Median household income in 2022 $117,986 White non-Hispanic householdersover $200,000 Black householders$166,817 Asian householders$126,106 Some other race householders$105,079 Two or more races householders$96,025 Hispanic or Latino race householdersMedian 2022 house value $625,497 White Non-Hispanic householders $639,522 Asian householders$587,248 Some other race householders$624,732 Two or more races householders$682,106 Hispanic or Latino householders
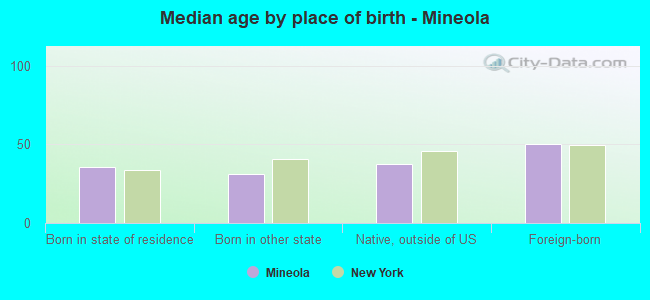
Median age by race in Mineola
46.4 Median age for White residents43.0 49.2 41.4 Median age for Black or African American residents32.0 44.9 -855,158,729.3 Median age for American Indian / Alaska Native residents-607,543,322.5 -837,121,211.3 36.0 Median age for Asian residents36.1 38.3 -487,992,314.6 Median age for Native Hawaiian / Pacific Islander residents-477,502,295.2 -497,387,669.3 39.7 Median age for Other race residents33.2 42.2 31.8 Median age for Two or more races residents32.1 31.4 46.0 Median age for White alone residents43.0 48.7 35.4 Median age for Hispanic or Latino residents32.7 38.6
Owner/renter occupied households by race in Mineola
House owners and renters - White residents 3,657 61.7% Owner occupied2,269 38.3% Renter occupiedHouse owners and renters - Black or African American residents 41 31.0% Owner occupied92 69.0% Renter occupiedHouse owners and renters - American Indian / Alaska Native residents 18 100.0% Owner occupiedHouse owners and renters - Asian residents 996 75.3% Owner occupied327 24.7% Renter occupiedHouse owners and renters - Other race residents 209 44.3% Owner occupied263 55.7% Renter occupiedHouse owners and renters - Two or more races residents 370 52.3% Owner occupied337 47.7% Renter occupiedHouse owners and renters - White alone residents 3,672 60.9% Owner occupied2,356 39.1% Renter occupiedHouse owners and renters - Hispanic or Latino residents 321 41.8% Owner occupied447 58.2% Renter occupied
Language usage in Mineola
English speakers - Total 62.0% of residents of Mineola speak English at home.
7.7% of residents speak Spanish at home 1,075 70.3% Speak English very well454 29.7% Speak English less than very well31.2% of residents speak other language at home 4,178 67.4% Speak English very well2,024 32.6% Speak English less than very well
English speakers - Born in the United States 86.1% of residents of Mineola speak English at home.
3.6% of residents speak Spanish at home 53 100.0% Speak English very well9.5% of residents speak other language at home 138 100.0% Speak English very well
English speakers - Native, born elsewhere 47.1% of residents of Mineola speak English at home.
9.2% of residents speak Spanish at home 30 100.0% Speak English less than very well51.7% of residents speak other language at home 80 47.3% Speak English very well89 52.7% Speak English less than very well
English speakers - Foreign-born 15.1% of residents of Mineola speak English at home.
12.7% of residents speak Spanish at home 384 48.1% Speak English very well414 51.9% Speak English less than very well75.2% of residents speak other language at home 2,821 59.8% Speak English very well1,896 40.2% Speak English less than very well
White (Caucasian) - Speak only English Native:
92.3% (9,410)Foreign-born:
23.4% (498)
White (Caucasian) - Speak another language Native:
7.4% (752)Foreign-born:
75.3% (1,604)
Black or African American - Speak only English Native:
99.1% (148)Foreign-born:
84.2% (103)
Asian - Speak only English Native:
46.9% (567)Foreign-born:
7.6% (192)
Asian - Speak another language Native:
52.9% (639)Foreign-born:
93.5% (2,348)
Other race - Speak only English Native:
68.6% (699)Foreign-born:
4.3% (29)
Other race - Speak another language Native:
35.8% (365)Foreign-born:
96.6% (663)
Two or more races - Speak only English Native:
55.8% (589)Foreign-born:
21.2% (121)
Two or more races - Speak another language Native:
46.6% (492)Foreign-born:
78.4% (448)
White alone - Speak only English Native:
92.5% (9,163)Foreign-born:
19.2% (513)
White alone - Speak another language Native:
7.3% (721)Foreign-born:
81.1% (2,162)
Hispanic or Latino - Speak only English Native:
56.8% (955)Foreign-born:
1.9% (15)
Hispanic or Latino - Speak another language Native:
42.9% (722)Foreign-born:
98.1% (802)
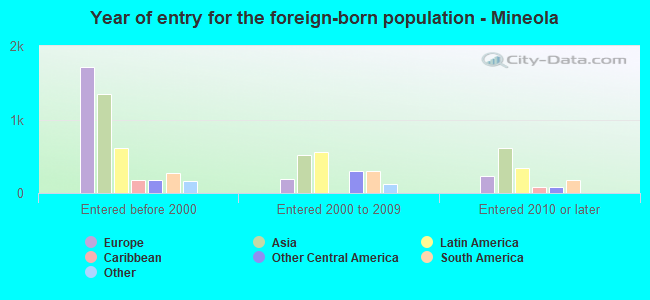
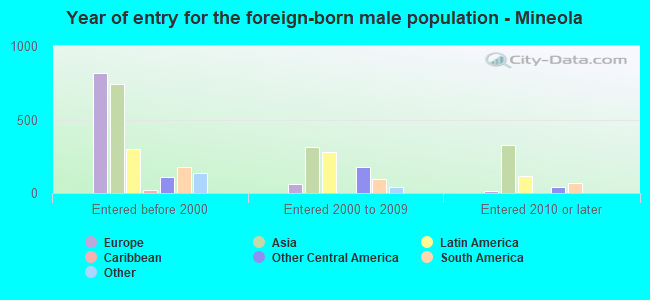
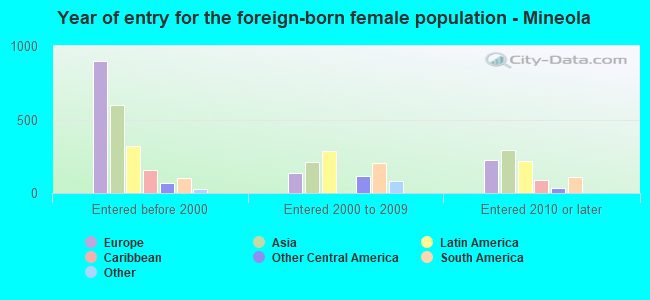
Foreign-born residents in Mineola 6,118 residents are foreign born (10.6% Asia , 10.4% Europe , 7.6% Latin America ).
This city:
29.3%New York:
22.6%
Marital status for residents in Mineola Marital status - White (Caucasian) population 15 years and over
Males 31.0% Never married58.9% Now married1.0% Separated2.4% Widowed6.6% DivorcedFemales 25.0% Never married55.9% Now married1.0% Separated8.7% Widowed9.4% DivorcedWomen who gave birth in the past 12 months Now married:
100.0% (135)Unmarried:
0.0% (0)
Women who did not give birth in the past 12 months Now married:
54.7% (1,418)Unmarried:
45.3% (1,175)
Marital status - Black or African American population 15 years and over
Males 31.7% Never married42.3% Now married0.0% Separated0.0% Widowed26.0% DivorcedFemales 57.4% Never married22.6% Now married0.0% Separated0.0% Widowed20.0% DivorcedWomen who gave birth in the past 12 months Now married:
100.0% (16)Unmarried:
0.0% (0)
Women who did not give birth in the past 12 months Now married:
15.1% (17)Unmarried:
84.9% (95)
Marital status - Asian population 15 years and over
Males 30.3% Never married67.9% Now married0.0% Separated0.0% Widowed1.8% DivorcedFemales 10.9% Never married72.5% Now married1.1% Separated6.3% Widowed9.2% DivorcedWomen who gave birth in the past 12 months Now married:
100.0% (101)Unmarried:
0.0% (0)
Women who did not give birth in the past 12 months Now married:
80.1% (564)Unmarried:
19.9% (140)
Marital status - Other race population 15 years and over
Males 35.1% Never married43.9% Now married5.4% Separated0.0% Widowed15.5% DivorcedFemales 25.5% Never married52.3% Now married9.7% Separated8.5% Widowed4.1% DivorcedWomen who did not give birth in the past 12 months Now married:
57.7% (269)Unmarried:
42.3% (198)
Marital status - Two or more races population 15 years and over
Males 55.2% Never married38.1% Now married0.0% Separated6.7% Widowed0.0% DivorcedFemales 46.3% Never married34.6% Now married0.0% Separated4.6% Widowed14.5% DivorcedWomen who gave birth in the past 12 months Now married:
44.2% (29)Unmarried:
55.8% (36)
Women who did not give birth in the past 12 months Now married:
34.3% (175)Unmarried:
65.7% (336)
Marital status - White alone, not Hispanic / Latino population 15 years and over
Males 32.1% Never married57.3% Now married1.1% Separated2.5% Widowed7.0% DivorcedFemales 25.0% Never married56.0% Now married0.4% Separated9.0% Widowed9.6% DivorcedWomen who gave birth in the past 12 months Now married:
100.0% (144)Unmarried:
0.0% (0)
Women who did not give birth in the past 12 months Now married:
54.7% (1,463)Unmarried:
45.3% (1,210)
Marital status - Hispanic or Latino population 15 years and over
Males 36.3% Never married56.8% Now married3.4% Separated0.0% Widowed3.6% DivorcedFemales 33.9% Never married41.3% Now married9.0% Separated6.2% Widowed9.7% DivorcedWomen who gave birth in the past 12 months Now married:
0.0% (0)Unmarried:
100.0% (24)
Women who did not give birth in the past 12 months Now married:
46.9% (304)Unmarried:
53.1% (343)
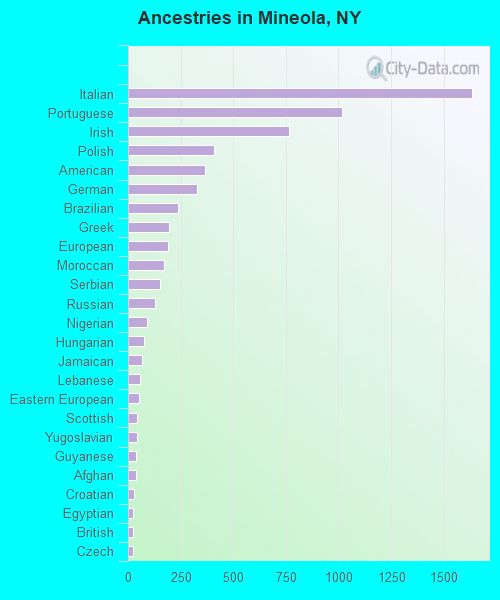
Ancestries in Mineola
1,634 14.8% Italian1,017 9.2% Portuguese767 6.9% Irish409 3.7% Polish364 3.3% American327 3.0% German237 2.1% Brazilian197 1.8% Greek190 1.7% European173 1.6% Moroccan152 1.4% Serbian127 1.1% Russian88 0.8% Nigerian78 0.7% Hungarian68 0.6% Jamaican58 0.5% Lebanese54 0.5% Eastern European45 0.4% Scottish44 0.4% Yugoslavian38 0.3% Guyanese37 0.3% Afghan29 0.3% Croatian25 0.2% Egyptian24 0.2% British22 0.2% Czech21 0.2% Czechoslovakian17 0.2% Scotch-Irish15 0.1% French12 0.1% Dutch10 0.09% Swedish9 0.08% Iranian8 0.07% Cypriot7 0.06% Armenian6 0.05% Slovak4 0.04% Maltese
Geographical mobility in Mineola Same house 1 year ago 11,558 91.1% White (Caucasian)252 84.3% Black or African American18 100.0% American Indian / Alaska Native3,548 89.3% Asian1,549 88.0% Other race1,578 85.4% Two or more races11,526 90.8% White alone, not Hispanic / Latino2,245 85.9% Hispanic or LatinoMoved within same county 497 3.9% White / Caucasian57 19.2% Black or African American168 4.2% Asian104 5.9% Other race249 13.5% Two or more races529 4.2% White alone, not Hispanic / Latino234 9.0% Hispanic or LatinoMoved within same state 215 1.7% White / Caucasian143 3.6% Asian57 3.2% Other race42 2.2% Two or more races207 1.6% White alone, not Hispanic / Latino111 4.3% Hispanic or LatinoMoved from different state 472 3.7% White / Caucasian12 0.6% Two or more races479 3.8% White alone, not Hispanic / LatinoMoved from abroad 23 0.2% White93 2.3% Asian53 3.0% Other race24 0.2% White alone, not Hispanic / Latino42 1.6% Hispanic or Latino
Children Nativity (place of birth) in Mineola
Children under 6 years - Living with two parents Both parents native 246 100.0% NativeBoth parents foreign-born 449 100.0% NativeOne native, one foreign-born parent 240 100.0% NativeChildren under 6 years - Living with one parent Native parent 225 100.0% NativeChildren 6 to 17 years - Living with two parents Both parents native 871 100.0% NativeBoth parents foreign-born 397 98.6% Native6 1.4% Foreign-bornOne native, one foreign-born parent 563 100.0% NativeChildren 6 to 17 years - Living with one parent Native parent 255 100.0% NativeForeign-born parent 96 55.4% Native77 44.6% Foreign-born
Grandparents responsible for own grandchildren in Mineola
Grandparents (30 to 59 years) White / Caucasian 8 100.0% Not responsible for grandchildrenAsian 18 100.0% Responsible for grandchildrenWhite alone, not Hispanic / Latino 5 100.0% Not responsible for grandchildrenGrandparents (60 years and over) White / Caucasian 26 12.5% Responsible for grandchildren186 87.5% Not responsible for grandchildrenAsian 67 100.0% Not responsible for grandchildrenWhite alone, not Hispanic / Latino 25 11.3% Responsible for grandchildren195 88.7% Not responsible for grandchildren