Races in Mitchell, Wisconsin (WI) Detailed Stats
Ancestries, Foreign-born residents, place of birth
1.9% of Mitchell, WI residents are foreign-born , which is 157.3% less than the foreign-born rate of 5.0% across the entire state of Wisconsin.
Race distribution in Mitchell

- 1,12098.9%White alone
- 80.7%Hispanic
- 20.2%Asian alone
- 10.09%Two or more races
- 10.09%American Indian alone

2000
2022
-
- 4,681,63087.3%White alone
- 300,2455.6%Black alone
- 192,9213.6%Hispanic
- 87,9951.6%Asian alone
- 51,9211.0%Two or more races
- 43,9800.8%American Indian alone
- 3,6370.07%Other race alone
- 1,3460.03%Native Hawaiian and Other
Pacific Islander alone

-
- 4,654,03179.0%White alone
- 447,0227.6%Hispanic
- 345,6785.9%Black alone
- 217,5323.7%Two or more races
- 172,2422.9%Asian alone
- 33,7620.6%American Indian alone
- 19,6800.3%Other race alone
- 2,5920.04%Native Hawaiian and Other
Pacific Islander alone

Income and house value in Mitchell
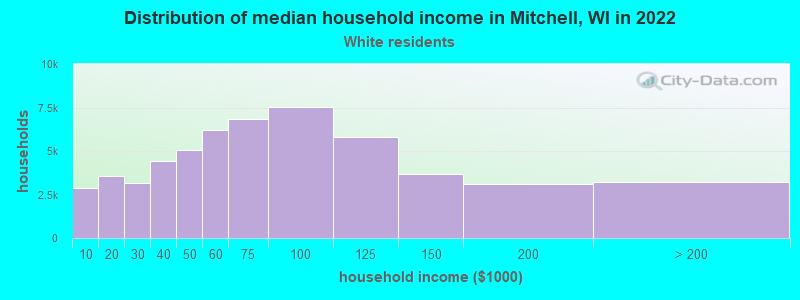
- Median household income in 2022
- $77,499White non-Hispanic householders
- Median 2022 house value
- $282,841White Non-Hispanic householders
Household income for White non-Hispanic householders
Foreign-born residents in Mitchell
22 residents are foreign born
| This city: | 1.9% |
| Wisconsin: | 3.6% |
Ancestries in Mitchell

- 59947.7%German
- 1169.2%Irish
- 997.9%Other
- 957.6%Polish
- 897.1%United States
- 806.4%English
- 393.1%Dutch
- 322.5%French
- 262.1%Norwegian
- 241.9%Italian
- 110.9%Lithuanian
- 90.7%Czech
- 90.7%Hungarian
- 90.7%Swedish
- 60.5%Russian
- 50.4%Slovak
- 30.2%Scotch-Irish
- 20.2%French Canadian
- 20.2%Greek

Zip codes: 53011.