Races in Morris Chapel, Tennessee (TN) Detailed Stats
Ancestries, Foreign-born residents, place of birth
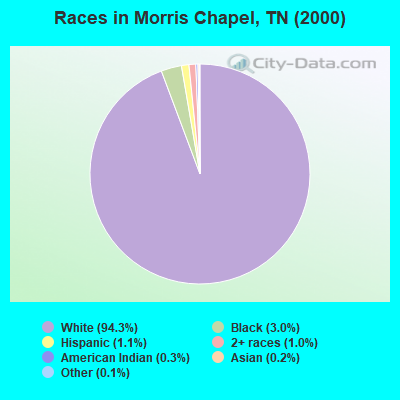
Race distribution in Morris Chapel

- 3,12094.3%White alone
- 1003.0%Black alone
- 351.1%Hispanic
- 341.0%Two or more races
- 100.3%American Indian alone
- 50.2%Asian alone
- 40.1%Other race alone
2000
2022
-
- 4,505,93079.2%White alone
- 928,20416.3%Black alone
- 123,8382.2%Hispanic
- 54,8241.0%Two or more races
- 56,0771.0%Asian alone
- 13,8200.2%American Indian alone
- 4,7800.08%Other race alone
- 1,8100.03%Native Hawaiian and Other
Pacific Islander alone

-
- 5,070,02671.9%White alone
- 1,089,73815.5%Black alone
- 442,6296.3%Hispanic
- 279,3814.0%Two or more races
- 131,8171.9%Asian alone
- 26,9720.4%Other race alone
- 6,3870.09%American Indian alone
- 4,3890.06%Native Hawaiian and Other
Pacific Islander alone

Income and house value in Morris Chapel
- Median household income in 2022
- $49,782White non-Hispanic householders
- $109,159Black householders
- $116,178American Indian and Alaska Native householders
- $115,554Asian householders
- $43,727Two or more races householders
- over $200,000Hispanic or Latino race householders
- Median 2022 house value
- $172,119White Non-Hispanic householders
- $262,883Black or African American householders
- $380,489Asian householders
- $179,867Two or more races householders
- $262,883Hispanic or Latino householders
Household income for White non-Hispanic householders

Household income for Black householders

Household income for American Indian and Alaska Native householders

Household income for Asian householders

Household income for Two or more races householders

Household income for Hispanic or Latino race householders

Zip code: 38310