Races in Mount Pleasant, Iowa (IA) Detailed Stats
Ancestries, Foreign-born residents, place of birth
Settings
X


Recent posts about races in Mount Pleasant, Iowa on our local forum with over 2,400,000 registered users:
 | Des Moines vs rural Iowa (19 replies) |
| Youth Service Worker SE Iowa (0 replies) |
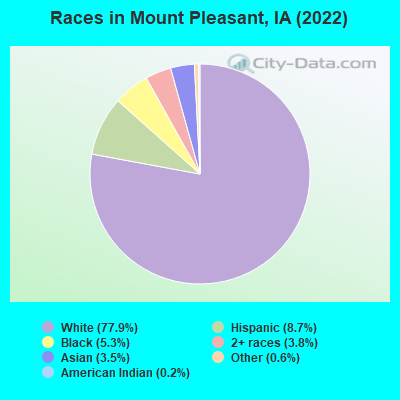
According to 2022 data, the most numerous races in Mount Pleasant, IA are White alone (7,207 residents), Hispanic (805 residents), and Black alone (486 residents). 90.2% of Mount Pleasant residents speak English at home. 5.7% of Mount Pleasant, IA residents are foreign-born (2.9% born in Asia, 1.9% born in Latin America), which is 12.4% greater than the foreign-born rate of 5.0% across the entire state of Iowa.
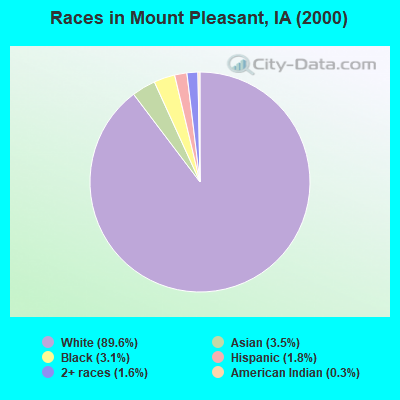
Race distribution in Mount Pleasant
2000
2022

- 7,83789.6%White alone
- 3093.5%Asian alone
- 2753.1%Black alone
- 1571.8%Hispanic
- 1361.6%Two or more races
- 260.3%American Indian alone
- 60.07%Other race alone
- 50.06%Native Hawaiian and Other
Pacific Islander alone
-
- 7,20777.9%White alone
- 8058.7%Hispanic
- 4865.3%Black alone
- 3533.8%Two or more races
- 3233.5%Asian alone
- 560.6%Other race alone
- 170.2%American Indian alone
- 70.08%Native Hawaiian and Other
Pacific Islander alone
2000
2022
-
- 2,710,34492.6%White alone
- 82,4732.8%Hispanic
- 60,7442.1%Black alone
- 36,3451.2%Asian alone
- 25,4720.9%Two or more races
- 7,9550.3%American Indian alone
- 2,1030.07%Other race alone
- 8880.03%Native Hawaiian and Other
Pacific Islander alone

-
- 2,650,11082.8%White alone
- 218,0246.8%Hispanic
- 119,0043.7%Black alone
- 115,2863.6%Two or more races
- 74,8922.3%Asian alone
- 9,2600.3%Other race alone
- 8,5950.3%Native Hawaiian and Other
Pacific Islander alone - 5,3460.2%American Indian alone

Income and house value in Mount Pleasant
- Median household income in 2022
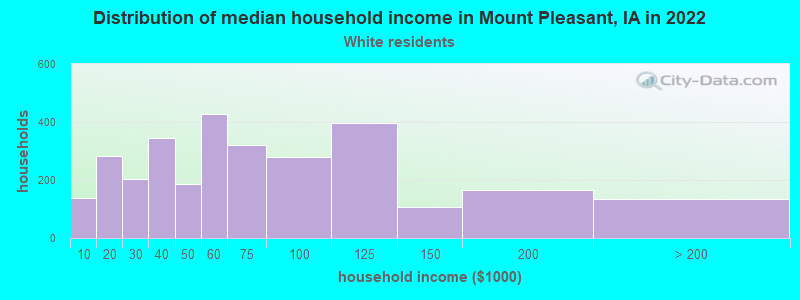
- $57,983White non-Hispanic householders
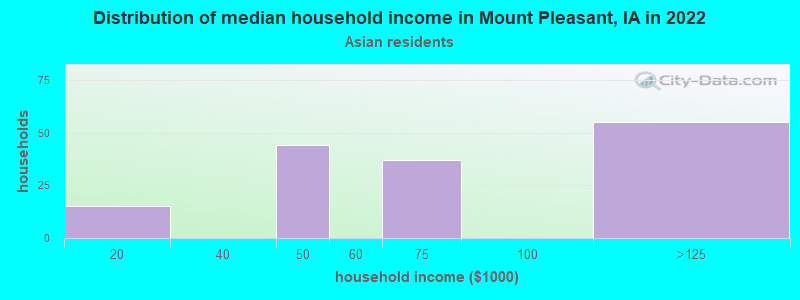
- $70,123Asian householders
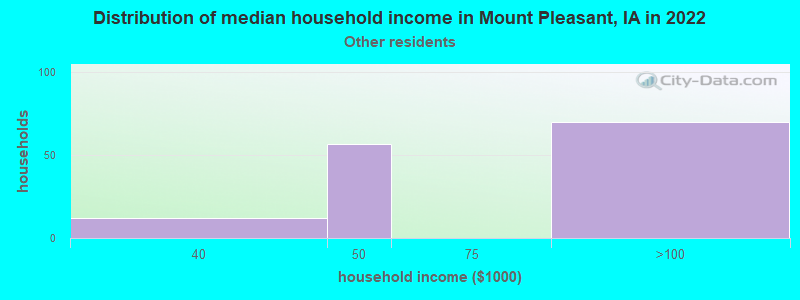
- $92,559Some other race householders
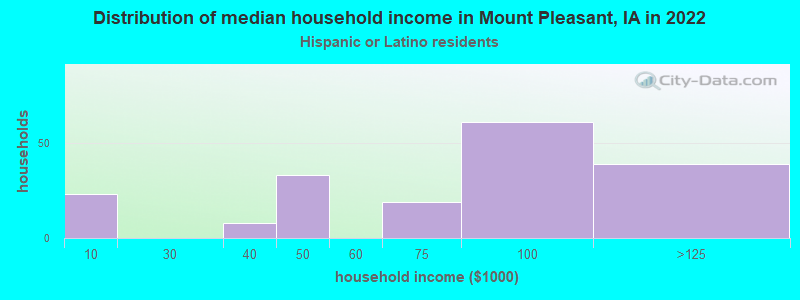
- $99,085Hispanic or Latino race householders
- Median 2022 house value
- $158,474White Non-Hispanic householders
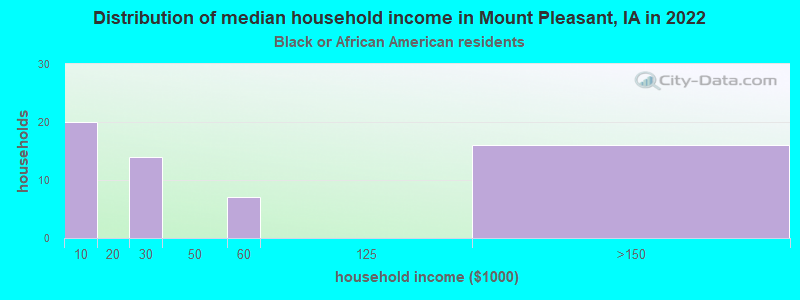
- $230,775Black or African American householders
- $180,946Asian householders
- $146,555Native Hawaiian and other Pacific Islander householders
- $537,368Some other race householders
- $216,706Two or more races householders
- $293,110Hispanic or Latino householders
Household income for White non-Hispanic householders
Household income for Black householders
Household income for Asian householders
Household income for Some other race householders
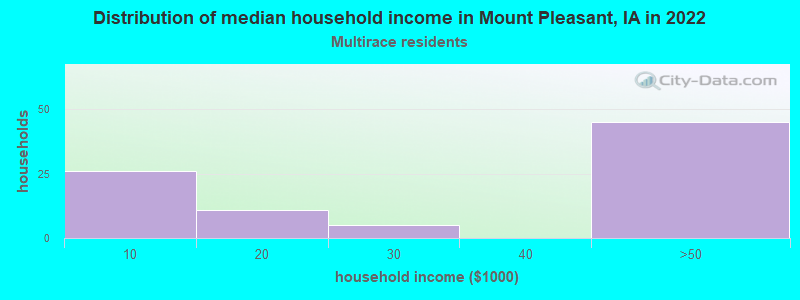
Household income for Two or more races householders
Household income for Hispanic or Latino race householders
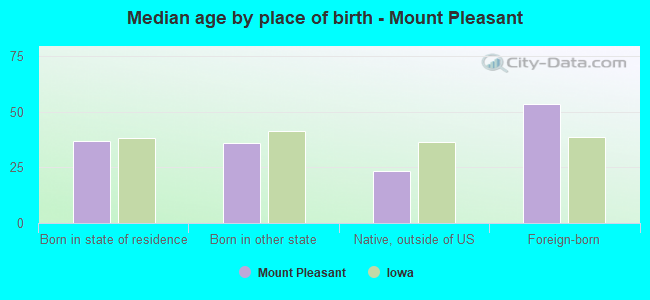
Median age by race in Mount Pleasant
- 39.2Median age for White residents
- 36.0Males
- 46.9Females
- 32.6Median age for Black or African American residents
- 32.0Males
- 21.8Females
- 21.7Median age for American Indian / Alaska Native residents
- 46.6Males
- -670,912,950.5Females
- 54.6Median age for Asian residents
- 61.4Males
- 35.5Females
- -580,729,166.1Median age for Native Hawaiian / Pacific Islander residents
- -776,978,416.5Males
- -504,347,825.6Females
- 21.9Median age for Other race residents
- 21.9Males
- 23.3Females
- 24.5Median age for Two or more races residents
- 24.4Males
- 25.0Females
- 40.1Median age for White alone residents
- 36.6Males
- 47.4Females
- 23.5Median age for Hispanic or Latino residents
- 23.0Males
- 22.8Females
Owner/renter occupied households by race in Mount Pleasant
- House owners and renters - White residents
- 2,04969.3%Owner occupied
- 90830.7%Renter occupied
- House owners and renters - Black or African American residents
- 2751.3%Owner occupied
- 2548.7%Renter occupied
- House owners and renters - Asian residents
- 15391.1%Owner occupied
- 158.9%Renter occupied
- House owners and renters - Other race residents
- 121100.0%Owner occupied
- House owners and renters - Two or more races residents
- 87.4%Owner occupied
- 10392.6%Renter occupied
- House owners and renters - White alone residents
- 2,06170.4%Owner occupied
- 86729.6%Renter occupied
- House owners and renters - Hispanic or Latino residents
- 9453.8%Owner occupied
- 8146.2%Renter occupied
Language usage in Mount Pleasant
- English speakers - Total
- 90.2% of residents of Mount Pleasant speak English at home.
- 5.1% of residents speak Spanish at home
- 21547.5%Speak English very well
- 23852.5%Speak English less than very well
- 4.7% of residents speak other language at home
- 16640.0%Speak English very well
- 24960.0%Speak English less than very well
- English speakers - Born in the United States
- 91.1% of residents of Mount Pleasant speak English at home.
- 7.2% of residents speak Spanish at home
- 16492.7%Speak English very well
- 137.3%Speak English less than very well
- 1.5% of residents speak other language at home
- 822.2%Speak English very well
- 2877.8%Speak English less than very well
All residents speak only English at home
- English speakers - Foreign-born
- 5.8% of residents of Mount Pleasant speak English at home.
- 34.6% of residents speak Spanish at home
- 105.2%Speak English very well
- 18194.8%Speak English less than very well
- 58.0% of residents speak other language at home
- 13642.5%Speak English very well
- 18457.5%Speak English less than very well
White (Caucasian) - Speak only English
| Native: | 98.1% (6,906) |
| Foreign-born: | 51.6% (13) |
White (Caucasian) - Speak another language
| Native: | 1.9% (133) |
| Foreign-born: | 55.2% (14) |
Black or African American - Speak only English
| Native: | 100.0% (465) |
| Foreign-born: | 3.9% (1) |
Asian - Speak only English
| Native: | 100.0% (73) |
| Foreign-born: | 6.6% (17) |
Other race - Speak another language
| Native: | 57.1% (98) |
| Foreign-born: | 100.0% (229) |
Two or more races - Speak another language
| Native: | 18.7% (106) |
| Foreign-born: | 97.8% (70) |
White alone - Speak only English
| Native: | 99.2% (6,834) |
| Foreign-born: | 40.2% (15) |
White alone - Speak another language
| Native: | 0.8% (54) |
| Foreign-born: | 59.7% (22) |
Hispanic or Latino - Speak another language
| Native: | 45.4% (257) |
| Foreign-born: | 100.0% (193) |
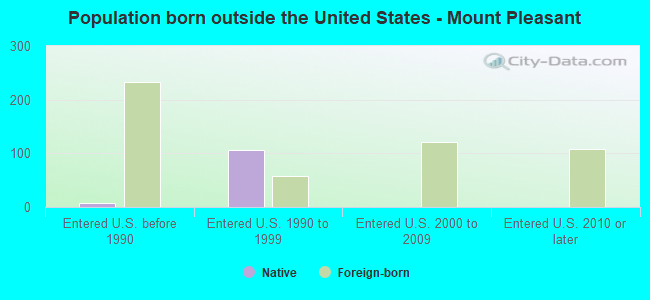
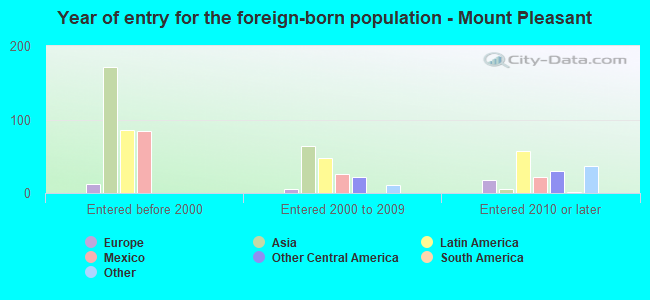
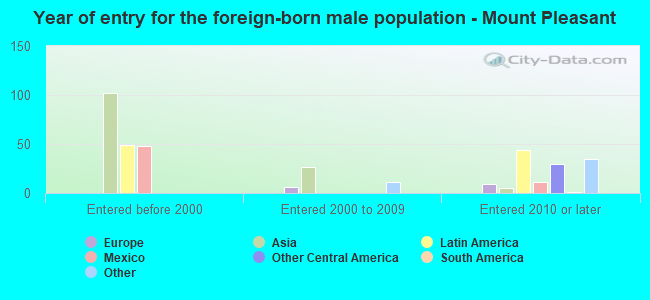
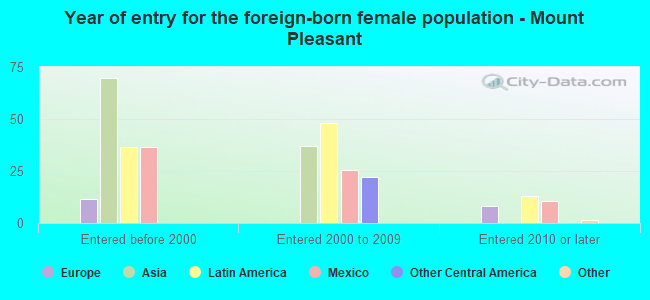
Foreign-born residents in Mount Pleasant
528 residents are foreign born (2.9% Asia, 1.9% Latin America).
| This city: | 5.7% |
| Iowa: | 5.6% |

Marital status for residents in Mount Pleasant
Marital status - White (Caucasian) population 15 years and over
- Males
- 42.0%Never married
- 44.4%Now married
- 0.6%Separated
- 3.7%Widowed
- 9.2%Divorced
- Females
- 28.3%Never married
- 47.8%Now married
- 0.6%Separated
- 10.6%Widowed
- 12.7%Divorced
Women who gave birth in the past 12 months
| Now married: | 61.3% (66) |
| Unmarried: | 38.7% (42) |
Women who did not give birth in the past 12 months
| Now married: | 37.1% (481) |
| Unmarried: | 62.9% (814) |
Marital status - Black or African American population 15 years and over
- Males
- 66.0%Never married
- 15.6%Now married
- 1.9%Separated
- 0.0%Widowed
- 16.5%Divorced
- Females
- 56.2%Never married
- 43.8%Now married
- 0.0%Separated
- 0.0%Widowed
- 0.0%Divorced
Women who did not give birth in the past 12 months
| Now married: | 0.0% (0) |
| Unmarried: | 100.0% (18) |
Marital status - American Indian / Alaska Native population 15 years and over
- Males
- 38.1%Never married
- 19.0%Now married
- 0.0%Separated
- 0.0%Widowed
- 42.9%Divorced
- Females
- 100.0%Never married
- 0.0%Now married
- 0.0%Separated
- 0.0%Widowed
- 0.0%Divorced
Women who did not give birth in the past 12 months
| Now married: | 0.0% (0) |
| Unmarried: | 100.0% (31) |
Marital status - Asian population 15 years and over
- Males
- 11.8%Never married
- 56.2%Now married
- 0.0%Separated
- 10.1%Widowed
- 21.9%Divorced
- Females
- 46.7%Never married
- 53.3%Now married
- 0.0%Separated
- 0.0%Widowed
- 0.0%Divorced
Women who did not give birth in the past 12 months
| Now married: | 46.3% (64) |
| Unmarried: | 53.7% (75) |
Marital status - Other race population 15 years and over
- Males
- 57.4%Never married
- 37.2%Now married
- 0.0%Separated
- 5.4%Widowed
- 0.0%Divorced
- Females
- 38.5%Never married
- 38.5%Now married
- 0.0%Separated
- 0.0%Widowed
- 23.1%Divorced
Women who did not give birth in the past 12 months
| Now married: | 0.0% (0) |
| Unmarried: | 100.0% (58) |
Marital status - Two or more races population 15 years and over
- Males
- 100.0%Never married
- 0.0%Now married
- 0.0%Separated
- 0.0%Widowed
- 0.0%Divorced
- Females
- 52.1%Never married
- 10.3%Now married
- 13.7%Separated
- 8.2%Widowed
- 15.8%Divorced
Women who did not give birth in the past 12 months
| Now married: | 31.5% (52) |
| Unmarried: | 68.5% (113) |
Marital status - White alone, not Hispanic / Latino population 15 years and over
- Males
- 39.0%Never married
- 46.7%Now married
- 0.6%Separated
- 3.9%Widowed
- 9.7%Divorced
- Females
- 27.7%Never married
- 48.2%Now married
- 0.6%Separated
- 10.7%Widowed
- 12.8%Divorced
Women who gave birth in the past 12 months
| Now married: | 61.3% (67) |
| Unmarried: | 38.7% (43) |
Women who did not give birth in the past 12 months
| Now married: | 37.9% (489) |
| Unmarried: | 62.1% (802) |
Marital status - Hispanic or Latino population 15 years and over
- Males
- 83.9%Never married
- 14.2%Now married
- 0.0%Separated
- 1.9%Widowed
- 0.0%Divorced
- Females
- 55.6%Never married
- 21.7%Now married
- 9.7%Separated
- 0.0%Widowed
- 13.0%Divorced
Women who did not give birth in the past 12 months
| Now married: | 14.8% (22) |
| Unmarried: | 85.2% (126) |
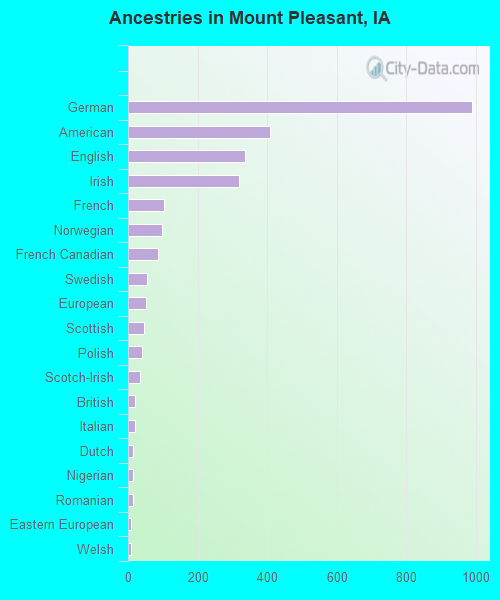
Ancestries in Mount Pleasant

- 98924.4%German
- 40810.1%American
- 3368.3%English
- 3187.9%Irish
- 1042.6%French
- 992.4%Norwegian
- 872.1%French Canadian
- 561.4%Swedish
- 521.3%European
- 461.1%Scottish
- 411.0%Polish
- 350.9%Scotch-Irish
- 210.5%British
- 200.5%Italian
- 150.4%Dutch
- 140.3%Nigerian
- 130.3%Romanian
- 100.2%Eastern European
- 100.2%Welsh
- 60.1%Australian
- 60.1%Somali
- 50.1%Ukrainian
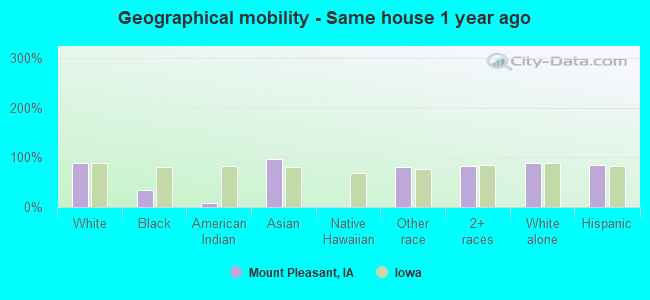
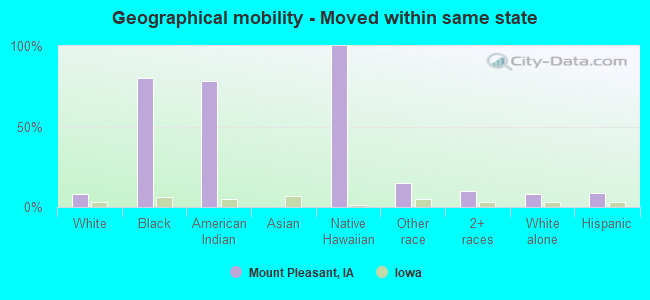
Geographical mobility in Mount Pleasant

- Same house 1 year ago
- 6,40088.2%White (Caucasian)
- 16433.7%Black or African American
- 58.1%American Indian / Alaska Native
- 31396.3%Asian
- 37280.8%Other race
- 57982.9%Two or more races
- 6,29487.9%White alone, not Hispanic / Latino
- 68585.0%Hispanic or Latino
-
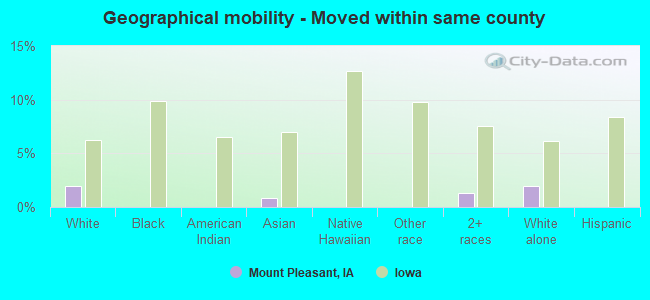
- Moved within same county
- 1391.9%White / Caucasian
- 30.9%Asian
- 91.3%Two or more races
- 1422.0%White alone, not Hispanic / Latino
-
- Moved within same state
- 5818.0%White / Caucasian
- 39280.5%Black or African American
- 4577.7%American Indian / Alaska Native
- 4100.0%Native Hawaiian / Pacific Islander
- 6914.9%Other race
- 7210.3%Two or more races
- 5828.1%White alone, not Hispanic / Latino
- 759.3%Hispanic or Latino
-
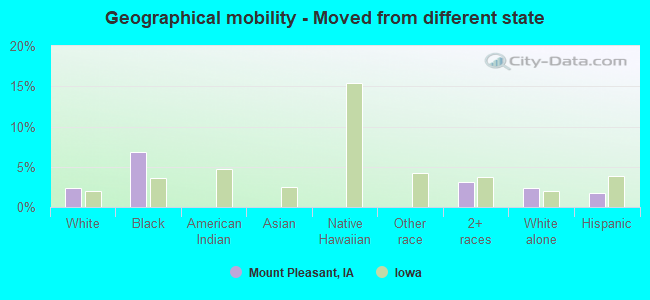
- Moved from different state
- 1742.4%White / Caucasian
- 336.8%Black or African American
- 223.1%Two or more races
- 1722.4%White alone, not Hispanic / Latino
- 141.7%Hispanic or Latino
-
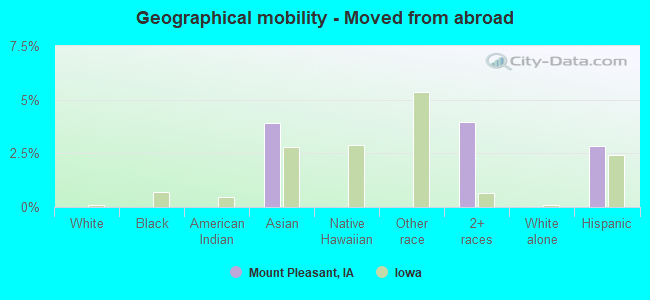
- Moved from abroad
- 133.9%Asian
- 284.0%Two or more races
- 232.8%Hispanic or Latino
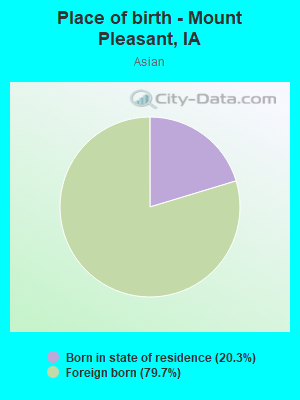
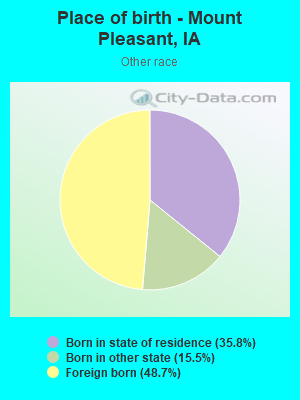
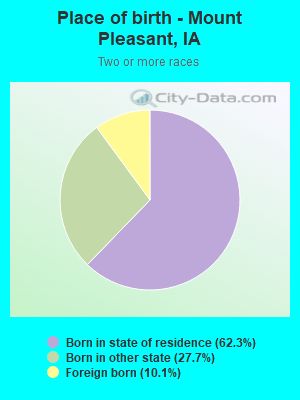
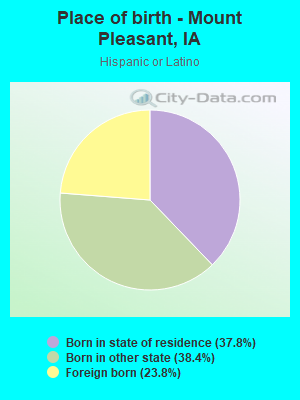
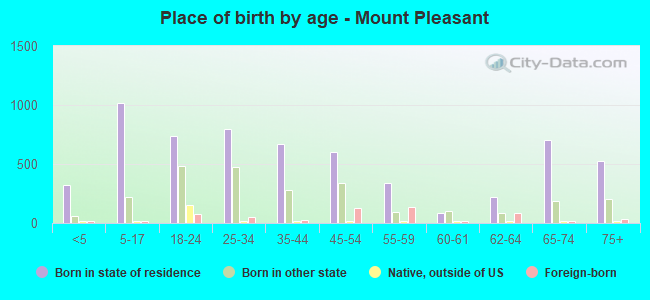
Children Nativity (place of birth) in Mount Pleasant
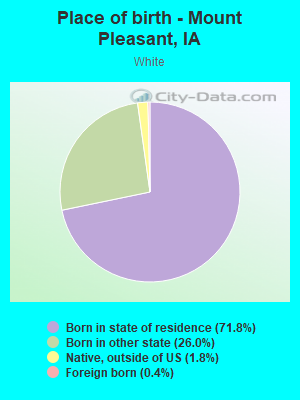
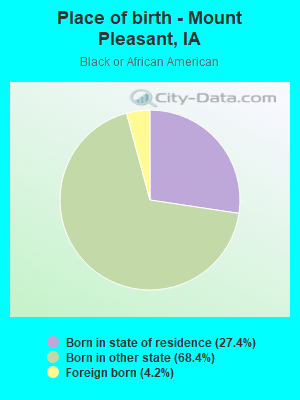
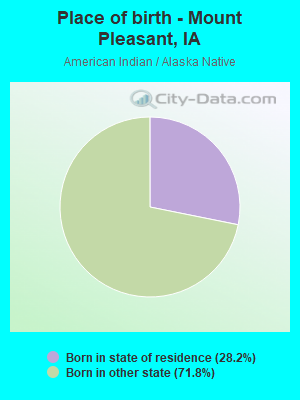
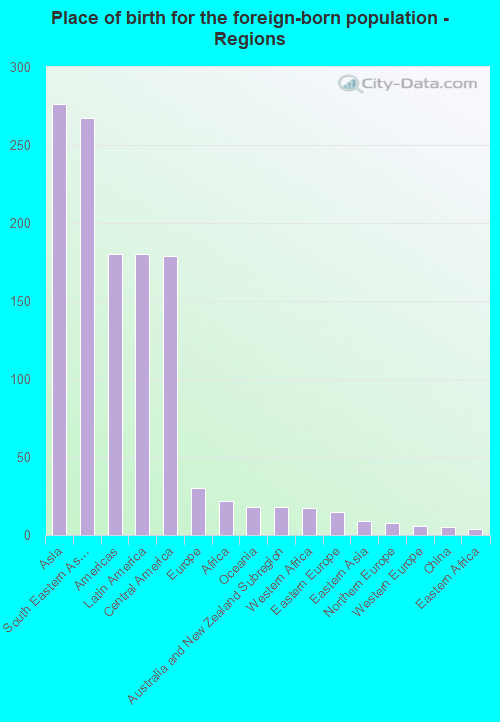
Place of birth for residents in Mount Pleasant
![Place of birth for the foreign-born population - Regions]()
- 276Asia
- 267South Eastern Asia
- 180Americas
- 180Latin America
- 179Central America
- 30Europe
- 22Africa
- 18Oceania
- 18Australia and New Zealand Subregion
- 17Western Africa
- 15Eastern Europe
- 9Eastern Asia
- 8Northern Europe
- 6Western Europe
- 5China
- 4Eastern Africa
- 1Southern Europe
- 1South America
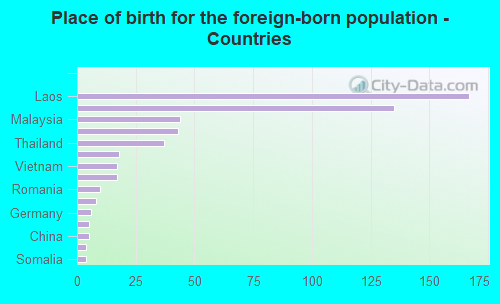
![Place of birth for the foreign-born population - Countries]()
- 167Laos
- 135Mexico
- 44Malaysia
- 43Guatemala
- 37Thailand
- 18Australia
- 17Vietnam
- 17Nigeria
- 10Romania
- 8United Kingdom
- 6Germany
- 5Ukraine
- 5China
- 4Korea
- 4Somalia
- 1Italy
- 1Brazil
Grandparents responsible for own grandchildren in Mount Pleasant
Zip codes: 52641.