Races in Municipality of Murrysville, Pennsylvania (PA) Detailed Stats
Ancestries, Foreign-born residents, place of birth

Recent posts about races in Municipality of Murrysville, Pennsylvania on our local forum with over 2,400,000 registered users:
 | The Pittsburgh School District Mega-Thread! (53 replies) |
| Are thre any Chinese people in Murrysville? (10 replies) |
4.3% of Municipality of Murrysville, PA residents are foreign-born (2.4% born in Asia, 1.5% born in Europe), which is 63.1% less than the foreign-born rate of 7.0% across the entire state of Pennsylvania.
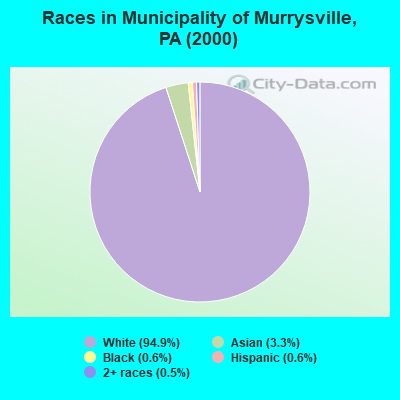
Race distribution in Municipality of Murrysville

- 17,91894.9%White alone
- 6193.3%Asian alone
- 1110.6%Black alone
- 1060.6%Hispanic
- 930.5%Two or more races
- 140.07%Other race alone
- 90.05%American Indian alone
- 20.01%Native Hawaiian and Other
Pacific Islander alone
2000
2022
-
- 10,322,45584.1%White alone
- 1,202,4379.8%Black alone
- 394,0883.2%Hispanic
- 218,2961.8%Asian alone
- 113,0970.9%Two or more races
- 13,0860.1%Other race alone
- 14,9040.1%American Indian alone
- 2,6910.02%Native Hawaiian and Other
Pacific Islander alone

-
- 9,487,22873.1%White alone
- 1,311,58110.1%Black alone
- 1,115,9978.6%Hispanic
- 493,9423.8%Two or more races
- 487,1243.8%Asian alone
- 63,5820.5%Other race alone
- 10,1300.08%American Indian alone
- 2,4240.02%Native Hawaiian and Other
Pacific Islander alone

Income and house value in Municipality of Murrysville
- Median household income in 2022
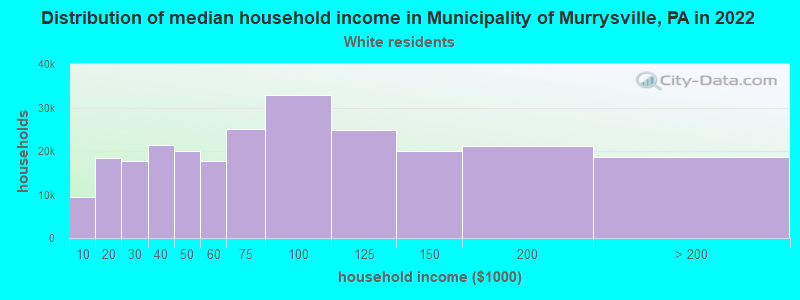
- $120,807White non-Hispanic householders
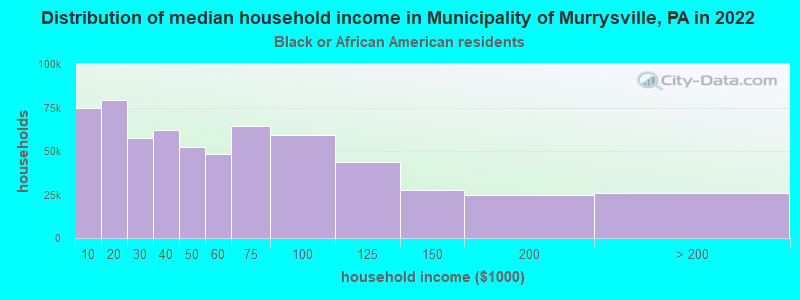
- $102,345Black householders
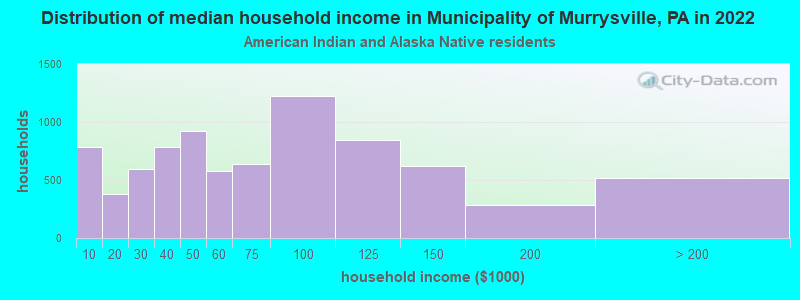
- $56,980American Indian and Alaska Native householders
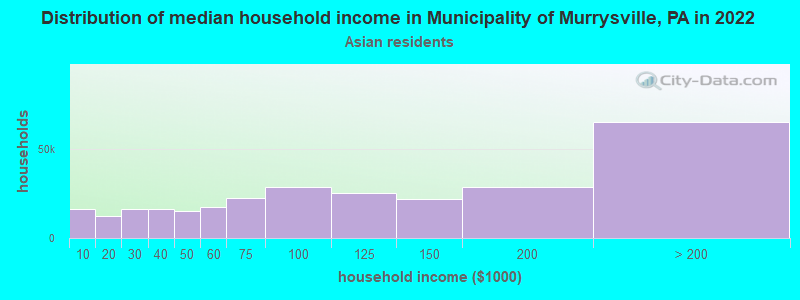
- $85,424Asian householders
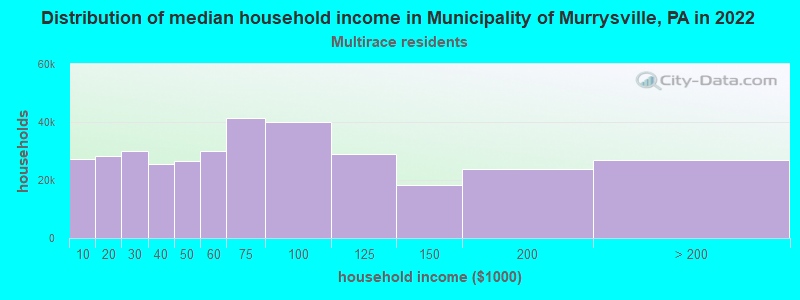
- over $200,000Two or more races householders
- Median 2022 house value
- $343,478White Non-Hispanic householders
- $305,142Black or African American householders
- $302,939American Indian or Alaska Native householders
- $457,163Asian householders
- $348,325Two or more races householders
Household income for White non-Hispanic householders
Household income for Black householders
Household income for American Indian and Alaska Native householders
Household income for Asian householders
Household income for Two or more races householders
Foreign-born residents in Municipality of Murrysville
810 residents are foreign born (2.4% Asia, 1.5% Europe).
| This city: | 4.3% |
| Pennsylvania: | 4.1% |
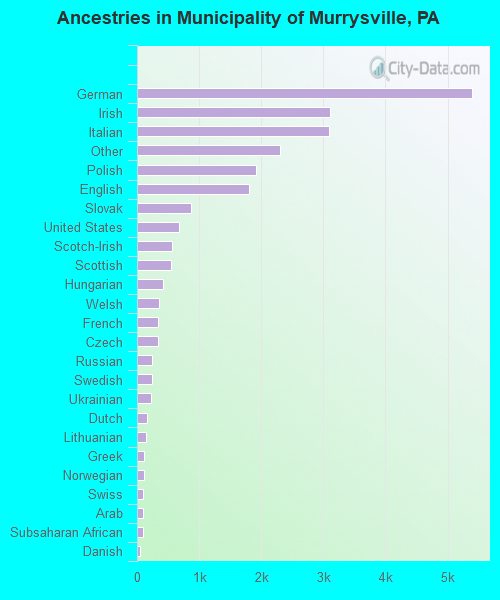
Ancestries in Municipality of Murrysville

- 5,39823.1%German
- 3,10913.3%Irish
- 3,08513.2%Italian
- 2,2979.8%Other
- 1,9128.2%Polish
- 1,8117.8%English
- 8763.7%Slovak
- 6692.9%United States
- 5582.4%Scotch-Irish
- 5412.3%Scottish
- 4231.8%Hungarian
- 3621.5%Welsh
- 3401.5%French
- 3311.4%Czech
- 2361.0%Russian
- 2341.0%Swedish
- 2221.0%Ukrainian
- 1660.7%Dutch
- 1410.6%Lithuanian
- 1200.5%Greek
- 1200.5%Norwegian
- 970.4%Swiss
- 950.4%Arab
- 890.4%Subsaharan African
- 500.2%Danish
- 470.2%West Indian
- 220.09%French Canadian
- 140.06%Portuguese
Zip codes: 15668.