Races in Napi HQ, New Mexico (NM) Detailed Stats
Ancestries, Foreign-born residents, place of birth

Recent posts about races in Napi HQ, New Mexico on our local forum with over 2,400,000 registered users:
 | Camper attacked (59 replies) |
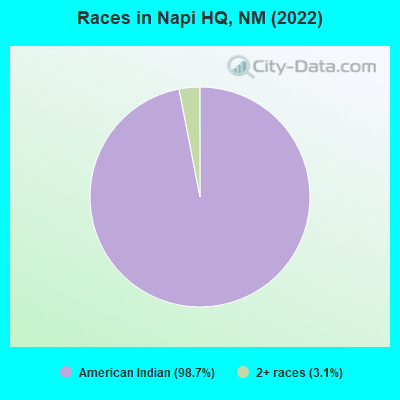
According to 2022 data, the most numerous races in Napi HQ, NM are Hispanic (0 residents), White alone (0 residents), and American Indian alone (612 residents). 66.7% of Napi HQ residents speak English at home.
Race distribution in Napi HQ

2000
2022

- 813,49544.7%White alone
- 765,38642.1%Hispanic
- 161,4608.9%American Indian alone
- 30,6541.7%Black alone
- 25,7931.4%Two or more races
- 18,2571.0%Asian alone
- 3,0090.2%Other race alone
- 9920.05%Native Hawaiian and Other
Pacific Islander alone

-
- 1,059,86750.2%Hispanic
- 735,47834.8%White alone
- 171,8088.1%American Indian alone
- 65,0843.1%Two or more races
- 36,8701.7%Black alone
- 35,8701.7%Asian alone
- 7,5820.4%Other race alone
- 7850.04%Native Hawaiian and Other
Pacific Islander alone

Income and house value in Napi HQ
- Median household income in 2022
- $28,034American Indian and Alaska Native householders
- Median 2022 house value
- $62,905American Indian or Alaska Native householders
Household income for American Indian and Alaska Native householders

Median age by race in Napi HQ
- -685,490,195.4Median age for White residents
- -702,439,023.7Males
- -682,063,124.8Females
- -656,596,172.6Median age for Black or African American residents
- -648,594,376.9Males
- -670,719,350.9Females
- 31.0Median age for American Indian / Alaska Native residents
- 30.0Males
- 32.7Females
- -675,675,675.0Median age for Asian residents
- -687,619,046.9Males
- -661,512,026.8Females
- -658,511,722.1Median age for Native Hawaiian / Pacific Islander residents
- -666,666,666.0Males
- -659,380,691.5Females
- -724,378,108.7Median age for Other race residents
- -606,763,284.4Males
- -879,256,965.1Females
- 22.6Median age for Two or more races residents
- -1,024,922,117.4Males
- -586,666,666.1Females
- -665,251,237.8Median age for White alone residents
- -668,100,357.8Males
- -670,850,766.4Females
- -678,921,567.9Median age for Hispanic or Latino residents
- -686,567,163.5Males
- -676,328,501.7Females
Owner/renter occupied households by race in Napi HQ
- House owners and renters - American Indian / Alaska Native residents
- 5923.9%Owner occupied
- 18776.1%Renter occupied
- House owners and renters - Two or more races residents
- 4100.0%Renter occupied
Language usage in Napi HQ
- English speakers - Total
- 66.7% of residents of Napi HQ speak English at home.
- 34.4% of residents speak other language at home
- 7737.4%Speak English very well
- 12962.6%Speak English less than very well
- English speakers - Born in the United States
- 80.0% of residents of Napi HQ speak English at home.
- 20.6% of residents speak other language at home
- 2578.1%Speak English very well
- 721.9%Speak English less than very well
Foreign-born residents in Napi HQ


Marital status for residents in Napi HQ
Marital status - American Indian / Alaska Native population 15 years and over
- Males
- 52.7%Never married
- 38.2%Now married
- 0.0%Separated
- 6.5%Widowed
- 2.7%Divorced
- Females
- 64.9%Never married
- 23.1%Now married
- 4.1%Separated
- 4.4%Widowed
- 3.5%Divorced
Women who gave birth in the past 12 months
| Now married: | 0.0% (0) |
| Unmarried: | 100.0% (20) |
Women who did not give birth in the past 12 months
| Now married: | 28.0% (48) |
| Unmarried: | 72.0% (123) |
Geographical mobility in Napi HQ

- Same house 1 year ago
- 58295.4%American Indian / Alaska Native
- 1999.8%Two or more races

-
- Moved within same county
- 274.4%American Indian / Alaska Native

Children Nativity (place of birth) in Napi HQ
Grandparents responsible for own grandchildren in Napi HQ
Zip codes: 87401.