Races in Naugatuck, Connecticut (CT) Detailed Stats
Data:
Races - White alone (%)
Races - White alone (% change since 2000)
Races - Black alone (%)
Races - Black alone (% change since 2000)
Races - American Indian alone (%)
Races - American Indian alone (% change since 2000)
Races - Asian alone (%)
Races - Asian alone (% change since 2000)
Races - Hispanic (%)
Races - Hispanic (% change since 2000)
Races - Native Hawaiian and Other Pacific Islander alone (%)
Races - Native Hawaiian and Other Pacific Islander alone (% change since 2000)
Races - Two or more races(%)
Races - Two or more races(% change since 2000)
Races - Other race alone (%)
Races - Other race alone (% change since 2000)
Racial diversity
Place of birth - Born in state of residence (%)
Place of birth - Born in state of residence (%) - White
Place of birth - Born in state of residence (%) - Black or African American
Place of birth - Born in state of residence (%) - Asian
Place of birth - Born in state of residence (%) - Hispanic or Latino
Place of birth - Born in state of residence (%) - American Indian and Alaska Native
Place of birth - Born in state of residence (%) - Multirace
Place of birth - Born in state of residence (%) - Other Race
Place of birth - Born in other state (%)
Place of birth - Born in other state (%) - White
Place of birth - Born in other state (%) - Black or African American
Place of birth - Born in other state (%) - Asian
Place of birth - Born in other state (%) - Hispanic or Latino
Place of birth - Born in other state (%) - American Indian and Alaska Native
Place of birth - Born in other state (%) - Multirace
Place of birth - Born in other state (%) - Other Race
Place of birth - Native, outside of US (%)
Place of birth - Native, outside of US (%) - White
Place of birth - Native, outside of US (%) - Black or African American
Place of birth - Native, outside of US (%) - Asian
Place of birth - Native, outside of US (%) - Hispanic or Latino
Place of birth - Native, outside of US (%) - American Indian and Alaska Native
Place of birth - Native, outside of US (%) - Multirace
Place of birth - Native, outside of US (%) - Other Race
Place of birth - Foreign born (%)
Place of birth - Foreign born (%) - White
Place of birth - Foreign born (%) - Black or African American
Place of birth - Foreign born (%) - Asian
Place of birth - Foreign born (%) - Hispanic or Latino
Place of birth - Foreign born (%) - American Indian and Alaska Native
Place of birth - Foreign born (%) - Multirace
Place of birth - Foreign born (%) - Other Race
Residents speaking English at home (%)
Residents speaking English at home - Born in the United States (%)
Residents speaking English at home - Native, born elsewhere (%)
Residents speaking English at home - Foreign born (%)
Residents speaking Spanish at home (%)
Residents speaking Spanish at home - Born in the United States (%)
Residents speaking Spanish at home - Native, born elsewhere (%)
Residents speaking Spanish at home - Foreign born (%)
Residents speaking other language at home (%)
Residents speaking other language at home - Born in the United States (%)
Residents speaking other language at home - Native, born elsewhere (%)
Residents speaking other language at home - Foreign born (%)
Marital status - Never married (%)
Marital status - Now married (%)
Marital status - Separated (%)
Marital status - Widowed (%)
Marital status - Divorced (%)
Ancestries Reported - Arab (%)
Ancestries Reported - Czech (%)
Ancestries Reported - Danish (%)
Ancestries Reported - Dutch (%)
Ancestries Reported - English (%)
Ancestries Reported - French (%)
Ancestries Reported - French Canadian (%)
Ancestries Reported - German (%)
Ancestries Reported - Greek (%)
Ancestries Reported - Hungarian (%)
Ancestries Reported - Irish (%)
Ancestries Reported - Italian (%)
Ancestries Reported - Lithuanian (%)
Ancestries Reported - Norwegian (%)
Ancestries Reported - Polish (%)
Ancestries Reported - Portuguese (%)
Ancestries Reported - Russian (%)
Ancestries Reported - Scotch-Irish (%)
Ancestries Reported - Scottish (%)
Ancestries Reported - Slovak (%)
Ancestries Reported - Subsaharan African (%)
Ancestries Reported - Swedish (%)
Ancestries Reported - Swiss (%)
Ancestries Reported - Ukrainian (%)
Ancestries Reported - United States (%)
Ancestries Reported - Welsh (%)
Ancestries Reported - West Indian (%)
Ancestries Reported - Other (%)
Geographical mobility - Same house 1 year ago (%)
Geographical mobility - Same house 1 year ago (%) - White
Geographical mobility - Same house 1 year ago (%) - Black or African American
Geographical mobility - Same house 1 year ago (%) - Asian
Geographical mobility - Same house 1 year ago (%) - Hispanic or Latino
Geographical mobility - Same house 1 year ago (%) - American Indian and Alaska Native
Geographical mobility - Same house 1 year ago (%) - Multirace
Geographical mobility - Same house 1 year ago (%) - Other Race
Geographical mobility - Moved within same county (%)
Geographical mobility - Moved within same county (%) - White
Geographical mobility - Moved within same county (%) - Black or African American
Geographical mobility - Moved within same county (%) - Asian
Geographical mobility - Moved within same county (%) - Hispanic or Latino
Geographical mobility - Moved within same county (%) - American Indian and Alaska Native
Geographical mobility - Moved within same county (%) - Multirace
Geographical mobility - Moved within same county (%) - Other Race
Geographical mobility - Moved from different county within same state (%)
Geographical mobility - Moved from different county within same state (%) - White
Geographical mobility - Moved from different county within same state (%) - Black or African American
Geographical mobility - Moved from different county within same state (%) - Asian
Geographical mobility - Moved from different county within same state (%) - Hispanic or Latino
Geographical mobility - Moved from different county within same state (%) - American Indian and Alaska Native
Geographical mobility - Moved from different county within same state (%) - Multirace
Geographical mobility - Moved from different county within same state (%) - Other Race
Geographical mobility - Moved from different state (%)
Geographical mobility - Moved from different state (%) - White
Geographical mobility - Moved from different state (%) - Black or African American
Geographical mobility - Moved from different state (%) - Asian
Geographical mobility - Moved from different state (%) - Hispanic or Latino
Geographical mobility - Moved from different state (%) - American Indian and Alaska Native
Geographical mobility - Moved from different state (%) - Multirace
Geographical mobility - Moved from different state (%) - Other Race
Geographical mobility - Moved from abroad (%)
Geographical mobility - Moved from abroad (%) - White
Geographical mobility - Moved from abroad (%) - Black or African American
Geographical mobility - Moved from abroad (%) - Asian
Geographical mobility - Moved from abroad (%) - Hispanic or Latino
Geographical mobility - Moved from abroad (%) - American Indian and Alaska Native
Geographical mobility - Moved from abroad (%) - Multirace
Geographical mobility - Moved from abroad (%) - Other Race
Place of birth for the foreign-born population - Ireland (%)
Place of birth for the foreign-born population - Denmark (%)
Place of birth for the foreign-born population - Norway (%)
Place of birth for the foreign-born population - Sweden (%)
Place of birth for the foreign-born population - United Kingdom (%)
Place of birth for the foreign-born population - England (%)
Place of birth for the foreign-born population - Scotland (%)
Place of birth for the foreign-born population - Other Northern Europe (%)
Place of birth for the foreign-born population - Austria (%)
Place of birth for the foreign-born population - Belgium (%)
Place of birth for the foreign-born population - France (%)
Place of birth for the foreign-born population - Germany (%)
Place of birth for the foreign-born population - Netherlands (%)
Place of birth for the foreign-born population - Switzerland (%)
Place of birth for the foreign-born population - Other Western Europe (%)
Place of birth for the foreign-born population - Greece (%)
Place of birth for the foreign-born population - Italy (%)
Place of birth for the foreign-born population - Portugal (%)
Place of birth for the foreign-born population - Spain (%)
Place of birth for the foreign-born population - Other Southern Europe (%)
Place of birth for the foreign-born population - Albania (%)
Place of birth for the foreign-born population - Belarus (%)
Place of birth for the foreign-born population - Bosnia and Herzegovina (%)
Place of birth for the foreign-born population - Bulgaria (%)
Place of birth for the foreign-born population - Croatia (%)
Place of birth for the foreign-born population - Czechoslovakia (%)
Place of birth for the foreign-born population - Hungary (%)
Place of birth for the foreign-born population - Latvia (%)
Place of birth for the foreign-born population - Lithuania (%)
Place of birth for the foreign-born population - North Macedonia (Macedonia) (%)
Place of birth for the foreign-born population - Moldova (%)
Place of birth for the foreign-born population - Poland (%)
Place of birth for the foreign-born population - Romania (%)
Place of birth for the foreign-born population - Russia (%)
Place of birth for the foreign-born population - Serbia (%)
Place of birth for the foreign-born population - Ukraine (%)
Place of birth for the foreign-born population - Other Eastern Europe (%)
Place of birth for the foreign-born population - China (%)
Place of birth for the foreign-born population - Hong Kong (%)
Place of birth for the foreign-born population - Taiwan (%)
Place of birth for the foreign-born population - Japan (%)
Place of birth for the foreign-born population - Korea (%)
Place of birth for the foreign-born population - Other Eastern Asia (%)
Place of birth for the foreign-born population - Afghanistan (%)
Place of birth for the foreign-born population - Bangladesh (%)
Place of birth for the foreign-born population - India (%)
Place of birth for the foreign-born population - Iran (%)
Place of birth for the foreign-born population - Kazakhstan (%)
Place of birth for the foreign-born population - Nepal (%)
Place of birth for the foreign-born population - Pakistan (%)
Place of birth for the foreign-born population - Sri Lanka (%)
Place of birth for the foreign-born population - Uzbekistan (%)
Place of birth for the foreign-born population - Other South Central Asia (%)
Place of birth for the foreign-born population - Burma (%)
Place of birth for the foreign-born population - Cambodia (%)
Place of birth for the foreign-born population - Indonesia (%)
Place of birth for the foreign-born population - Laos (%)
Place of birth for the foreign-born population - Malaysia (%)
Place of birth for the foreign-born population - Philippines (%)
Place of birth for the foreign-born population - Singapore (%)
Place of birth for the foreign-born population - Thailand (%)
Place of birth for the foreign-born population - Vietnam (%)
Place of birth for the foreign-born population - Other South Eastern Asia (%)
Place of birth for the foreign-born population - Armenia (%)
Place of birth for the foreign-born population - Iraq (%)
Place of birth for the foreign-born population - Israel (%)
Place of birth for the foreign-born population - Jordan (%)
Place of birth for the foreign-born population - Kuwait (%)
Place of birth for the foreign-born population - Lebanon (%)
Place of birth for the foreign-born population - Saudi Arabia (%)
Place of birth for the foreign-born population - Syria (%)
Place of birth for the foreign-born population - Turkey (%)
Place of birth for the foreign-born population - Yemen (%)
Place of birth for the foreign-born population - Other Western Asia (%)
Place of birth for the foreign-born population - Eritrea (%)
Place of birth for the foreign-born population - Ethiopia (%)
Place of birth for the foreign-born population - Kenya (%)
Place of birth for the foreign-born population - Somalia (%)
Place of birth for the foreign-born population - Uganda (%)
Place of birth for the foreign-born population - Zimbabwe (%)
Place of birth for the foreign-born population - Other Eastern Africa (%)
Place of birth for the foreign-born population - Cameroon (%)
Place of birth for the foreign-born population - Congo (%)
Place of birth for the foreign-born population - Democratic Republic of Congo (Zaire) (%)
Place of birth for the foreign-born population - Other Middle Africa (%)
Place of birth for the foreign-born population - Egypt (%)
Place of birth for the foreign-born population - Morocco (%)
Place of birth for the foreign-born population - Sudan (%)
Place of birth for the foreign-born population - Other Northern Africa (%)
Place of birth for the foreign-born population - South Africa (%)
Place of birth for the foreign-born population - Other Southern Africa (%)
Place of birth for the foreign-born population - Cabo Verde (%)
Place of birth for the foreign-born population - Ghana (%)
Place of birth for the foreign-born population - Liberia (%)
Place of birth for the foreign-born population - Nigeria (%)
Place of birth for the foreign-born population - Senegal (%)
Place of birth for the foreign-born population - Sierra Leone (%)
Place of birth for the foreign-born population - Other Western Africa (%)
Place of birth for the foreign-born population - Australia (%)
Place of birth for the foreign-born population - New Zealand (%)
Place of birth for the foreign-born population - Fiji (%)
Place of birth for the foreign-born population - Micronesia (%)
Place of birth for the foreign-born population - Bahamas (%)
Place of birth for the foreign-born population - Barbados (%)
Place of birth for the foreign-born population - Cuba (%)
Place of birth for the foreign-born population - Dominica (%)
Place of birth for the foreign-born population - Dominican Republic (%)
Place of birth for the foreign-born population - Grenada (%)
Place of birth for the foreign-born population - Haiti (%)
Place of birth for the foreign-born population - Jamaica (%)
Place of birth for the foreign-born population - St. Vincent and the Grenadines (%)
Place of birth for the foreign-born population - Trinidad and Tobago (%)
Place of birth for the foreign-born population - West Indies (%)
Place of birth for the foreign-born population - Other Caribbean (%)
Place of birth for the foreign-born population - Belize (%)
Place of birth for the foreign-born population - Costa Rica (%)
Place of birth for the foreign-born population - El Salvador (%)
Place of birth for the foreign-born population - Guatemala (%)
Place of birth for the foreign-born population - Honduras (%)
Place of birth for the foreign-born population - Mexico (%)
Place of birth for the foreign-born population - Nicaragua (%)
Place of birth for the foreign-born population - Panama (%)
Place of birth for the foreign-born population - Other Central America (%)
Place of birth for the foreign-born population - Argentina (%)
Place of birth for the foreign-born population - Bolivia (%)
Place of birth for the foreign-born population - Brazil (%)
Place of birth for the foreign-born population - Chile (%)
Place of birth for the foreign-born population - Colombia (%)
Place of birth for the foreign-born population - Ecuador (%)
Place of birth for the foreign-born population - Guyana (%)
Place of birth for the foreign-born population - Peru (%)
Place of birth for the foreign-born population - Uruguay (%)
Place of birth for the foreign-born population - Venezuela (%)
Place of birth for the foreign-born population - Other South America (%)
Place of birth for the foreign-born population - Canada (%)
Place of birth for the foreign-born population - Other Northern America (%)
Place of birth for the foreign-born population - Other (%)
Latest news about races in Naugatuck, CT collected exclusively by city-data.com from local newspapers, TV, and radio stations
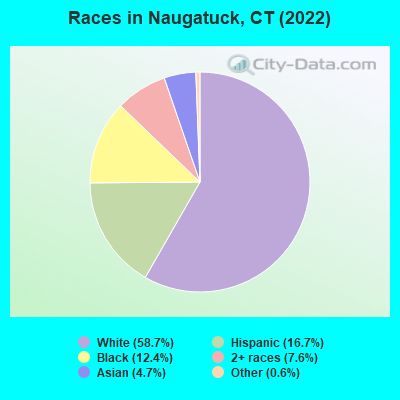
According to 2022 data, the most numerous races in Naugatuck, CT are White alone (18,650 residents), Hispanic (5,304 residents), and Black alone (3,946 residents). 72.8% of Naugatuck residents speak English at home. 19.7% of Naugatuck, CT residents are foreign-born (8.3% born in Latin America, 4.3% born in Europe, 3.1% born in Africa, 2.9% born in Asia), which is 23.7% greater than the foreign-born rate of 15.0% across the entire state of Connecticut.
Race distribution in Naugatuck
2000 2022
2,638,845 77.5% White alone 320,323 9.4% Hispanic 295,571 8.7% Black alone 81,564 2.4% Asian alone 52,896 1.6% Two or more races 8,141 0.2% Other race alone 7,267 0.2% American Indian alone 958 0.03% Native Hawaiian and Other
2,246,913 62.0% White alone 658,978 18.2% Hispanic 353,973 9.8% Black alone 172,929 4.8% Asian alone 159,631 4.4% Two or more races 29,761 0.8% Other race alone 3,428 0.09% American Indian alone 592 0.02% Native Hawaiian and Other
Income and house value in Naugatuck Median household income in 2022 $87,196 White non-Hispanic householders$102,956 Black householders$91,746 Asian householders$59,952 Some other race householders$85,092 Two or more races householders$86,327 Hispanic or Latino race householdersMedian 2022 house value $252,273 White Non-Hispanic householders$217,072 Black or African American householders$179,789 American Indian or Alaska Native householders $202,121 Asian householders$344,250 Some other race householders$255,869 Two or more races householders$256,058 Hispanic or Latino householders
Median age by race in Naugatuck
44.7 Median age for White residents41.4 47.8 31.3 Median age for Black or African American residents29.7 31.2 -742,173,111.6 Median age for American Indian / Alaska Native residents-701,030,927.1 -704,477,611.2 43.8 Median age for Asian residents44.3 35.8 -641,269,840.6 Median age for Native Hawaiian / Pacific Islander residents-414,239,481.8 -691,588,784.4 39.0 Median age for Other race residents36.5 43.5 33.1 Median age for Two or more races residents30.7 33.9 46.6 Median age for White alone residents44.3 49.4 35.2 Median age for Hispanic or Latino residents31.2 37.9
Owner/renter occupied households by race in Naugatuck
House owners and renters - White residents 6,121 71.3% Owner occupied2,468 28.7% Renter occupiedHouse owners and renters - Black or African American residents 673 53.1% Owner occupied593 46.9% Renter occupiedHouse owners and renters - Asian residents 415 68.4% Owner occupied192 31.6% Renter occupiedHouse owners and renters - Other race residents 414 57.8% Owner occupied302 42.2% Renter occupiedHouse owners and renters - Two or more races residents 728 51.1% Owner occupied697 48.9% Renter occupiedHouse owners and renters - White alone residents 5,677 69.9% Owner occupied2,440 30.1% Renter occupiedHouse owners and renters - Hispanic or Latino residents 1,342 70.3% Owner occupied568 29.7% Renter occupied
Language usage in Naugatuck
English speakers - Total 72.8% of residents of Naugatuck speak English at home.
10.4% of residents speak Spanish at home 1,933 61.8% Speak English very well1,194 38.2% Speak English less than very well16.7% of residents speak other language at home 2,867 56.8% Speak English very well2,181 43.2% Speak English less than very well
English speakers - Born in the United States 81.7% of residents of Naugatuck speak English at home.
11.9% of residents speak Spanish at home 574 89.3% Speak English very well69 10.7% Speak English less than very well6.8% of residents speak other language at home 303 82.3% Speak English very well65 17.7% Speak English less than very well
English speakers - Native, born elsewhere 21.2% of residents of Naugatuck speak English at home.
67.6% of residents speak Spanish at home 418 82.6% Speak English very well88 17.4% Speak English less than very well13.2% of residents speak other language at home 99 100.0% Speak English very well
English speakers - Foreign-born 19.2% of residents of Naugatuck speak English at home.
22.8% of residents speak Spanish at home 488 34.3% Speak English very well933 65.7% Speak English less than very well56.9% of residents speak other language at home 1,532 43.1% Speak English very well2,021 56.9% Speak English less than very well
White (Caucasian) - Speak only English Native:
91.7% (15,941)Foreign-born:
19.3% (336)
White (Caucasian) - Speak another language Native:
7.6% (1,328)Foreign-born:
78.7% (1,373)
Black or African American - Speak only English Native:
91.6% (1,981)Foreign-born:
33.1% (568)
Black or African American - Speak another language Native:
8.3% (180)Foreign-born:
58.8% (1,008)
Asian - Speak only English Native:
59.1% (304)Foreign-born:
4.1% (36)
Asian - Speak another language Native:
41.2% (212)Foreign-born:
96.6% (857)
Other race - Speak only English Native:
49.6% (652)Foreign-born:
5.8% (25)
Other race - Speak another language Native:
52.3% (687)Foreign-born:
94.4% (409)
Two or more races - Speak only English Native:
78.6% (2,076)Foreign-born:
15.6% (255)
Two or more races - Speak another language Native:
18.5% (488)Foreign-born:
80.5% (1,315)
White alone - Speak only English Native:
94.5% (15,316)Foreign-born:
20.6% (332)
White alone - Speak another language Native:
5.5% (886)Foreign-born:
79.0% (1,276)
Hispanic or Latino - Speak only English Native:
53.3% (2,006)Foreign-born:
11.0% (136)
Hispanic or Latino - Speak another language Native:
47.6% (1,790)Foreign-born:
88.0% (1,088)
Foreign-born residents in Naugatuck 6,247 residents are foreign born (8.3% Latin America , 4.3% Europe , 3.1% Africa , 2.9% Asia ).
This city:
19.7%Connecticut:
15.0%
Marital status for residents in Naugatuck Marital status - White (Caucasian) population 15 years and over
Males 39.4% Never married47.3% Now married0.4% Separated3.7% Widowed9.3% DivorcedFemales 27.1% Never married50.4% Now married1.0% Separated8.2% Widowed13.3% DivorcedWomen who gave birth in the past 12 months Now married:
79.5% (220)Unmarried:
20.5% (57)
Women who did not give birth in the past 12 months Now married:
42.6% (1,673)Unmarried:
57.4% (2,249)
Marital status - Black or African American population 15 years and over
Males 45.4% Never married40.4% Now married0.0% Separated0.0% Widowed14.2% DivorcedFemales 43.4% Never married37.4% Now married0.5% Separated10.6% Widowed8.1% DivorcedWomen who did not give birth in the past 12 months Now married:
33.7% (456)Unmarried:
66.3% (896)
Marital status - Asian population 15 years and over
Males 14.3% Never married83.8% Now married0.0% Separated1.9% Widowed0.0% DivorcedFemales 20.8% Never married65.8% Now married0.0% Separated6.8% Widowed6.6% DivorcedWomen who did not give birth in the past 12 months Now married:
67.1% (258)Unmarried:
32.9% (127)
Marital status - Other race population 15 years and over
Males 42.7% Never married54.6% Now married0.0% Separated0.0% Widowed2.6% DivorcedFemales 37.5% Never married33.3% Now married0.0% Separated0.0% Widowed29.2% DivorcedWomen who did not give birth in the past 12 months Now married:
32.7% (164)Unmarried:
67.3% (338)
Marital status - Two or more races population 15 years and over
Males 51.3% Never married38.6% Now married2.6% Separated0.3% Widowed7.1% DivorcedFemales 51.7% Never married40.7% Now married0.0% Separated3.7% Widowed3.9% DivorcedWomen who did not give birth in the past 12 months Now married:
40.2% (483)Unmarried:
59.8% (718)
Marital status - White alone, not Hispanic / Latino population 15 years and over
Males 36.6% Never married49.3% Now married0.4% Separated4.2% Widowed9.6% DivorcedFemales 28.4% Never married49.6% Now married1.1% Separated8.6% Widowed12.3% DivorcedWomen who gave birth in the past 12 months Now married:
76.5% (195)Unmarried:
23.5% (60)
Women who did not give birth in the past 12 months Now married:
38.6% (1,373)Unmarried:
61.4% (2,185)
Marital status - Hispanic or Latino population 15 years and over
Males 50.0% Never married40.4% Now married1.9% Separated0.0% Widowed7.7% DivorcedFemales 35.4% Never married42.7% Now married0.0% Separated1.9% Widowed20.0% DivorcedWomen who gave birth in the past 12 months Now married:
100.0% (40)Unmarried:
0.0% (0)
Women who did not give birth in the past 12 months Now married:
45.2% (714)Unmarried:
54.8% (868)
Ancestries in Naugatuck
1,908 13.3% Italian1,168 8.1% Portuguese1,131 7.9% Irish868 6.0% Polish672 4.7% Jamaican660 4.6% English600 4.2% American495 3.4% African415 2.9% Brazilian299 2.1% French Canadian208 1.4% European160 1.1% German142 1.0% Hungarian117 0.8% Albanian109 0.8% Ukrainian103 0.7% French84 0.6% Lithuanian76 0.5% Russian57 0.4% Turkish56 0.4% Ghanaian54 0.4% Arab54 0.4% Canadian42 0.3% Eastern European29 0.2% Greek28 0.2% Haitian28 0.2% Dutch24 0.2% Scandinavian23 0.2% Guyanese21 0.1% Slovak19 0.1% Moroccan17 0.1% West Indian14 0.10% Swedish10 0.07% Norwegian9 0.06% Syrian8 0.06% Austrian7 0.05% Egyptian7 0.05% Scottish6 0.04% Slovene
Geographical mobility in Naugatuck Same house 1 year ago 17,846 89.8% White (Caucasian)3,358 85.5% Black or African American1,308 87.5% Asian1,568 87.8% Other race3,739 84.9% Two or more races16,364 88.7% White alone, not Hispanic / Latino4,873 94.4% Hispanic or LatinoMoved within same county 1,031 5.2% White / Caucasian94 6.3% Asian149 8.4% Other race188 4.3% Two or more races1,123 6.1% White alone, not Hispanic / Latino151 2.9% Hispanic or LatinoMoved within same state 282 1.4% White / Caucasian195 5.0% Black or African American28 1.6% Other race421 9.6% Two or more races280 1.5% White alone, not Hispanic / Latino124 2.4% Hispanic or LatinoMoved from different state 628 3.2% White / Caucasian549 14.0% Black or African American73 4.9% Asian614 3.3% White alone, not Hispanic / Latino30 0.6% Hispanic or LatinoMoved from abroad 15 0.1% White11 0.3% Black or African American65 1.5% Two or more races15 0.3% Hispanic or Latino
Children Nativity (place of birth) in Naugatuck
Children under 6 years - Living with two parents Both parents native 1,019 100.0% NativeBoth parents foreign-born 198 100.0% NativeOne native, one foreign-born parent 259 100.0% NativeChildren under 6 years - Living with one parent Native parent 192 100.0% NativeChildren 6 to 17 years - Living with two parents Both parents native 1,717 98.8% Native22 1.2% Foreign-bornBoth parents foreign-born 608 60.6% Native396 39.4% Foreign-bornOne native, one foreign-born parent 205 100.0% NativeChildren 6 to 17 years - Living with one parent Native parent 764 100.0% NativeForeign-born parent 266 52.1% Native244 47.9% Foreign-born
Grandparents responsible for own grandchildren in Naugatuck
Grandparents (30 to 59 years) White / Caucasian 35 18.3% Responsible for grandchildren157 81.7% Not responsible for grandchildrenTwo or more races 16 100.0% Responsible for grandchildrenWhite alone, not Hispanic / Latino 28 14.6% Responsible for grandchildren167 85.4% Not responsible for grandchildrenHispanic or Latino 21 36.3% Responsible for grandchildren37 63.7% Not responsible for grandchildrenGrandparents (60 years and over) White / Caucasian 74 39.3% Responsible for grandchildren115 60.7% Not responsible for grandchildrenTwo or more races 118 100.0% Responsible for grandchildrenWhite alone, not Hispanic / Latino 49 39.4% Responsible for grandchildren76 60.6% Not responsible for grandchildrenHispanic or Latino 87 64.0% Responsible for grandchildren49 36.0% Not responsible for grandchildren