Races in New Baltimore, Virginia (VA) Detailed Stats
Data:
Races - White alone (%)
Races - White alone (% change since 2000)
Races - Black alone (%)
Races - Black alone (% change since 2000)
Races - American Indian alone (%)
Races - American Indian alone (% change since 2000)
Races - Asian alone (%)
Races - Asian alone (% change since 2000)
Races - Hispanic (%)
Races - Hispanic (% change since 2000)
Races - Native Hawaiian and Other Pacific Islander alone (%)
Races - Native Hawaiian and Other Pacific Islander alone (% change since 2000)
Races - Two or more races(%)
Races - Two or more races(% change since 2000)
Races - Other race alone (%)
Races - Other race alone (% change since 2000)
Racial diversity
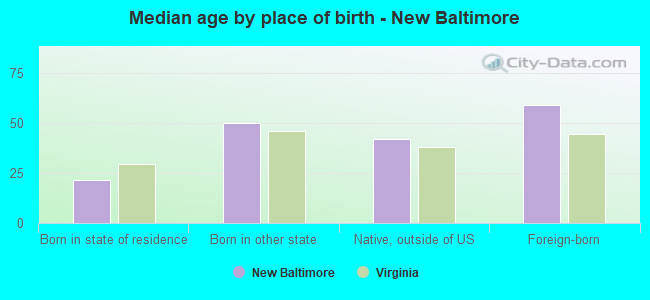
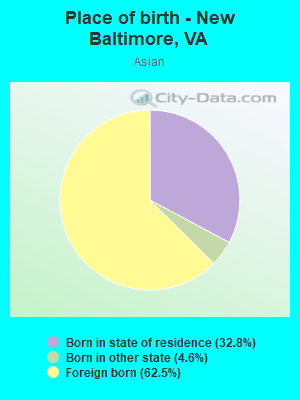
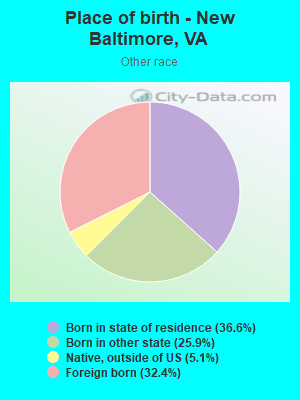
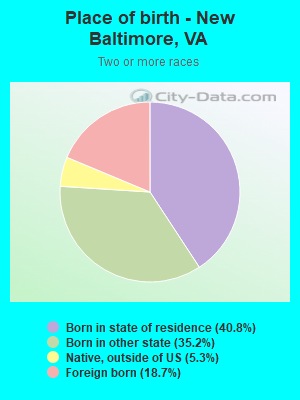
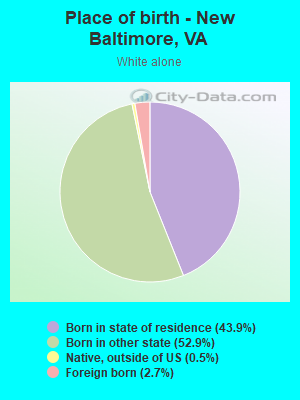
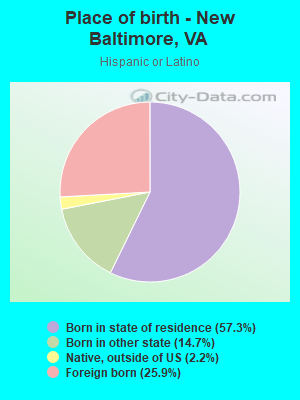
Place of birth - Born in state of residence (%)
Place of birth - Born in state of residence (%) - White
Place of birth - Born in state of residence (%) - Black or African American
Place of birth - Born in state of residence (%) - Asian
Place of birth - Born in state of residence (%) - Hispanic or Latino
Place of birth - Born in state of residence (%) - American Indian and Alaska Native
Place of birth - Born in state of residence (%) - Multirace
Place of birth - Born in state of residence (%) - Other Race
Place of birth - Born in other state (%)
Place of birth - Born in other state (%) - White
Place of birth - Born in other state (%) - Black or African American
Place of birth - Born in other state (%) - Asian
Place of birth - Born in other state (%) - Hispanic or Latino
Place of birth - Born in other state (%) - American Indian and Alaska Native
Place of birth - Born in other state (%) - Multirace
Place of birth - Born in other state (%) - Other Race
Place of birth - Native, outside of US (%)
Place of birth - Native, outside of US (%) - White
Place of birth - Native, outside of US (%) - Black or African American
Place of birth - Native, outside of US (%) - Asian
Place of birth - Native, outside of US (%) - Hispanic or Latino
Place of birth - Native, outside of US (%) - American Indian and Alaska Native
Place of birth - Native, outside of US (%) - Multirace
Place of birth - Native, outside of US (%) - Other Race
Place of birth - Foreign born (%)
Place of birth - Foreign born (%) - White
Place of birth - Foreign born (%) - Black or African American
Place of birth - Foreign born (%) - Asian
Place of birth - Foreign born (%) - Hispanic or Latino
Place of birth - Foreign born (%) - American Indian and Alaska Native
Place of birth - Foreign born (%) - Multirace
Place of birth - Foreign born (%) - Other Race
Residents speaking English at home (%)
Residents speaking English at home - Born in the United States (%)
Residents speaking English at home - Native, born elsewhere (%)
Residents speaking English at home - Foreign born (%)
Residents speaking Spanish at home (%)
Residents speaking Spanish at home - Born in the United States (%)
Residents speaking Spanish at home - Native, born elsewhere (%)
Residents speaking Spanish at home - Foreign born (%)
Residents speaking other language at home (%)
Residents speaking other language at home - Born in the United States (%)
Residents speaking other language at home - Native, born elsewhere (%)
Residents speaking other language at home - Foreign born (%)
Marital status - Never married (%)
Marital status - Now married (%)
Marital status - Separated (%)
Marital status - Widowed (%)
Marital status - Divorced (%)
Ancestries Reported - Arab (%)
Ancestries Reported - Czech (%)
Ancestries Reported - Danish (%)
Ancestries Reported - Dutch (%)
Ancestries Reported - English (%)
Ancestries Reported - French (%)
Ancestries Reported - French Canadian (%)
Ancestries Reported - German (%)
Ancestries Reported - Greek (%)
Ancestries Reported - Hungarian (%)
Ancestries Reported - Irish (%)
Ancestries Reported - Italian (%)
Ancestries Reported - Lithuanian (%)
Ancestries Reported - Norwegian (%)
Ancestries Reported - Polish (%)
Ancestries Reported - Portuguese (%)
Ancestries Reported - Russian (%)
Ancestries Reported - Scotch-Irish (%)
Ancestries Reported - Scottish (%)
Ancestries Reported - Slovak (%)
Ancestries Reported - Subsaharan African (%)
Ancestries Reported - Swedish (%)
Ancestries Reported - Swiss (%)
Ancestries Reported - Ukrainian (%)
Ancestries Reported - United States (%)
Ancestries Reported - Welsh (%)
Ancestries Reported - West Indian (%)
Ancestries Reported - Other (%)
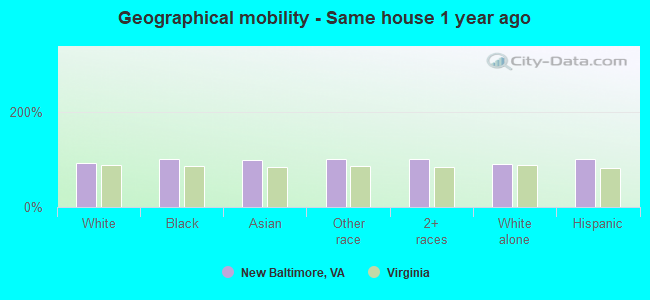
Geographical mobility - Same house 1 year ago (%)
Geographical mobility - Same house 1 year ago (%) - White
Geographical mobility - Same house 1 year ago (%) - Black or African American
Geographical mobility - Same house 1 year ago (%) - Asian
Geographical mobility - Same house 1 year ago (%) - Hispanic or Latino
Geographical mobility - Same house 1 year ago (%) - American Indian and Alaska Native
Geographical mobility - Same house 1 year ago (%) - Multirace
Geographical mobility - Same house 1 year ago (%) - Other Race
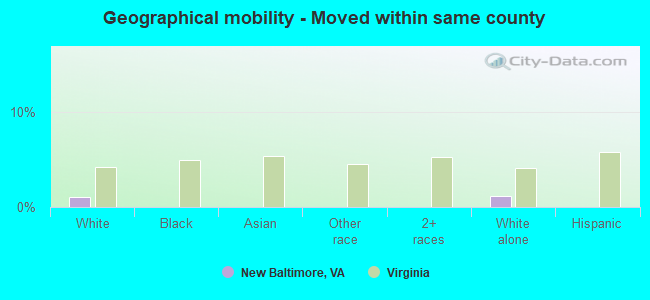
Geographical mobility - Moved within same county (%)
Geographical mobility - Moved within same county (%) - White
Geographical mobility - Moved within same county (%) - Black or African American
Geographical mobility - Moved within same county (%) - Asian
Geographical mobility - Moved within same county (%) - Hispanic or Latino
Geographical mobility - Moved within same county (%) - American Indian and Alaska Native
Geographical mobility - Moved within same county (%) - Multirace
Geographical mobility - Moved within same county (%) - Other Race
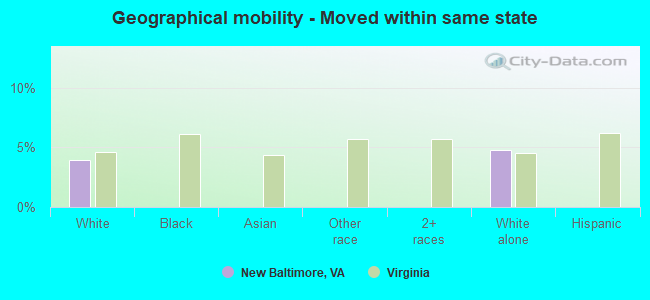
Geographical mobility - Moved from different county within same state (%)
Geographical mobility - Moved from different county within same state (%) - White
Geographical mobility - Moved from different county within same state (%) - Black or African American
Geographical mobility - Moved from different county within same state (%) - Asian
Geographical mobility - Moved from different county within same state (%) - Hispanic or Latino
Geographical mobility - Moved from different county within same state (%) - American Indian and Alaska Native
Geographical mobility - Moved from different county within same state (%) - Multirace
Geographical mobility - Moved from different county within same state (%) - Other Race
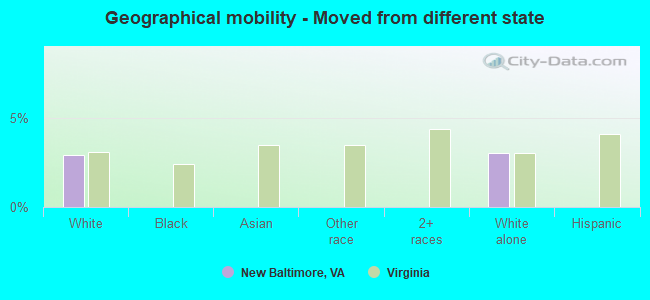
Geographical mobility - Moved from different state (%)
Geographical mobility - Moved from different state (%) - White
Geographical mobility - Moved from different state (%) - Black or African American
Geographical mobility - Moved from different state (%) - Asian
Geographical mobility - Moved from different state (%) - Hispanic or Latino
Geographical mobility - Moved from different state (%) - American Indian and Alaska Native
Geographical mobility - Moved from different state (%) - Multirace
Geographical mobility - Moved from different state (%) - Other Race
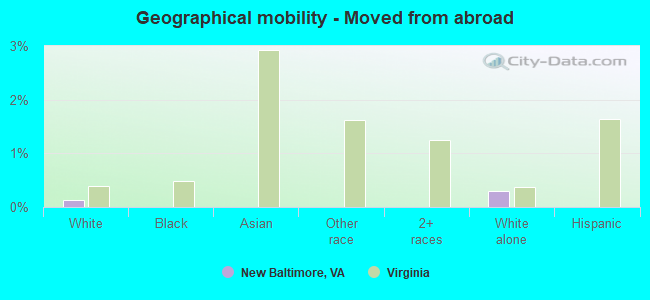
Geographical mobility - Moved from abroad (%)
Geographical mobility - Moved from abroad (%) - White
Geographical mobility - Moved from abroad (%) - Black or African American
Geographical mobility - Moved from abroad (%) - Asian
Geographical mobility - Moved from abroad (%) - Hispanic or Latino
Geographical mobility - Moved from abroad (%) - American Indian and Alaska Native
Geographical mobility - Moved from abroad (%) - Multirace
Geographical mobility - Moved from abroad (%) - Other Race
Place of birth for the foreign-born population - Ireland (%)
Place of birth for the foreign-born population - Denmark (%)
Place of birth for the foreign-born population - Norway (%)
Place of birth for the foreign-born population - Sweden (%)
Place of birth for the foreign-born population - United Kingdom (%)
Place of birth for the foreign-born population - England (%)
Place of birth for the foreign-born population - Scotland (%)
Place of birth for the foreign-born population - Other Northern Europe (%)
Place of birth for the foreign-born population - Austria (%)
Place of birth for the foreign-born population - Belgium (%)
Place of birth for the foreign-born population - France (%)
Place of birth for the foreign-born population - Germany (%)
Place of birth for the foreign-born population - Netherlands (%)
Place of birth for the foreign-born population - Switzerland (%)
Place of birth for the foreign-born population - Other Western Europe (%)
Place of birth for the foreign-born population - Greece (%)
Place of birth for the foreign-born population - Italy (%)
Place of birth for the foreign-born population - Portugal (%)
Place of birth for the foreign-born population - Spain (%)
Place of birth for the foreign-born population - Other Southern Europe (%)
Place of birth for the foreign-born population - Albania (%)
Place of birth for the foreign-born population - Belarus (%)
Place of birth for the foreign-born population - Bosnia and Herzegovina (%)
Place of birth for the foreign-born population - Bulgaria (%)
Place of birth for the foreign-born population - Croatia (%)
Place of birth for the foreign-born population - Czechoslovakia (%)
Place of birth for the foreign-born population - Hungary (%)
Place of birth for the foreign-born population - Latvia (%)
Place of birth for the foreign-born population - Lithuania (%)
Place of birth for the foreign-born population - North Macedonia (Macedonia) (%)
Place of birth for the foreign-born population - Moldova (%)
Place of birth for the foreign-born population - Poland (%)
Place of birth for the foreign-born population - Romania (%)
Place of birth for the foreign-born population - Russia (%)
Place of birth for the foreign-born population - Serbia (%)
Place of birth for the foreign-born population - Ukraine (%)
Place of birth for the foreign-born population - Other Eastern Europe (%)
Place of birth for the foreign-born population - China (%)
Place of birth for the foreign-born population - Hong Kong (%)
Place of birth for the foreign-born population - Taiwan (%)
Place of birth for the foreign-born population - Japan (%)
Place of birth for the foreign-born population - Korea (%)
Place of birth for the foreign-born population - Other Eastern Asia (%)
Place of birth for the foreign-born population - Afghanistan (%)
Place of birth for the foreign-born population - Bangladesh (%)
Place of birth for the foreign-born population - India (%)
Place of birth for the foreign-born population - Iran (%)
Place of birth for the foreign-born population - Kazakhstan (%)
Place of birth for the foreign-born population - Nepal (%)
Place of birth for the foreign-born population - Pakistan (%)
Place of birth for the foreign-born population - Sri Lanka (%)
Place of birth for the foreign-born population - Uzbekistan (%)
Place of birth for the foreign-born population - Other South Central Asia (%)
Place of birth for the foreign-born population - Burma (%)
Place of birth for the foreign-born population - Cambodia (%)
Place of birth for the foreign-born population - Indonesia (%)
Place of birth for the foreign-born population - Laos (%)
Place of birth for the foreign-born population - Malaysia (%)
Place of birth for the foreign-born population - Philippines (%)
Place of birth for the foreign-born population - Singapore (%)
Place of birth for the foreign-born population - Thailand (%)
Place of birth for the foreign-born population - Vietnam (%)
Place of birth for the foreign-born population - Other South Eastern Asia (%)
Place of birth for the foreign-born population - Armenia (%)
Place of birth for the foreign-born population - Iraq (%)
Place of birth for the foreign-born population - Israel (%)
Place of birth for the foreign-born population - Jordan (%)
Place of birth for the foreign-born population - Kuwait (%)
Place of birth for the foreign-born population - Lebanon (%)
Place of birth for the foreign-born population - Saudi Arabia (%)
Place of birth for the foreign-born population - Syria (%)
Place of birth for the foreign-born population - Turkey (%)
Place of birth for the foreign-born population - Yemen (%)
Place of birth for the foreign-born population - Other Western Asia (%)
Place of birth for the foreign-born population - Eritrea (%)
Place of birth for the foreign-born population - Ethiopia (%)
Place of birth for the foreign-born population - Kenya (%)
Place of birth for the foreign-born population - Somalia (%)
Place of birth for the foreign-born population - Uganda (%)
Place of birth for the foreign-born population - Zimbabwe (%)
Place of birth for the foreign-born population - Other Eastern Africa (%)
Place of birth for the foreign-born population - Cameroon (%)
Place of birth for the foreign-born population - Congo (%)
Place of birth for the foreign-born population - Democratic Republic of Congo (Zaire) (%)
Place of birth for the foreign-born population - Other Middle Africa (%)
Place of birth for the foreign-born population - Egypt (%)
Place of birth for the foreign-born population - Morocco (%)
Place of birth for the foreign-born population - Sudan (%)
Place of birth for the foreign-born population - Other Northern Africa (%)
Place of birth for the foreign-born population - South Africa (%)
Place of birth for the foreign-born population - Other Southern Africa (%)
Place of birth for the foreign-born population - Cabo Verde (%)
Place of birth for the foreign-born population - Ghana (%)
Place of birth for the foreign-born population - Liberia (%)
Place of birth for the foreign-born population - Nigeria (%)
Place of birth for the foreign-born population - Senegal (%)
Place of birth for the foreign-born population - Sierra Leone (%)
Place of birth for the foreign-born population - Other Western Africa (%)
Place of birth for the foreign-born population - Australia (%)
Place of birth for the foreign-born population - New Zealand (%)
Place of birth for the foreign-born population - Fiji (%)
Place of birth for the foreign-born population - Micronesia (%)
Place of birth for the foreign-born population - Bahamas (%)
Place of birth for the foreign-born population - Barbados (%)
Place of birth for the foreign-born population - Cuba (%)
Place of birth for the foreign-born population - Dominica (%)
Place of birth for the foreign-born population - Dominican Republic (%)
Place of birth for the foreign-born population - Grenada (%)
Place of birth for the foreign-born population - Haiti (%)
Place of birth for the foreign-born population - Jamaica (%)
Place of birth for the foreign-born population - St. Vincent and the Grenadines (%)
Place of birth for the foreign-born population - Trinidad and Tobago (%)
Place of birth for the foreign-born population - West Indies (%)
Place of birth for the foreign-born population - Other Caribbean (%)
Place of birth for the foreign-born population - Belize (%)
Place of birth for the foreign-born population - Costa Rica (%)
Place of birth for the foreign-born population - El Salvador (%)
Place of birth for the foreign-born population - Guatemala (%)
Place of birth for the foreign-born population - Honduras (%)
Place of birth for the foreign-born population - Mexico (%)
Place of birth for the foreign-born population - Nicaragua (%)
Place of birth for the foreign-born population - Panama (%)
Place of birth for the foreign-born population - Other Central America (%)
Place of birth for the foreign-born population - Argentina (%)
Place of birth for the foreign-born population - Bolivia (%)
Place of birth for the foreign-born population - Brazil (%)
Place of birth for the foreign-born population - Chile (%)
Place of birth for the foreign-born population - Colombia (%)
Place of birth for the foreign-born population - Ecuador (%)
Place of birth for the foreign-born population - Guyana (%)
Place of birth for the foreign-born population - Peru (%)
Place of birth for the foreign-born population - Uruguay (%)
Place of birth for the foreign-born population - Venezuela (%)
Place of birth for the foreign-born population - Other South America (%)
Place of birth for the foreign-born population - Canada (%)
Place of birth for the foreign-born population - Other Northern America (%)
Place of birth for the foreign-born population - Other (%)
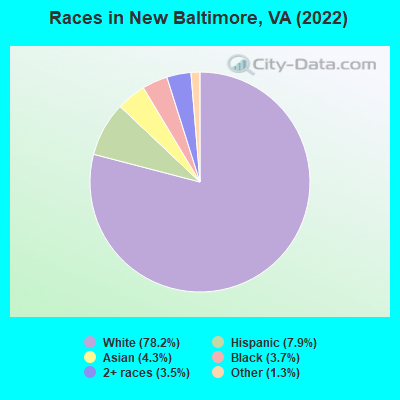
According to 2022 data, the most numerous races in New Baltimore, VA are White alone (9,353 residents), Black alone (437 residents), and Hispanic (944 residents). 89.0% of New Baltimore residents speak English at home.
Race distribution in New Baltimore 9,353 78.2% White alone 944 7.9% Hispanic 520 4.3% Asian alone 437 3.7% Black alone 414 3.5% Two or more races 156 1.3% Other race alone
2000 2022
4,965,637 70.2% White alone 1,376,378 19.4% Black alone 329,540 4.7% Hispanic 259,277 3.7% Asian alone 114,022 1.6% Two or more races 18,596 0.3% American Indian alone 11,685 0.2% Other race alone 3,380 0.05% Native Hawaiian and Other
5,095,130 58.7% White alone 1,594,785 18.4% Black alone 905,750 10.4% Hispanic 602,881 6.9% Asian alone 406,047 4.7% Two or more races 60,419 0.7% Other race alone 11,738 0.1% American Indian alone 6,869 0.08% Native Hawaiian and Other
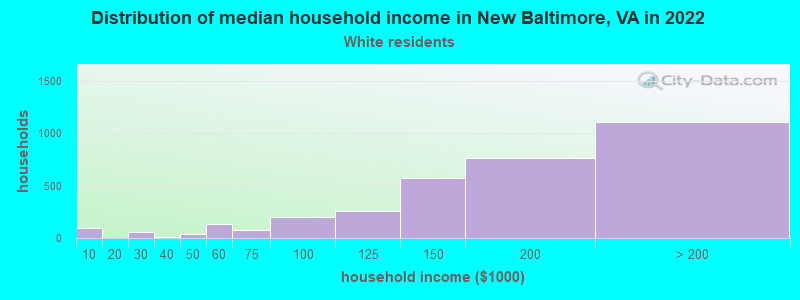
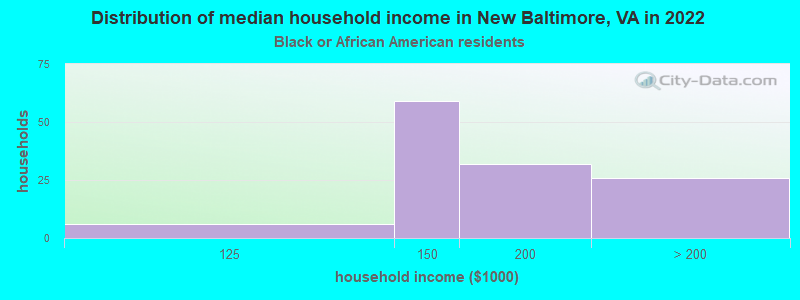
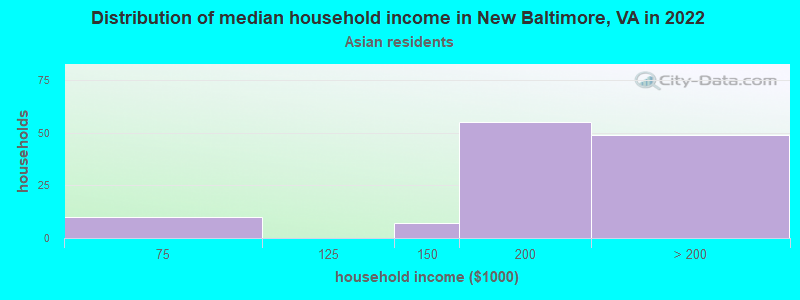
Income and house value in New Baltimore Median household income in 2022 $181,428 White non-Hispanic householders$182,642 Black householdersover $200,000 Asian householders$176,223 Some other race householdersover $200,000 Two or more races householders$195,316 Hispanic or Latino race householders
Median age by race in New Baltimore
42.8 Median age for White residents40.6 45.1 32.9 Median age for Black or African American residents36.0 47.6 -555,910,542.6 Median age for American Indian / Alaska Native residents-682,352,940.5 -737,288,134.9 48.0 Median age for Asian residents44.7 74.1 -666,666,666.0 Median age for Native Hawaiian / Pacific Islander residents-666,666,666.0 -666,666,666.0 26.1 Median age for Other race residents36.0 23.8 19.3 Median age for Two or more races residents17.4 41.2 42.2 Median age for White alone residents38.6 45.9 37.7 Median age for Hispanic or Latino residents41.8 29.8
Owner/renter occupied households by race in New Baltimore
House owners and renters - White residents 3,087 92.9% Owner occupied235 7.1% Renter occupiedHouse owners and renters - Black or African American residents 182 98.5% Owner occupied3 1.5% Renter occupiedHouse owners and renters - Asian residents 120 100.0% Owner occupiedHouse owners and renters - Other race residents 149 100.0% Owner occupiedHouse owners and renters - Two or more races residents 141 100.0% Owner occupiedHouse owners and renters - White alone residents 3,070 93.1% Owner occupied226 6.9% Renter occupiedHouse owners and renters - Hispanic or Latino residents 178 100.0% Owner occupied
Language usage in New Baltimore
English speakers - Total 89.0% of residents of New Baltimore speak English at home.
4.0% of residents speak Spanish at home 335 74.3% Speak English very well116 25.7% Speak English less than very well6.6% of residents speak other language at home 620 82.6% Speak English very well131 17.4% Speak English less than very well
English speakers - Born in the United States 95.4% of residents of New Baltimore speak English at home.
2.2% of residents speak Spanish at home 120 100.0% Speak English very well2.8% of residents speak other language at home 152 100.0% Speak English very well
English speakers - Native, born elsewhere 71.2% of residents of New Baltimore speak English at home.
20.5% of residents speak other language at home 27 100.0% Speak English very well
English speakers - Foreign-born 27.8% of residents of New Baltimore speak English at home.
17.4% of residents speak Spanish at home 82 44.3% Speak English very well103 55.7% Speak English less than very well53.3% of residents speak other language at home 413 72.7% Speak English very well155 27.3% Speak English less than very well
White (Caucasian) - Speak only English Native:
97.6% (8,569)Foreign-born:
43.9% (109)
White (Caucasian) - Speak another language Native:
2.2% (191)Foreign-born:
59.9% (149)
Black or African American - Speak only English Native:
99.8% (349)Foreign-born:
89.0% (21)
Asian - Speak only English Native:
80.5% (127)Foreign-born:
23.4% (79)
Asian - Speak another language Native:
14.1% (22)Foreign-born:
77.3% (261)
Other race - Speak only English Native:
46.2% (91)Foreign-born:
18.9% (24)
Other race - Speak another language Native:
53.8% (106)Foreign-born:
83.0% (104)
Two or more races - Speak only English Native:
72.6% (580)Foreign-born:
20.9% (29)
Two or more races - Speak another language Native:
28.5% (228)Foreign-born:
78.5% (109)
White alone - Speak only English Native:
97.8% (8,420)Foreign-born:
40.9% (103)
White alone - Speak another language Native:
2.2% (193)Foreign-born:
51.9% (131)
Hispanic or Latino - Speak only English Native:
63.6% (316)Foreign-born:
18.5% (44)
Hispanic or Latino - Speak another language Native:
39.0% (193)Foreign-born:
84.6% (199)
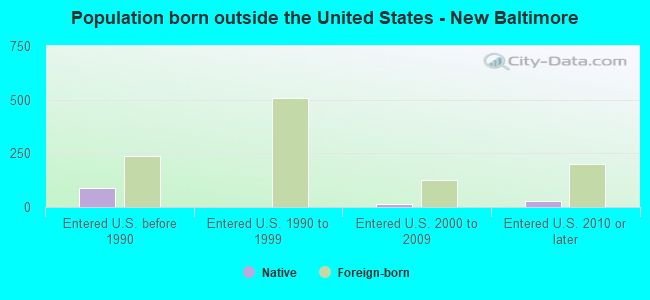
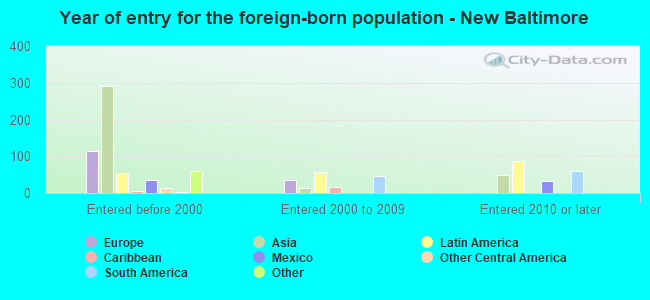
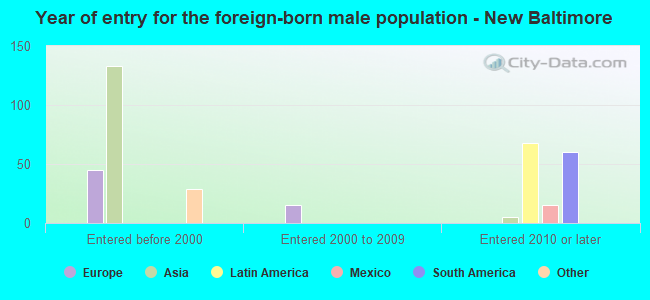
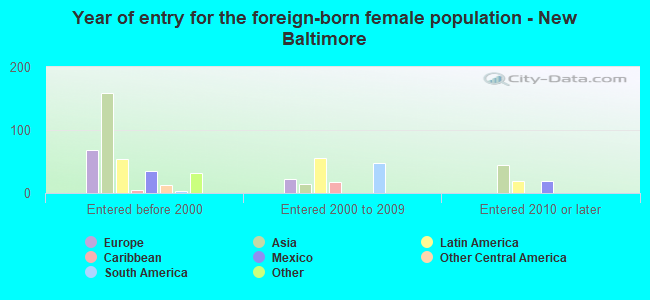
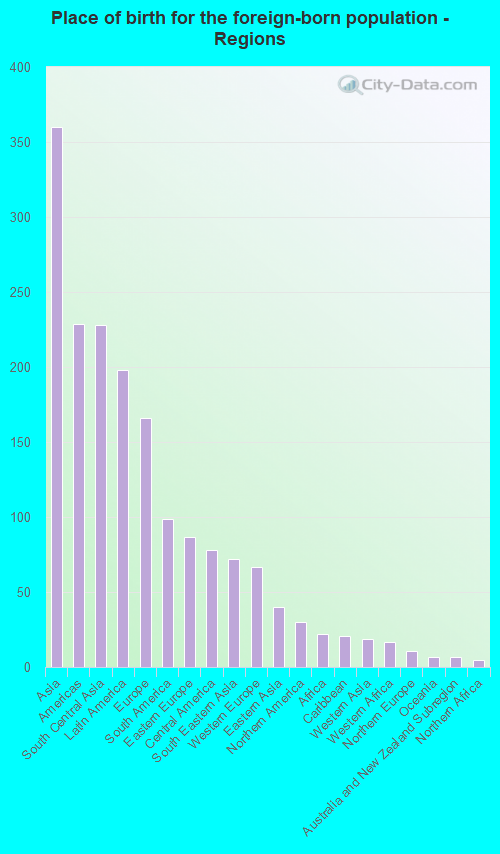
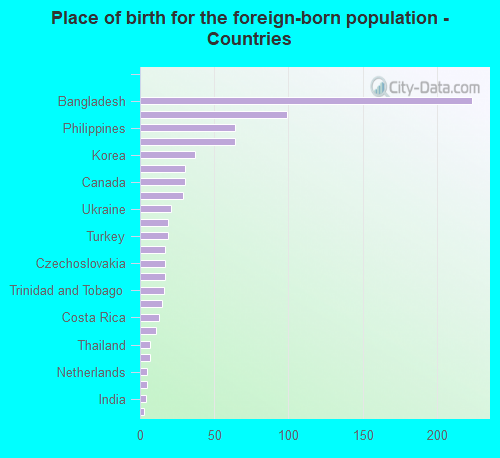
Foreign-born residents in New Baltimore
Marital status for residents in New Baltimore Marital status - White (Caucasian) population 15 years and over
Males 28.2% Never married65.4% Now married1.3% Separated1.2% Widowed3.9% DivorcedFemales 21.7% Never married65.2% Now married1.5% Separated8.5% Widowed3.1% DivorcedWomen who gave birth in the past 12 months Now married:
100.0% (71)Unmarried:
0.0% (0)
Women who did not give birth in the past 12 months Now married:
59.9% (1,135)Unmarried:
40.1% (760)
Marital status - Black or African American population 15 years and over
Males 38.7% Never married59.1% Now married0.0% Separated0.0% Widowed2.2% DivorcedFemales 22.5% Never married73.3% Now married0.0% Separated0.0% Widowed4.2% DivorcedWomen who did not give birth in the past 12 months Now married:
88.4% (60)Unmarried:
11.6% (8)
Marital status - Asian population 15 years and over
Males 44.6% Never married55.4% Now married0.0% Separated0.0% Widowed0.0% DivorcedFemales 0.0% Never married49.5% Now married0.0% Separated4.1% Widowed46.3% DivorcedWomen who did not give birth in the past 12 months Now married:
44.0% (41)Unmarried:
56.0% (53)
Marital status - Other race population 15 years and over
Males 14.5% Never married85.5% Now married0.0% Separated0.0% Widowed0.0% DivorcedFemales 2.1% Never married97.9% Now married0.0% Separated0.0% Widowed0.0% DivorcedWomen who did not give birth in the past 12 months Now married:
97.4% (99)Unmarried:
2.6% (3)
Marital status - Two or more races population 15 years and over
Males 43.2% Never married56.8% Now married0.0% Separated0.0% Widowed0.0% DivorcedFemales 18.2% Never married61.2% Now married0.0% Separated0.0% Widowed20.5% DivorcedWomen who gave birth in the past 12 months Now married:
100.0% (22)Unmarried:
0.0% (0)
Women who did not give birth in the past 12 months Now married:
54.3% (140)Unmarried:
45.7% (118)
Marital status - White alone, not Hispanic / Latino population 15 years and over
Males 28.1% Never married65.4% Now married1.4% Separated1.2% Widowed3.9% DivorcedFemales 21.9% Never married64.8% Now married1.5% Separated8.6% Widowed3.2% DivorcedWomen who gave birth in the past 12 months Now married:
100.0% (71)Unmarried:
0.0% (0)
Women who did not give birth in the past 12 months Now married:
60.1% (1,123)Unmarried:
39.9% (747)
Marital status - Hispanic or Latino population 15 years and over
Males 17.4% Never married82.6% Now married0.0% Separated0.0% Widowed0.0% DivorcedFemales 9.2% Never married84.4% Now married0.0% Separated0.0% Widowed6.4% DivorcedWomen who did not give birth in the past 12 months Now married:
84.5% (137)Unmarried:
15.5% (25)
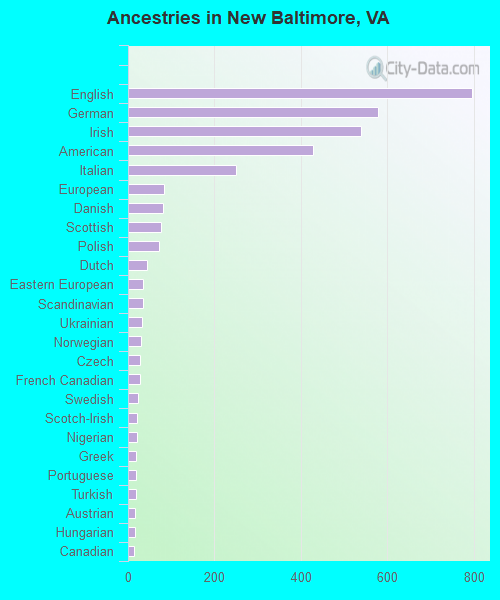
Ancestries in New Baltimore
795 17.7% English579 12.9% German538 12.0% Irish427 9.5% American249 5.5% Italian84 1.9% European82 1.8% Danish76 1.7% Scottish72 1.6% Polish43 1.0% Dutch35 0.8% Eastern European34 0.8% Scandinavian32 0.7% Ukrainian31 0.7% Norwegian27 0.6% Czech27 0.6% French Canadian24 0.5% Swedish20 0.4% Scotch-Irish20 0.4% Nigerian19 0.4% Greek19 0.4% Portuguese19 0.4% Turkish17 0.4% Austrian17 0.4% Hungarian14 0.3% Canadian13 0.3% Trinidadian and Tobagonian12 0.3% Czechoslovakian11 0.2% Slovak8 0.2% Welsh7 0.2% Slavic6 0.1% British5 0.1% Swiss2 0.04% Northern European
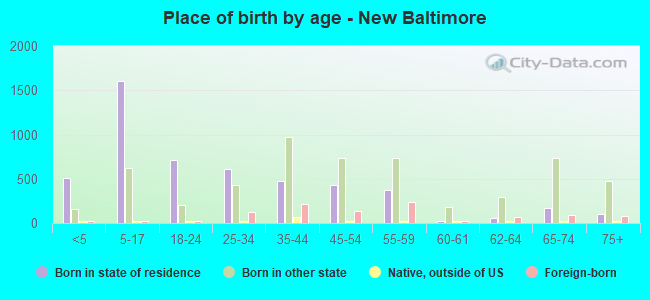
Children Nativity (place of birth) in New Baltimore
Children under 6 years - Living with two parents Both parents native 743 100.0% NativeBoth parents foreign-born 66 100.0% NativeOne native, one foreign-born parent 102 100.0% NativeChildren under 6 years - Living with one parent Native parent 36 100.0% NativeChildren 6 to 17 years - Living with two parents Both parents native 1,648 100.0% NativeOne native, one foreign-born parent 110 100.0% NativeChildren 6 to 17 years - Living with one parent Native parent 77 100.0% NativeForeign-born parent 52 65.7% Native27 34.3% Foreign-born
Grandparents responsible for own grandchildren in New Baltimore
Grandparents (30 to 59 years) White / Caucasian 14 100.0% Responsible for grandchildrenAsian 64 100.0% Not responsible for grandchildrenWhite alone, not Hispanic / Latino 15 100.0% Responsible for grandchildrenGrandparents (60 years and over) White / Caucasian 23 14.9% Responsible for grandchildren130 85.1% Not responsible for grandchildrenAsian 74 100.0% Not responsible for grandchildrenWhite alone, not Hispanic / Latino 23 14.4% Responsible for grandchildren137 85.6% Not responsible for grandchildren