Races in New Haven, Connecticut (CT) Detailed Stats
Data:
Races - White alone (%)
Races - White alone (% change since 2000)
Races - Black alone (%)
Races - Black alone (% change since 2000)
Races - American Indian alone (%)
Races - American Indian alone (% change since 2000)
Races - Asian alone (%)
Races - Asian alone (% change since 2000)
Races - Hispanic (%)
Races - Hispanic (% change since 2000)
Races - Native Hawaiian and Other Pacific Islander alone (%)
Races - Native Hawaiian and Other Pacific Islander alone (% change since 2000)
Races - Two or more races(%)
Races - Two or more races(% change since 2000)
Races - Other race alone (%)
Races - Other race alone (% change since 2000)
Racial diversity
Place of birth - Born in state of residence (%)
Place of birth - Born in state of residence (%) - White
Place of birth - Born in state of residence (%) - Black or African American
Place of birth - Born in state of residence (%) - Asian
Place of birth - Born in state of residence (%) - Hispanic or Latino
Place of birth - Born in state of residence (%) - American Indian and Alaska Native
Place of birth - Born in state of residence (%) - Multirace
Place of birth - Born in state of residence (%) - Other Race
Place of birth - Born in other state (%)
Place of birth - Born in other state (%) - White
Place of birth - Born in other state (%) - Black or African American
Place of birth - Born in other state (%) - Asian
Place of birth - Born in other state (%) - Hispanic or Latino
Place of birth - Born in other state (%) - American Indian and Alaska Native
Place of birth - Born in other state (%) - Multirace
Place of birth - Born in other state (%) - Other Race
Place of birth - Native, outside of US (%)
Place of birth - Native, outside of US (%) - White
Place of birth - Native, outside of US (%) - Black or African American
Place of birth - Native, outside of US (%) - Asian
Place of birth - Native, outside of US (%) - Hispanic or Latino
Place of birth - Native, outside of US (%) - American Indian and Alaska Native
Place of birth - Native, outside of US (%) - Multirace
Place of birth - Native, outside of US (%) - Other Race
Place of birth - Foreign born (%)
Place of birth - Foreign born (%) - White
Place of birth - Foreign born (%) - Black or African American
Place of birth - Foreign born (%) - Asian
Place of birth - Foreign born (%) - Hispanic or Latino
Place of birth - Foreign born (%) - American Indian and Alaska Native
Place of birth - Foreign born (%) - Multirace
Place of birth - Foreign born (%) - Other Race
Residents speaking English at home (%)
Residents speaking English at home - Born in the United States (%)
Residents speaking English at home - Native, born elsewhere (%)
Residents speaking English at home - Foreign born (%)
Residents speaking Spanish at home (%)
Residents speaking Spanish at home - Born in the United States (%)
Residents speaking Spanish at home - Native, born elsewhere (%)
Residents speaking Spanish at home - Foreign born (%)
Residents speaking other language at home (%)
Residents speaking other language at home - Born in the United States (%)
Residents speaking other language at home - Native, born elsewhere (%)
Residents speaking other language at home - Foreign born (%)
Marital status - Never married (%)
Marital status - Now married (%)
Marital status - Separated (%)
Marital status - Widowed (%)
Marital status - Divorced (%)
Ancestries Reported - Arab (%)
Ancestries Reported - Czech (%)
Ancestries Reported - Danish (%)
Ancestries Reported - Dutch (%)
Ancestries Reported - English (%)
Ancestries Reported - French (%)
Ancestries Reported - French Canadian (%)
Ancestries Reported - German (%)
Ancestries Reported - Greek (%)
Ancestries Reported - Hungarian (%)
Ancestries Reported - Irish (%)
Ancestries Reported - Italian (%)
Ancestries Reported - Lithuanian (%)
Ancestries Reported - Norwegian (%)
Ancestries Reported - Polish (%)
Ancestries Reported - Portuguese (%)
Ancestries Reported - Russian (%)
Ancestries Reported - Scotch-Irish (%)
Ancestries Reported - Scottish (%)
Ancestries Reported - Slovak (%)
Ancestries Reported - Subsaharan African (%)
Ancestries Reported - Swedish (%)
Ancestries Reported - Swiss (%)
Ancestries Reported - Ukrainian (%)
Ancestries Reported - United States (%)
Ancestries Reported - Welsh (%)
Ancestries Reported - West Indian (%)
Ancestries Reported - Other (%)
Geographical mobility - Same house 1 year ago (%)
Geographical mobility - Same house 1 year ago (%) - White
Geographical mobility - Same house 1 year ago (%) - Black or African American
Geographical mobility - Same house 1 year ago (%) - Asian
Geographical mobility - Same house 1 year ago (%) - Hispanic or Latino
Geographical mobility - Same house 1 year ago (%) - American Indian and Alaska Native
Geographical mobility - Same house 1 year ago (%) - Multirace
Geographical mobility - Same house 1 year ago (%) - Other Race
Geographical mobility - Moved within same county (%)
Geographical mobility - Moved within same county (%) - White
Geographical mobility - Moved within same county (%) - Black or African American
Geographical mobility - Moved within same county (%) - Asian
Geographical mobility - Moved within same county (%) - Hispanic or Latino
Geographical mobility - Moved within same county (%) - American Indian and Alaska Native
Geographical mobility - Moved within same county (%) - Multirace
Geographical mobility - Moved within same county (%) - Other Race
Geographical mobility - Moved from different county within same state (%)
Geographical mobility - Moved from different county within same state (%) - White
Geographical mobility - Moved from different county within same state (%) - Black or African American
Geographical mobility - Moved from different county within same state (%) - Asian
Geographical mobility - Moved from different county within same state (%) - Hispanic or Latino
Geographical mobility - Moved from different county within same state (%) - American Indian and Alaska Native
Geographical mobility - Moved from different county within same state (%) - Multirace
Geographical mobility - Moved from different county within same state (%) - Other Race
Geographical mobility - Moved from different state (%)
Geographical mobility - Moved from different state (%) - White
Geographical mobility - Moved from different state (%) - Black or African American
Geographical mobility - Moved from different state (%) - Asian
Geographical mobility - Moved from different state (%) - Hispanic or Latino
Geographical mobility - Moved from different state (%) - American Indian and Alaska Native
Geographical mobility - Moved from different state (%) - Multirace
Geographical mobility - Moved from different state (%) - Other Race
Geographical mobility - Moved from abroad (%)
Geographical mobility - Moved from abroad (%) - White
Geographical mobility - Moved from abroad (%) - Black or African American
Geographical mobility - Moved from abroad (%) - Asian
Geographical mobility - Moved from abroad (%) - Hispanic or Latino
Geographical mobility - Moved from abroad (%) - American Indian and Alaska Native
Geographical mobility - Moved from abroad (%) - Multirace
Geographical mobility - Moved from abroad (%) - Other Race
Place of birth for the foreign-born population - Ireland (%)
Place of birth for the foreign-born population - Denmark (%)
Place of birth for the foreign-born population - Norway (%)
Place of birth for the foreign-born population - Sweden (%)
Place of birth for the foreign-born population - United Kingdom (%)
Place of birth for the foreign-born population - England (%)
Place of birth for the foreign-born population - Scotland (%)
Place of birth for the foreign-born population - Other Northern Europe (%)
Place of birth for the foreign-born population - Austria (%)
Place of birth for the foreign-born population - Belgium (%)
Place of birth for the foreign-born population - France (%)
Place of birth for the foreign-born population - Germany (%)
Place of birth for the foreign-born population - Netherlands (%)
Place of birth for the foreign-born population - Switzerland (%)
Place of birth for the foreign-born population - Other Western Europe (%)
Place of birth for the foreign-born population - Greece (%)
Place of birth for the foreign-born population - Italy (%)
Place of birth for the foreign-born population - Portugal (%)
Place of birth for the foreign-born population - Spain (%)
Place of birth for the foreign-born population - Other Southern Europe (%)
Place of birth for the foreign-born population - Albania (%)
Place of birth for the foreign-born population - Belarus (%)
Place of birth for the foreign-born population - Bosnia and Herzegovina (%)
Place of birth for the foreign-born population - Bulgaria (%)
Place of birth for the foreign-born population - Croatia (%)
Place of birth for the foreign-born population - Czechoslovakia (%)
Place of birth for the foreign-born population - Hungary (%)
Place of birth for the foreign-born population - Latvia (%)
Place of birth for the foreign-born population - Lithuania (%)
Place of birth for the foreign-born population - North Macedonia (Macedonia) (%)
Place of birth for the foreign-born population - Moldova (%)
Place of birth for the foreign-born population - Poland (%)
Place of birth for the foreign-born population - Romania (%)
Place of birth for the foreign-born population - Russia (%)
Place of birth for the foreign-born population - Serbia (%)
Place of birth for the foreign-born population - Ukraine (%)
Place of birth for the foreign-born population - Other Eastern Europe (%)
Place of birth for the foreign-born population - China (%)
Place of birth for the foreign-born population - Hong Kong (%)
Place of birth for the foreign-born population - Taiwan (%)
Place of birth for the foreign-born population - Japan (%)
Place of birth for the foreign-born population - Korea (%)
Place of birth for the foreign-born population - Other Eastern Asia (%)
Place of birth for the foreign-born population - Afghanistan (%)
Place of birth for the foreign-born population - Bangladesh (%)
Place of birth for the foreign-born population - India (%)
Place of birth for the foreign-born population - Iran (%)
Place of birth for the foreign-born population - Kazakhstan (%)
Place of birth for the foreign-born population - Nepal (%)
Place of birth for the foreign-born population - Pakistan (%)
Place of birth for the foreign-born population - Sri Lanka (%)
Place of birth for the foreign-born population - Uzbekistan (%)
Place of birth for the foreign-born population - Other South Central Asia (%)
Place of birth for the foreign-born population - Burma (%)
Place of birth for the foreign-born population - Cambodia (%)
Place of birth for the foreign-born population - Indonesia (%)
Place of birth for the foreign-born population - Laos (%)
Place of birth for the foreign-born population - Malaysia (%)
Place of birth for the foreign-born population - Philippines (%)
Place of birth for the foreign-born population - Singapore (%)
Place of birth for the foreign-born population - Thailand (%)
Place of birth for the foreign-born population - Vietnam (%)
Place of birth for the foreign-born population - Other South Eastern Asia (%)
Place of birth for the foreign-born population - Armenia (%)
Place of birth for the foreign-born population - Iraq (%)
Place of birth for the foreign-born population - Israel (%)
Place of birth for the foreign-born population - Jordan (%)
Place of birth for the foreign-born population - Kuwait (%)
Place of birth for the foreign-born population - Lebanon (%)
Place of birth for the foreign-born population - Saudi Arabia (%)
Place of birth for the foreign-born population - Syria (%)
Place of birth for the foreign-born population - Turkey (%)
Place of birth for the foreign-born population - Yemen (%)
Place of birth for the foreign-born population - Other Western Asia (%)
Place of birth for the foreign-born population - Eritrea (%)
Place of birth for the foreign-born population - Ethiopia (%)
Place of birth for the foreign-born population - Kenya (%)
Place of birth for the foreign-born population - Somalia (%)
Place of birth for the foreign-born population - Uganda (%)
Place of birth for the foreign-born population - Zimbabwe (%)
Place of birth for the foreign-born population - Other Eastern Africa (%)
Place of birth for the foreign-born population - Cameroon (%)
Place of birth for the foreign-born population - Congo (%)
Place of birth for the foreign-born population - Democratic Republic of Congo (Zaire) (%)
Place of birth for the foreign-born population - Other Middle Africa (%)
Place of birth for the foreign-born population - Egypt (%)
Place of birth for the foreign-born population - Morocco (%)
Place of birth for the foreign-born population - Sudan (%)
Place of birth for the foreign-born population - Other Northern Africa (%)
Place of birth for the foreign-born population - South Africa (%)
Place of birth for the foreign-born population - Other Southern Africa (%)
Place of birth for the foreign-born population - Cabo Verde (%)
Place of birth for the foreign-born population - Ghana (%)
Place of birth for the foreign-born population - Liberia (%)
Place of birth for the foreign-born population - Nigeria (%)
Place of birth for the foreign-born population - Senegal (%)
Place of birth for the foreign-born population - Sierra Leone (%)
Place of birth for the foreign-born population - Other Western Africa (%)
Place of birth for the foreign-born population - Australia (%)
Place of birth for the foreign-born population - New Zealand (%)
Place of birth for the foreign-born population - Fiji (%)
Place of birth for the foreign-born population - Micronesia (%)
Place of birth for the foreign-born population - Bahamas (%)
Place of birth for the foreign-born population - Barbados (%)
Place of birth for the foreign-born population - Cuba (%)
Place of birth for the foreign-born population - Dominica (%)
Place of birth for the foreign-born population - Dominican Republic (%)
Place of birth for the foreign-born population - Grenada (%)
Place of birth for the foreign-born population - Haiti (%)
Place of birth for the foreign-born population - Jamaica (%)
Place of birth for the foreign-born population - St. Vincent and the Grenadines (%)
Place of birth for the foreign-born population - Trinidad and Tobago (%)
Place of birth for the foreign-born population - West Indies (%)
Place of birth for the foreign-born population - Other Caribbean (%)
Place of birth for the foreign-born population - Belize (%)
Place of birth for the foreign-born population - Costa Rica (%)
Place of birth for the foreign-born population - El Salvador (%)
Place of birth for the foreign-born population - Guatemala (%)
Place of birth for the foreign-born population - Honduras (%)
Place of birth for the foreign-born population - Mexico (%)
Place of birth for the foreign-born population - Nicaragua (%)
Place of birth for the foreign-born population - Panama (%)
Place of birth for the foreign-born population - Other Central America (%)
Place of birth for the foreign-born population - Argentina (%)
Place of birth for the foreign-born population - Bolivia (%)
Place of birth for the foreign-born population - Brazil (%)
Place of birth for the foreign-born population - Chile (%)
Place of birth for the foreign-born population - Colombia (%)
Place of birth for the foreign-born population - Ecuador (%)
Place of birth for the foreign-born population - Guyana (%)
Place of birth for the foreign-born population - Peru (%)
Place of birth for the foreign-born population - Uruguay (%)
Place of birth for the foreign-born population - Venezuela (%)
Place of birth for the foreign-born population - Other South America (%)
Place of birth for the foreign-born population - Canada (%)
Place of birth for the foreign-born population - Other Northern America (%)
Place of birth for the foreign-born population - Other (%)
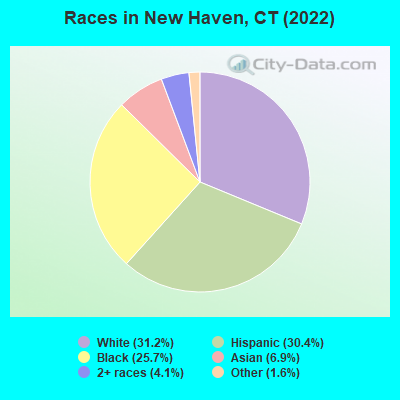
According to 2022 data, the most numerous races in New Haven, CT are White alone (43,352 residents), Hispanic (42,263 residents), and Black alone (35,715 residents). 67.9% of New Haven residents speak English at home. 18.2% of New Haven, CT residents are foreign-born (8.7% born in Latin America, 4.3% born in Asia, 2.6% born in Europe), which is 17.8% greater than the foreign-born rate of 15.0% across the entire state of Connecticut.
Race distribution in New Haven
2000 2022
44,598 36.1% Black alone 43,979 35.6% White alone 26,443 21.4% Hispanic 4,776 3.9% Asian alone 3,027 2.4% Two or more races 408 0.3% Other race alone 348 0.3% American Indian alone 47 0.04% Native Hawaiian and Other
43,352 31.2% White alone 42,263 30.4% Hispanic 35,715 25.7% Black alone 9,588 6.9% Asian alone 5,638 4.1% Two or more races 2,289 1.6% Other race alone 64 0.05% American Indian alone
2000 2022
2,638,845 77.5% White alone 320,323 9.4% Hispanic 295,571 8.7% Black alone 81,564 2.4% Asian alone 52,896 1.6% Two or more races 8,141 0.2% Other race alone 7,267 0.2% American Indian alone 958 0.03% Native Hawaiian and Other
2,246,913 62.0% White alone 658,978 18.2% Hispanic 353,973 9.8% Black alone 172,929 4.8% Asian alone 159,631 4.4% Two or more races 29,761 0.8% Other race alone 3,428 0.09% American Indian alone 592 0.02% Native Hawaiian and Other
Income and house value in New Haven Median household income in 2022 $67,951 White non-Hispanic householders$40,919 Black householders$62,738 Asian householders$59,022 Some other race householders$43,991 Two or more races householders$47,356 Hispanic or Latino race householdersMedian 2022 house value $299,398 White Non-Hispanic householders$248,475 Black or African American householders$193,457 American Indian or Alaska Native householders $319,870 Asian householders$204,461 Some other race householders$234,657 Two or more races householders$227,747 Hispanic or Latino householders
Median age by race in New Haven
30.9 Median age for White residents33.1 28.5 30.7 Median age for Black or African American residents28.9 33.1 55.3 Median age for American Indian / Alaska Native residents22.7 56.2 26.3 Median age for Asian residents27.0 26.0 -666,666,666.0 Median age for Native Hawaiian / Pacific Islander residents-666,666,666.0 -666,666,666.0 34.7 Median age for Other race residents34.1 35.0 26.0 Median age for Two or more races residents28.0 25.3 33.0 Median age for White alone residents36.1 29.6 28.8 Median age for Hispanic or Latino residents26.6 31.1
Owner/renter occupied households by race in New Haven
House owners and renters - White residents 8,185 34.6% Owner occupied15,480 65.4% Renter occupiedHouse owners and renters - Black or African American residents 3,011 21.3% Owner occupied11,125 78.7% Renter occupiedHouse owners and renters - American Indian / Alaska Native residents 10 6.5% Owner occupied144 93.5% Renter occupiedHouse owners and renters - Asian residents 750 22.8% Owner occupied2,538 77.2% Renter occupiedHouse owners and renters - Other race residents 1,795 23.2% Owner occupied5,939 76.8% Renter occupiedHouse owners and renters - Two or more races residents 2,295 32.0% Owner occupied4,867 68.0% Renter occupiedHouse owners and renters - White alone residents 8,024 38.0% Owner occupied13,114 62.0% Renter occupiedHouse owners and renters - Hispanic or Latino residents 3,523 22.9% Owner occupied11,866 77.1% Renter occupied
Language usage in New Haven
English speakers - Total 67.9% of residents of New Haven speak English at home.
22.6% of residents speak Spanish at home 18,927 63.6% Speak English very well10,838 36.4% Speak English less than very well9.5% of residents speak other language at home 8,843 71.1% Speak English very well3,598 28.9% Speak English less than very well
English speakers - Born in the United States 77.6% of residents of New Haven speak English at home.
15.7% of residents speak Spanish at home 5,070 78.3% Speak English very well1,407 21.7% Speak English less than very well6.7% of residents speak other language at home 2,418 88.0% Speak English very well330 12.0% Speak English less than very well
English speakers - Native, born elsewhere 19.0% of residents of New Haven speak English at home.
76.0% of residents speak Spanish at home 3,601 51.9% Speak English very well3,337 48.1% Speak English less than very well4.9% of residents speak other language at home 414 91.8% Speak English very well37 8.2% Speak English less than very well
English speakers - Foreign-born 27.8% of residents of New Haven speak English at home.
36.4% of residents speak Spanish at home 3,842 44.3% Speak English very well4,821 55.7% Speak English less than very well35.8% of residents speak other language at home 5,366 63.0% Speak English very well3,151 37.0% Speak English less than very well
White (Caucasian) - Speak only English Native:
89.5% (38,098)Foreign-born:
35.4% (1,806)
White (Caucasian) - Speak another language Native:
10.5% (4,466)Foreign-born:
64.6% (3,293)
Black or African American - Speak only English Native:
97.7% (31,603)Foreign-born:
70.7% (2,395)
Black or African American - Speak another language Native:
2.3% (737)Foreign-born:
29.3% (992)
American Indian / Alaska Native - Speak another language Native:
41.5% (113)Foreign-born:
92.6% (177)
Asian - Speak only English Native:
31.2% (728)Foreign-born:
21.4% (1,431)
Asian - Speak another language Native:
68.8% (1,603)Foreign-born:
78.6% (5,268)
Other race - Speak only English Native:
31.8% (4,876)Foreign-born:
16.7% (742)
Other race - Speak another language Native:
68.2% (10,477)Foreign-born:
83.3% (3,709)
Two or more races - Speak only English Native:
48.7% (7,139)Foreign-born:
5.7% (233)
Two or more races - Speak another language Native:
51.3% (7,509)Foreign-born:
94.3% (3,881)
White alone - Speak only English Native:
95.3% (36,202)Foreign-born:
41.8% (1,593)
White alone - Speak another language Native:
4.7% (1,771)Foreign-born:
58.2% (2,215)
Hispanic or Latino - Speak only English Native:
33.6% (10,214)Foreign-born:
7.0% (665)
Hispanic or Latino - Speak another language Native:
66.4% (20,174)Foreign-born:
93.0% (8,800)
Foreign-born residents in New Haven 24,863 residents are foreign born (8.7% Latin America , 4.3% Asia , 2.6% Europe ).
This city:
18.2%Connecticut:
15.0%
Marital status for residents in New Haven Marital status - White (Caucasian) population 15 years and over
Males 58.7% Never married30.5% Now married0.4% Separated0.6% Widowed9.9% DivorcedFemales 57.1% Never married25.3% Now married1.5% Separated9.7% Widowed6.4% DivorcedWomen who gave birth in the past 12 months Now married:
89.9% (492)Unmarried:
10.1% (55)
Women who did not give birth in the past 12 months Now married:
20.3% (3,257)Unmarried:
79.7% (12,781)
Marital status - Black or African American population 15 years and over
Males 73.1% Never married15.1% Now married4.4% Separated1.5% Widowed6.0% DivorcedFemales 65.3% Never married16.7% Now married1.0% Separated5.8% Widowed11.2% DivorcedWomen who gave birth in the past 12 months Now married:
50.0% (67)Unmarried:
50.0% (67)
Women who did not give birth in the past 12 months Now married:
15.9% (1,780)Unmarried:
84.1% (9,400)
Marital status - American Indian / Alaska Native population 15 years and over
Males 83.5% Never married0.0% Now married0.0% Separated0.0% Widowed16.5% DivorcedFemales 45.2% Never married0.0% Now married15.6% Separated0.0% Widowed39.3% DivorcedWomen who did not give birth in the past 12 months Now married:
0.0% (0)Unmarried:
100.0% (50)
Marital status - Asian population 15 years and over
Males 57.2% Never married39.0% Now married0.6% Separated0.8% Widowed2.3% DivorcedFemales 57.1% Never married37.0% Now married0.4% Separated1.5% Widowed4.0% DivorcedWomen who gave birth in the past 12 months Now married:
100.0% (192)Unmarried:
0.0% (0)
Women who did not give birth in the past 12 months Now married:
27.6% (960)Unmarried:
72.4% (2,513)
Marital status - Other race population 15 years and over
Males 64.6% Never married32.8% Now married0.0% Separated0.0% Widowed2.5% DivorcedFemales 39.5% Never married37.3% Now married1.7% Separated3.6% Widowed17.9% DivorcedWomen who gave birth in the past 12 months Now married:
36.3% (70)Unmarried:
63.7% (123)
Women who did not give birth in the past 12 months Now married:
28.0% (1,871)Unmarried:
72.0% (4,819)
Marital status - Two or more races population 15 years and over
Males 66.1% Never married22.3% Now married0.0% Separated1.2% Widowed10.4% DivorcedFemales 56.6% Never married20.1% Now married1.8% Separated5.4% Widowed16.1% DivorcedWomen who gave birth in the past 12 months Now married:
52.4% (84)Unmarried:
47.6% (76)
Women who did not give birth in the past 12 months Now married:
23.9% (1,262)Unmarried:
76.1% (4,012)
Marital status - White alone, not Hispanic / Latino population 15 years and over
Males 58.9% Never married30.3% Now married0.4% Separated0.7% Widowed9.7% DivorcedFemales 56.8% Never married25.9% Now married0.6% Separated10.8% Widowed6.0% DivorcedWomen who gave birth in the past 12 months Now married:
86.2% (344)Unmarried:
13.8% (55)
Women who did not give birth in the past 12 months Now married:
19.8% (2,791)Unmarried:
80.2% (11,326)
Marital status - Hispanic or Latino population 15 years and over
Males 64.8% Never married28.2% Now married0.0% Separated0.0% Widowed7.0% DivorcedFemales 49.3% Never married27.3% Now married2.1% Separated3.4% Widowed17.9% DivorcedWomen who gave birth in the past 12 months Now married:
100.0% (310)Unmarried:
0.0% (0)
Women who did not give birth in the past 12 months Now married:
26.9% (3,082)Unmarried:
73.1% (8,363)
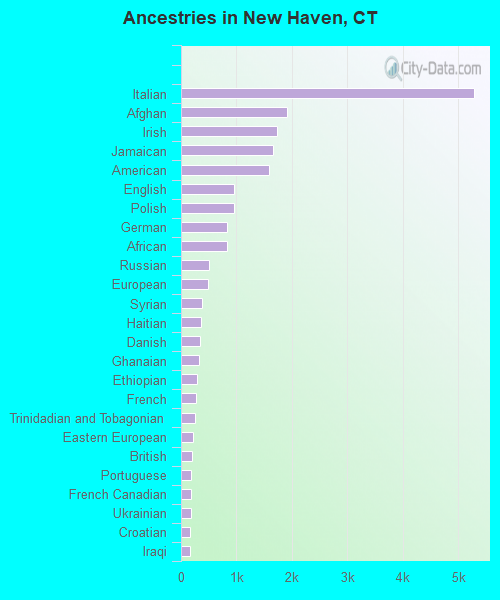
Ancestries in New Haven
5,287 6.4% Italian1,914 2.3% Afghan1,728 2.1% Irish1,667 2.0% Jamaican1,591 1.9% American958 1.2% English948 1.1% Polish829 1.0% German828 1.0% African509 0.6% Russian483 0.6% European376 0.5% Syrian356 0.4% Haitian339 0.4% Danish316 0.4% Ghanaian290 0.4% Ethiopian274 0.3% French249 0.3% Trinidadian and Tobagonian221 0.3% Eastern European197 0.2% British188 0.2% Portuguese180 0.2% French Canadian174 0.2% Ukrainian169 0.2% Croatian163 0.2% Iraqi153 0.2% Arab142 0.2% Guyanese134 0.2% Scottish127 0.2% Dutch126 0.2% Nigerian117 0.1% Canadian115 0.1% Brazilian107 0.1% Cape Verdean106 0.1% Greek104 0.1% Norwegian98 0.1% Hungarian96 0.1% Slovak95 0.1% British West Indian84 0.1% Swedish75 0.09% Moroccan74 0.09% Serbian69 0.08% Scotch-Irish62 0.08% Kenyan60 0.07% Latvian59 0.07% Israeli59 0.07% South African57 0.07% Czech53 0.06% Zimbabwean48 0.06% Egyptian43 0.05% Lithuanian43 0.05% Lebanese43 0.05% Austrian40 0.05% Swiss39 0.05% Iranian38 0.05% Northern European34 0.04% Turkish34 0.04% Liberian34 0.04% Yugoslavian33 0.04% West Indian28 0.03% Scandinavian28 0.03% Welsh27 0.03% Finnish22 0.03% Slavic20 0.02% Pennsylvania German20 0.02% Armenian19 0.02% Romanian19 0.02% Albanian17 0.02% Palestinian10 0.01% Jordanian9 0.01% Australian8 0.01% Sudanese7 0.01% U.S. Virgin Islander
Geographical mobility in New Haven Same house 1 year ago 37,292 75.5% White (Caucasian)35,679 94.5% Black or African American364 78.7% American Indian / Alaska Native6,890 72.1% Asian18,727 94.0% Other race16,357 81.1% Two or more races32,615 75.8% White alone, not Hispanic / Latino35,762 85.8% Hispanic or LatinoMoved within same county 3,465 7.0% White / Caucasian530 1.4% Black or African American8 1.8% American Indian / Alaska Native440 4.6% Asian416 2.1% Other race1,952 9.7% Two or more races2,985 6.9% White alone, not Hispanic / Latino2,388 5.7% Hispanic or LatinoMoved within same state 962 1.9% White / Caucasian153 0.4% Black or African American16 3.4% American Indian / Alaska Native119 1.2% Asian75 0.4% Other race233 1.2% Two or more races940 2.2% White alone, not Hispanic / Latino251 0.6% Hispanic or LatinoMoved from different state 7,276 14.7% White / Caucasian1,207 3.2% Black or African American38 8.2% American Indian / Alaska Native728 7.6% Asian214 1.1% Other race1,444 7.2% Two or more races6,133 14.3% White alone, not Hispanic / Latino2,626 6.3% Hispanic or LatinoMoved from abroad 385 0.8% White188 0.5% Black or African American26 5.6% American Indian / Alaska Native1,379 14.4% Asian491 2.5% Other race192 1.0% Two or more races327 0.8% White alone, not Hispanic / Latino656 1.6% Hispanic or Latino
Children Nativity (place of birth) in New Haven
Children under 6 years - Living with two parents Both parents native 2,434 100.0% NativeBoth parents foreign-born 865 77.2% Native256 22.8% Foreign-bornOne native, one foreign-born parent 566 100.0% NativeChildren under 6 years - Living with one parent Native parent 4,409 100.0% NativeForeign-born parent 84 100.0% Foreign-bornChildren 6 to 17 years - Living with two parents Both parents native 1,985 100.0% NativeBoth parents foreign-born 1,156 44.1% Native1,463 55.9% Foreign-bornOne native, one foreign-born parent 1,484 100.0% NativeChildren 6 to 17 years - Living with one parent Native parent 12,231 100.0% NativeForeign-born parent 1,287 58.3% Native919 41.7% Foreign-born
Place of birth for residents in New Haven 12,927 Americas12,357 Latin America6,148 Asia5,569 Central America3,651 Europe3,552 South America3,235 Caribbean2,449 Eastern Asia2,186 South Central Asia1,961 Africa1,708 China1,674 Eastern Europe931 Western Asia891 Northern Europe646 Western Africa585 Eastern Africa580 South Eastern Asia570 Northern America548 Southern Europe536 Western Europe318 Middle Africa173 Oceania172 Northern Africa118 Australia and New Zealand Subregion54 Southern Africa3,846 Mexico1,700 Jamaica1,530 China1,420 Ecuador1,223 Guatemala1,102 Afghanistan804 Dominican Republic783 Colombia740 India603 Russia577 Korea563 Canada368 Syria324 Nigeria321 United Kingdom315 Germany288 Peru288 Argentina283 Italy277 Poland270 Denmark254 El Salvador253 Brazil215 Venezuela212 Philippines208 Tanzania192 Trinidad and Tobago184 Ghana183 Spain177 Pakistan173 Haiti162 Israel160 Honduras159 France157 Ethiopia155 Japan143 Serbia143 Cuba138 Democratic Republic of Congo (Zaire)137 Iraq135 England97 Chile96 Guyana96 Taiwan90 Jordan88 Thailand86 Iran81 Sweden81 Hong Kong81 Croatia78 Morocco78 Kenya77 Czechoslovakia74 Nicaragua71 Congo71 Romania69 Vietnam69 Indonesia68 Togo64 New Zealand61 Bolivia58 Greece57 Dominica53 Laos53 Australia52 Sri Lanka51 Singapore49 Ireland48 South Africa46 Sudan45 Ivory Coast43 Marshall Islands43 Moldova38 Zimbabwe35 Hungary34 Latvia32 Saudi Arabia30 Turkey30 Scotland30 Lebanon29 Belarus27 Switzerland26 Yemen26 Egypt24 Cameroon23 Portugal21 North Macedonia (Macedonia)21 Austria19 Cambodia18 Kazakhstan18 Algeria15 Kuwait14 Uruguay12 Ukraine11 Malaysia11 Eritrea11 Netherlands10 Costa Rica9 United Arab Emirates9 Liberia9 Bulgaria6 Bangladesh5 Burma (Myanmar)4 Norway2 Belgium2 Nepal1 Bahamas
Grandparents responsible for own grandchildren in New Haven
Grandparents (30 to 59 years) White / Caucasian 38 46.0% Responsible for grandchildren45 54.0% Not responsible for grandchildrenBlack or African American 203 62.5% Responsible for grandchildren122 37.5% Not responsible for grandchildrenAsian 30 100.0% Not responsible for grandchildrenOther race 28 8.2% Responsible for grandchildren314 91.8% Not responsible for grandchildrenTwo or more races 142 100.0% Responsible for grandchildrenWhite alone, not Hispanic / Latino 43 77.4% Responsible for grandchildren13 22.6% Not responsible for grandchildrenHispanic or Latino 101 27.7% Responsible for grandchildren264 72.3% Not responsible for grandchildrenGrandparents (60 years and over) White / Caucasian 59 23.0% Responsible for grandchildren196 77.0% Not responsible for grandchildrenBlack or African American 83 15.0% Responsible for grandchildren471 85.0% Not responsible for grandchildrenAsian 39 100.0% Not responsible for grandchildrenOther race 218 62.2% Responsible for grandchildren132 37.8% Not responsible for grandchildrenTwo or more races 227 64.5% Responsible for grandchildren125 35.5% Not responsible for grandchildrenWhite alone, not Hispanic / Latino 62 29.8% Responsible for grandchildren146 70.2% Not responsible for grandchildrenHispanic or Latino 235 51.1% Responsible for grandchildren225 48.9% Not responsible for grandchildren