Races in New Ulm, Minnesota (MN) Detailed Stats
Data:
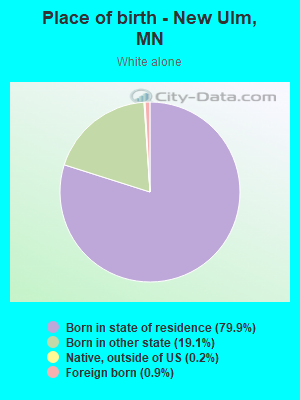
Races - White alone (%)
Races - White alone (% change since 2000)
Races - Black alone (%)
Races - Black alone (% change since 2000)
Races - American Indian alone (%)
Races - American Indian alone (% change since 2000)
Races - Asian alone (%)
Races - Asian alone (% change since 2000)
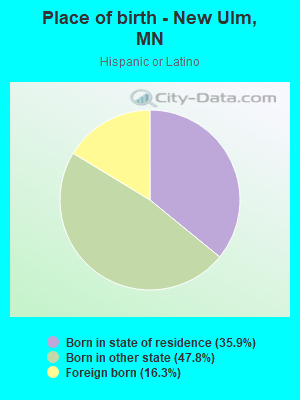
Races - Hispanic (%)
Races - Hispanic (% change since 2000)
Races - Native Hawaiian and Other Pacific Islander alone (%)
Races - Native Hawaiian and Other Pacific Islander alone (% change since 2000)
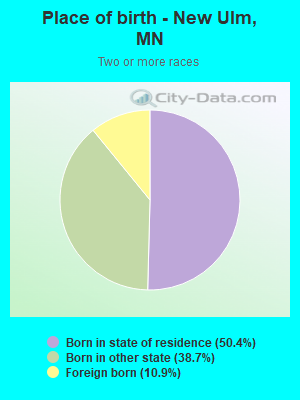
Races - Two or more races(%)
Races - Two or more races(% change since 2000)
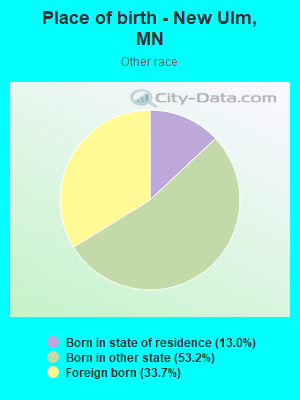
Races - Other race alone (%)
Races - Other race alone (% change since 2000)
Racial diversity
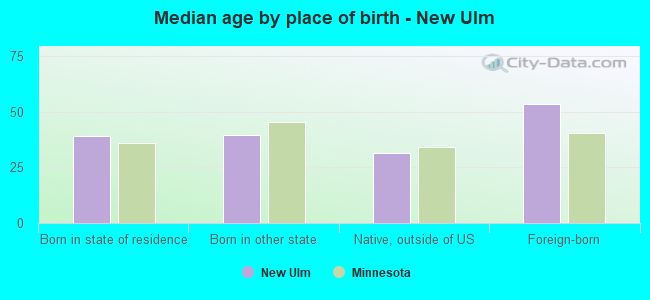
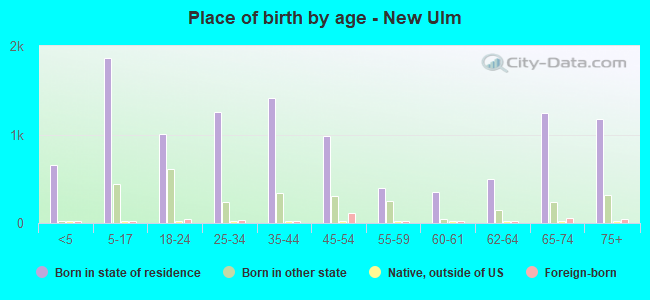
Place of birth - Born in state of residence (%)
Place of birth - Born in state of residence (%) - White
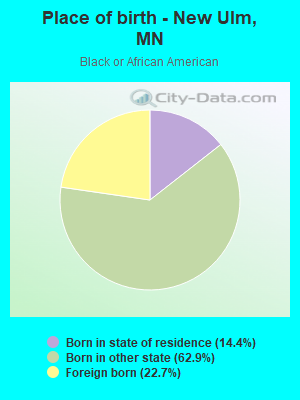
Place of birth - Born in state of residence (%) - Black or African American
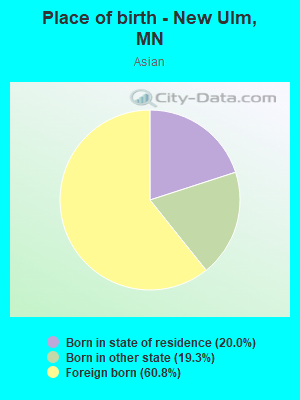
Place of birth - Born in state of residence (%) - Asian
Place of birth - Born in state of residence (%) - Hispanic or Latino
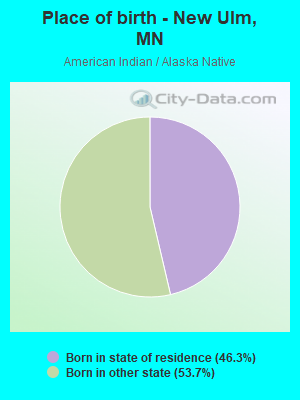
Place of birth - Born in state of residence (%) - American Indian and Alaska Native
Place of birth - Born in state of residence (%) - Multirace
Place of birth - Born in state of residence (%) - Other Race
Place of birth - Born in other state (%)
Place of birth - Born in other state (%) - White
Place of birth - Born in other state (%) - Black or African American
Place of birth - Born in other state (%) - Asian
Place of birth - Born in other state (%) - Hispanic or Latino
Place of birth - Born in other state (%) - American Indian and Alaska Native
Place of birth - Born in other state (%) - Multirace
Place of birth - Born in other state (%) - Other Race
Place of birth - Native, outside of US (%)
Place of birth - Native, outside of US (%) - White
Place of birth - Native, outside of US (%) - Black or African American
Place of birth - Native, outside of US (%) - Asian
Place of birth - Native, outside of US (%) - Hispanic or Latino
Place of birth - Native, outside of US (%) - American Indian and Alaska Native
Place of birth - Native, outside of US (%) - Multirace
Place of birth - Native, outside of US (%) - Other Race
Place of birth - Foreign born (%)
Place of birth - Foreign born (%) - White
Place of birth - Foreign born (%) - Black or African American
Place of birth - Foreign born (%) - Asian
Place of birth - Foreign born (%) - Hispanic or Latino
Place of birth - Foreign born (%) - American Indian and Alaska Native
Place of birth - Foreign born (%) - Multirace
Place of birth - Foreign born (%) - Other Race
Residents speaking English at home (%)
Residents speaking English at home - Born in the United States (%)
Residents speaking English at home - Native, born elsewhere (%)
Residents speaking English at home - Foreign born (%)
Residents speaking Spanish at home (%)
Residents speaking Spanish at home - Born in the United States (%)
Residents speaking Spanish at home - Native, born elsewhere (%)
Residents speaking Spanish at home - Foreign born (%)
Residents speaking other language at home (%)
Residents speaking other language at home - Born in the United States (%)
Residents speaking other language at home - Native, born elsewhere (%)
Residents speaking other language at home - Foreign born (%)
Marital status - Never married (%)
Marital status - Now married (%)
Marital status - Separated (%)
Marital status - Widowed (%)
Marital status - Divorced (%)
Ancestries Reported - Arab (%)
Ancestries Reported - Czech (%)
Ancestries Reported - Danish (%)
Ancestries Reported - Dutch (%)
Ancestries Reported - English (%)
Ancestries Reported - French (%)
Ancestries Reported - French Canadian (%)
Ancestries Reported - German (%)
Ancestries Reported - Greek (%)
Ancestries Reported - Hungarian (%)
Ancestries Reported - Irish (%)
Ancestries Reported - Italian (%)
Ancestries Reported - Lithuanian (%)
Ancestries Reported - Norwegian (%)
Ancestries Reported - Polish (%)
Ancestries Reported - Portuguese (%)
Ancestries Reported - Russian (%)
Ancestries Reported - Scotch-Irish (%)
Ancestries Reported - Scottish (%)
Ancestries Reported - Slovak (%)
Ancestries Reported - Subsaharan African (%)
Ancestries Reported - Swedish (%)
Ancestries Reported - Swiss (%)
Ancestries Reported - Ukrainian (%)
Ancestries Reported - United States (%)
Ancestries Reported - Welsh (%)
Ancestries Reported - West Indian (%)
Ancestries Reported - Other (%)
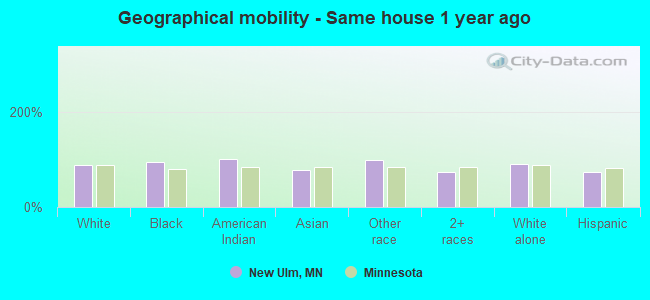
Geographical mobility - Same house 1 year ago (%)
Geographical mobility - Same house 1 year ago (%) - White
Geographical mobility - Same house 1 year ago (%) - Black or African American
Geographical mobility - Same house 1 year ago (%) - Asian
Geographical mobility - Same house 1 year ago (%) - Hispanic or Latino
Geographical mobility - Same house 1 year ago (%) - American Indian and Alaska Native
Geographical mobility - Same house 1 year ago (%) - Multirace
Geographical mobility - Same house 1 year ago (%) - Other Race
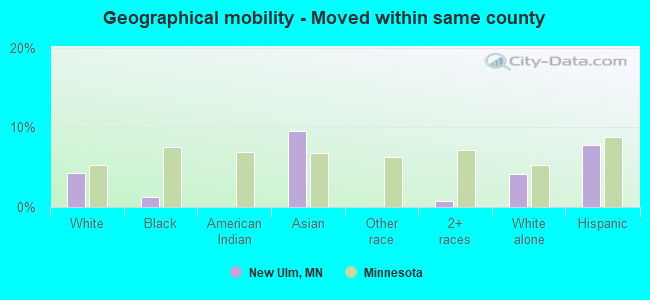
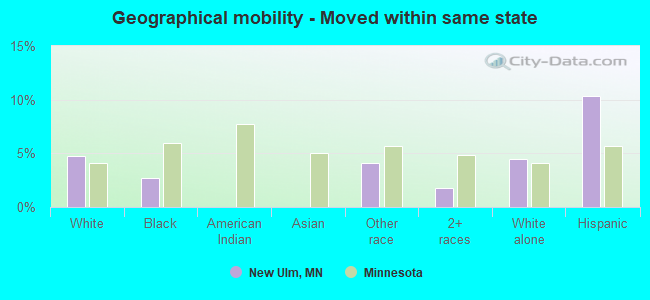
Geographical mobility - Moved within same county (%)
Geographical mobility - Moved within same county (%) - White
Geographical mobility - Moved within same county (%) - Black or African American
Geographical mobility - Moved within same county (%) - Asian
Geographical mobility - Moved within same county (%) - Hispanic or Latino
Geographical mobility - Moved within same county (%) - American Indian and Alaska Native
Geographical mobility - Moved within same county (%) - Multirace
Geographical mobility - Moved within same county (%) - Other Race
Geographical mobility - Moved from different county within same state (%)
Geographical mobility - Moved from different county within same state (%) - White
Geographical mobility - Moved from different county within same state (%) - Black or African American
Geographical mobility - Moved from different county within same state (%) - Asian
Geographical mobility - Moved from different county within same state (%) - Hispanic or Latino
Geographical mobility - Moved from different county within same state (%) - American Indian and Alaska Native
Geographical mobility - Moved from different county within same state (%) - Multirace
Geographical mobility - Moved from different county within same state (%) - Other Race
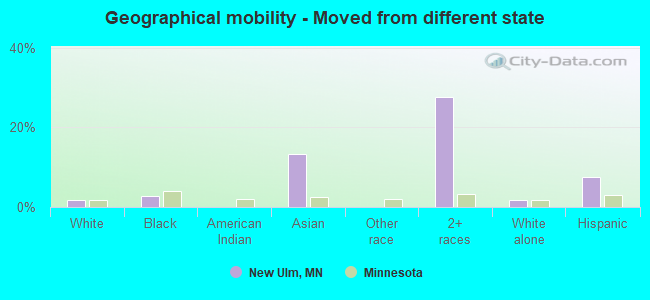
Geographical mobility - Moved from different state (%)
Geographical mobility - Moved from different state (%) - White
Geographical mobility - Moved from different state (%) - Black or African American
Geographical mobility - Moved from different state (%) - Asian
Geographical mobility - Moved from different state (%) - Hispanic or Latino
Geographical mobility - Moved from different state (%) - American Indian and Alaska Native
Geographical mobility - Moved from different state (%) - Multirace
Geographical mobility - Moved from different state (%) - Other Race
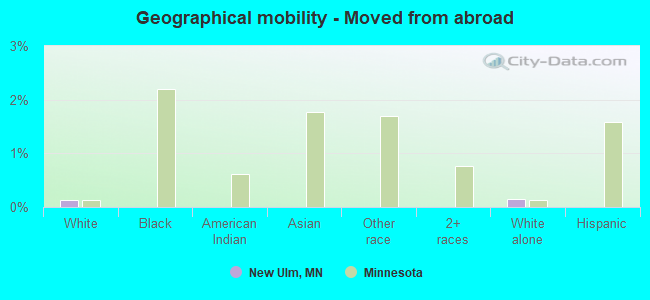
Geographical mobility - Moved from abroad (%)
Geographical mobility - Moved from abroad (%) - White
Geographical mobility - Moved from abroad (%) - Black or African American
Geographical mobility - Moved from abroad (%) - Asian
Geographical mobility - Moved from abroad (%) - Hispanic or Latino
Geographical mobility - Moved from abroad (%) - American Indian and Alaska Native
Geographical mobility - Moved from abroad (%) - Multirace
Geographical mobility - Moved from abroad (%) - Other Race
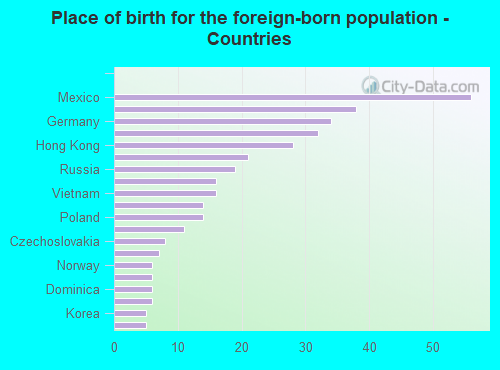
Place of birth for the foreign-born population - Ireland (%)
Place of birth for the foreign-born population - Denmark (%)
Place of birth for the foreign-born population - Norway (%)
Place of birth for the foreign-born population - Sweden (%)
Place of birth for the foreign-born population - United Kingdom (%)
Place of birth for the foreign-born population - England (%)
Place of birth for the foreign-born population - Scotland (%)
Place of birth for the foreign-born population - Other Northern Europe (%)
Place of birth for the foreign-born population - Austria (%)
Place of birth for the foreign-born population - Belgium (%)
Place of birth for the foreign-born population - France (%)
Place of birth for the foreign-born population - Germany (%)
Place of birth for the foreign-born population - Netherlands (%)
Place of birth for the foreign-born population - Switzerland (%)
Place of birth for the foreign-born population - Other Western Europe (%)
Place of birth for the foreign-born population - Greece (%)
Place of birth for the foreign-born population - Italy (%)
Place of birth for the foreign-born population - Portugal (%)
Place of birth for the foreign-born population - Spain (%)
Place of birth for the foreign-born population - Other Southern Europe (%)
Place of birth for the foreign-born population - Albania (%)
Place of birth for the foreign-born population - Belarus (%)
Place of birth for the foreign-born population - Bosnia and Herzegovina (%)
Place of birth for the foreign-born population - Bulgaria (%)
Place of birth for the foreign-born population - Croatia (%)
Place of birth for the foreign-born population - Czechoslovakia (%)
Place of birth for the foreign-born population - Hungary (%)
Place of birth for the foreign-born population - Latvia (%)
Place of birth for the foreign-born population - Lithuania (%)
Place of birth for the foreign-born population - North Macedonia (Macedonia) (%)
Place of birth for the foreign-born population - Moldova (%)
Place of birth for the foreign-born population - Poland (%)
Place of birth for the foreign-born population - Romania (%)
Place of birth for the foreign-born population - Russia (%)
Place of birth for the foreign-born population - Serbia (%)
Place of birth for the foreign-born population - Ukraine (%)
Place of birth for the foreign-born population - Other Eastern Europe (%)
Place of birth for the foreign-born population - China (%)
Place of birth for the foreign-born population - Hong Kong (%)
Place of birth for the foreign-born population - Taiwan (%)
Place of birth for the foreign-born population - Japan (%)
Place of birth for the foreign-born population - Korea (%)
Place of birth for the foreign-born population - Other Eastern Asia (%)
Place of birth for the foreign-born population - Afghanistan (%)
Place of birth for the foreign-born population - Bangladesh (%)
Place of birth for the foreign-born population - India (%)
Place of birth for the foreign-born population - Iran (%)
Place of birth for the foreign-born population - Kazakhstan (%)
Place of birth for the foreign-born population - Nepal (%)
Place of birth for the foreign-born population - Pakistan (%)
Place of birth for the foreign-born population - Sri Lanka (%)
Place of birth for the foreign-born population - Uzbekistan (%)
Place of birth for the foreign-born population - Other South Central Asia (%)
Place of birth for the foreign-born population - Burma (%)
Place of birth for the foreign-born population - Cambodia (%)
Place of birth for the foreign-born population - Indonesia (%)
Place of birth for the foreign-born population - Laos (%)
Place of birth for the foreign-born population - Malaysia (%)
Place of birth for the foreign-born population - Philippines (%)
Place of birth for the foreign-born population - Singapore (%)
Place of birth for the foreign-born population - Thailand (%)
Place of birth for the foreign-born population - Vietnam (%)
Place of birth for the foreign-born population - Other South Eastern Asia (%)
Place of birth for the foreign-born population - Armenia (%)
Place of birth for the foreign-born population - Iraq (%)
Place of birth for the foreign-born population - Israel (%)
Place of birth for the foreign-born population - Jordan (%)
Place of birth for the foreign-born population - Kuwait (%)
Place of birth for the foreign-born population - Lebanon (%)
Place of birth for the foreign-born population - Saudi Arabia (%)
Place of birth for the foreign-born population - Syria (%)
Place of birth for the foreign-born population - Turkey (%)
Place of birth for the foreign-born population - Yemen (%)
Place of birth for the foreign-born population - Other Western Asia (%)
Place of birth for the foreign-born population - Eritrea (%)
Place of birth for the foreign-born population - Ethiopia (%)
Place of birth for the foreign-born population - Kenya (%)
Place of birth for the foreign-born population - Somalia (%)
Place of birth for the foreign-born population - Uganda (%)
Place of birth for the foreign-born population - Zimbabwe (%)
Place of birth for the foreign-born population - Other Eastern Africa (%)
Place of birth for the foreign-born population - Cameroon (%)
Place of birth for the foreign-born population - Congo (%)
Place of birth for the foreign-born population - Democratic Republic of Congo (Zaire) (%)
Place of birth for the foreign-born population - Other Middle Africa (%)
Place of birth for the foreign-born population - Egypt (%)
Place of birth for the foreign-born population - Morocco (%)
Place of birth for the foreign-born population - Sudan (%)
Place of birth for the foreign-born population - Other Northern Africa (%)
Place of birth for the foreign-born population - South Africa (%)
Place of birth for the foreign-born population - Other Southern Africa (%)
Place of birth for the foreign-born population - Cabo Verde (%)
Place of birth for the foreign-born population - Ghana (%)
Place of birth for the foreign-born population - Liberia (%)
Place of birth for the foreign-born population - Nigeria (%)
Place of birth for the foreign-born population - Senegal (%)
Place of birth for the foreign-born population - Sierra Leone (%)
Place of birth for the foreign-born population - Other Western Africa (%)
Place of birth for the foreign-born population - Australia (%)
Place of birth for the foreign-born population - New Zealand (%)
Place of birth for the foreign-born population - Fiji (%)
Place of birth for the foreign-born population - Micronesia (%)
Place of birth for the foreign-born population - Bahamas (%)
Place of birth for the foreign-born population - Barbados (%)
Place of birth for the foreign-born population - Cuba (%)
Place of birth for the foreign-born population - Dominica (%)
Place of birth for the foreign-born population - Dominican Republic (%)
Place of birth for the foreign-born population - Grenada (%)
Place of birth for the foreign-born population - Haiti (%)
Place of birth for the foreign-born population - Jamaica (%)
Place of birth for the foreign-born population - St. Vincent and the Grenadines (%)
Place of birth for the foreign-born population - Trinidad and Tobago (%)
Place of birth for the foreign-born population - West Indies (%)
Place of birth for the foreign-born population - Other Caribbean (%)
Place of birth for the foreign-born population - Belize (%)
Place of birth for the foreign-born population - Costa Rica (%)
Place of birth for the foreign-born population - El Salvador (%)
Place of birth for the foreign-born population - Guatemala (%)
Place of birth for the foreign-born population - Honduras (%)
Place of birth for the foreign-born population - Mexico (%)
Place of birth for the foreign-born population - Nicaragua (%)
Place of birth for the foreign-born population - Panama (%)
Place of birth for the foreign-born population - Other Central America (%)
Place of birth for the foreign-born population - Argentina (%)
Place of birth for the foreign-born population - Bolivia (%)
Place of birth for the foreign-born population - Brazil (%)
Place of birth for the foreign-born population - Chile (%)
Place of birth for the foreign-born population - Colombia (%)
Place of birth for the foreign-born population - Ecuador (%)
Place of birth for the foreign-born population - Guyana (%)
Place of birth for the foreign-born population - Peru (%)
Place of birth for the foreign-born population - Uruguay (%)
Place of birth for the foreign-born population - Venezuela (%)
Place of birth for the foreign-born population - Other South America (%)
Place of birth for the foreign-born population - Canada (%)
Place of birth for the foreign-born population - Other Northern America (%)
Place of birth for the foreign-born population - Other (%)
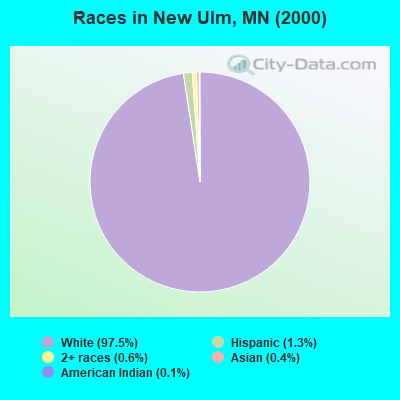
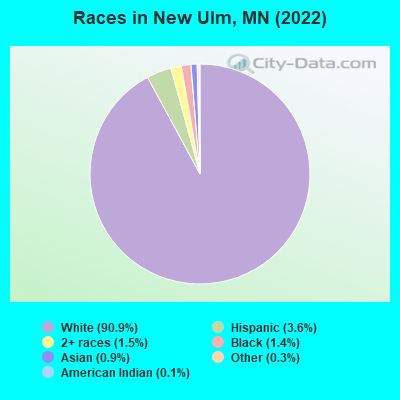
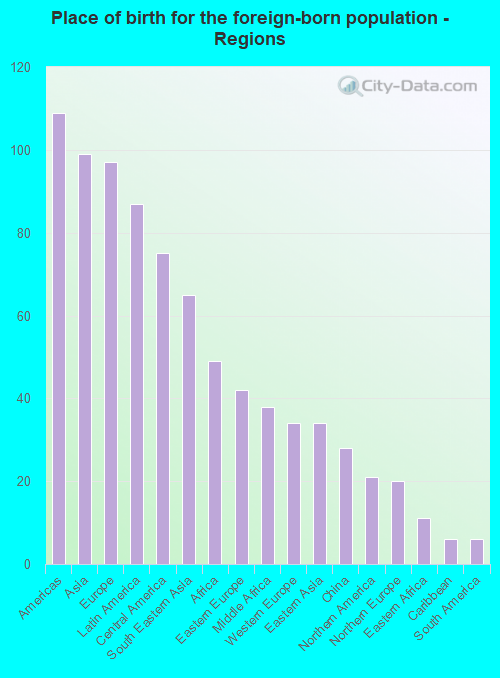
According to 2022 data, the most numerous races in New Ulm, MN are White alone (12,819 residents), Black alone (198 residents), and Hispanic (503 residents). 95.0% of New Ulm residents speak English at home. 2.5% of New Ulm, MN residents are foreign-born (0.7% born in Asia, 0.7% born in Europe, 0.6% born in Latin America, 0.3% born in Africa), which is 217.1% less than the foreign-born rate of 8.0% across the entire state of Minnesota.
Race distribution in New Ulm
2000 2022
4,337,143 88.2% White alone 168,813 3.4% Black alone 143,382 2.9% Hispanic 141,083 2.9% Asian alone 70,304 1.4% Two or more races 52,009 1.1% American Indian alone 5,031 0.1% Other race alone 1,714 0.03% Native Hawaiian and Other
4,356,347 76.2% White alone 395,179 6.9% Black alone 333,830 5.8% Hispanic 294,800 5.2% Asian alone 259,649 4.5% Two or more races 42,125 0.7% American Indian alone 32,976 0.6% Other race alone 2,278 0.04% Native Hawaiian and Other
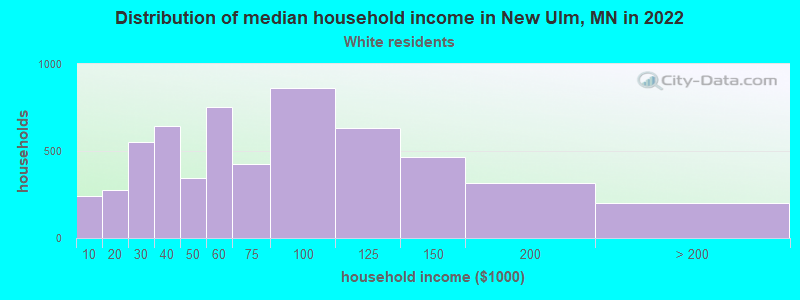
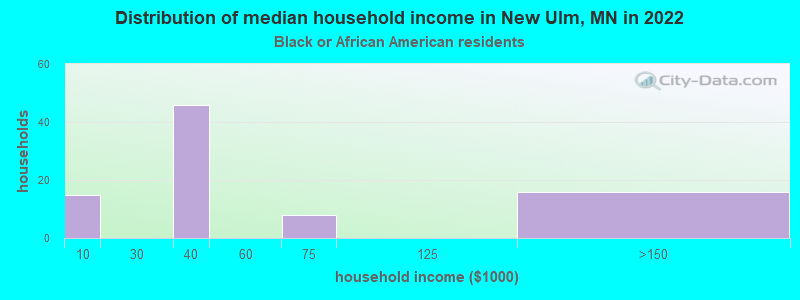
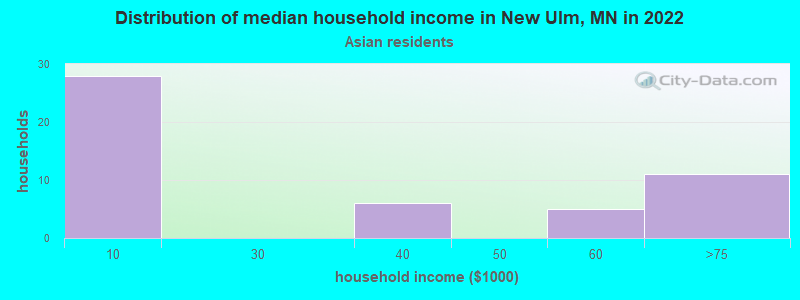
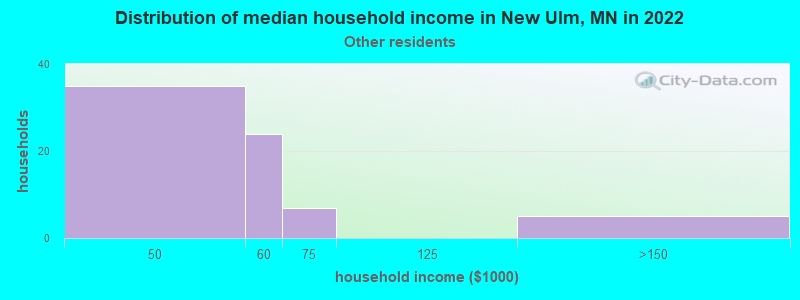
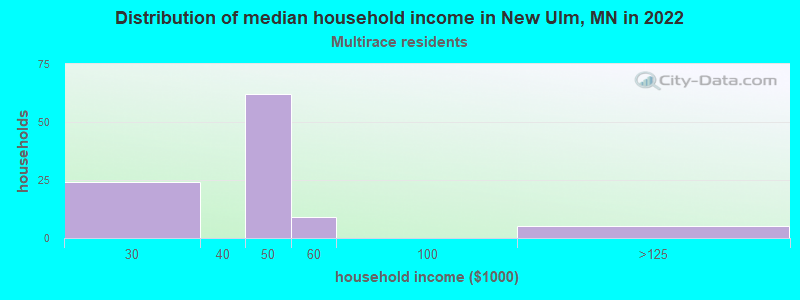
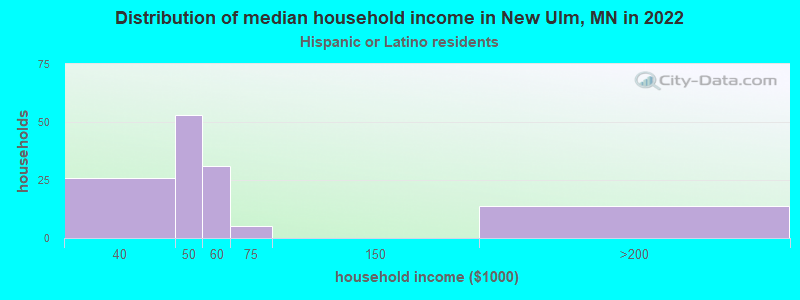
Income and house value in New Ulm Median household income in 2022 $60,581 White non-Hispanic householders$40,305 Black householders$2,391 Asian householders$47,732 Some other race householders$42,522 Two or more races householders$42,867 Hispanic or Latino race householdersMedian 2022 house value $192,935 White Non-Hispanic householders$241,975 Black or African American householders$161,317 American Indian or Alaska Native householders$118,299 Two or more races householders$195,086 Hispanic or Latino householders
Median age by race in New Ulm
40.5 Median age for White residents37.7 42.6 28.9 Median age for Black or African American residents22.2 46.7 28.9 Median age for American Indian / Alaska Native residents33.5 29.1 44.9 Median age for Asian residents36.0 55.1 -744,336,568.8 Median age for Native Hawaiian / Pacific Islander residents-856,799,036.4 -534,959,349.1 38.1 Median age for Other race residents34.5 43.2 31.2 Median age for Two or more races residents30.7 23.1 41.0 Median age for White alone residents38.1 42.7 27.3 Median age for Hispanic or Latino residents26.7 29.3
Owner/renter occupied households by race in New Ulm
House owners and renters - White residents 4,274 75.1% Owner occupied1,414 24.9% Renter occupiedHouse owners and renters - Black or African American residents 17 20.2% Owner occupied67 79.8% Renter occupiedHouse owners and renters - Asian residents 16 34.5% Owner occupied30 65.5% Renter occupiedHouse owners and renters - Other race residents 51 68.5% Owner occupied24 31.5% Renter occupiedHouse owners and renters - Two or more races residents 49 46.2% Owner occupied57 53.8% Renter occupiedHouse owners and renters - White alone residents 4,288 75.3% Owner occupied1,410 24.7% Renter occupiedHouse owners and renters - Hispanic or Latino residents 40 33.3% Owner occupied80 66.7% Renter occupied
Language usage in New Ulm
English speakers - Total 95.0% of residents of New Ulm speak English at home.
2.4% of residents speak Spanish at home 259 79.9% Speak English very well65 20.1% Speak English less than very well2.3% of residents speak other language at home 162 51.4% Speak English very well153 48.6% Speak English less than very well
English speakers - Born in the United States 92.1% of residents of New Ulm speak English at home.
6.1% of residents speak Spanish at home 178 100.0% Speak English very well1.6% of residents speak other language at home 15 33.3% Speak English very well30 66.7% Speak English less than very well
English speakers - Native, born elsewhere 96.2% of residents of New Ulm speak English at home.
English speakers - Foreign-born 35.1% of residents of New Ulm speak English at home.
21.1% of residents speak Spanish at home 42 56.0% Speak English very well33 44.0% Speak English less than very well41.9% of residents speak other language at home 50 33.6% Speak English very well99 66.4% Speak English less than very well
White (Caucasian) - Speak only English Native:
98.7% (12,022)Foreign-born:
68.1% (71)
White (Caucasian) - Speak another language Native:
1.5% (178)Foreign-born:
40.7% (43)
Black or African American - Speak another language Native:
4.5% (7)Foreign-born:
100.0% (47)
Asian - Speak only English Native:
40.6% (21)Foreign-born:
25.3% (21)
Asian - Speak another language Native:
59.1% (30)Foreign-born:
74.3% (60)
Other race - Speak only English Native:
25.5% (37)Foreign-born:
10.1% (7)
Other race - Speak another language Native:
71.2% (104)Foreign-born:
89.1% (64)
Two or more races - Speak only English Native:
79.7% (229)Foreign-born:
79.7% (28)
Two or more races - Speak another language Native:
19.9% (57)Foreign-born:
8.6% (3)
White alone - Speak only English Native:
98.7% (11,953)Foreign-born:
68.2% (75)
White alone - Speak another language Native:
1.4% (164)Foreign-born:
34.2% (38)
Hispanic or Latino - Speak another language Native:
54.9% (205)Foreign-born:
96.9% (79)
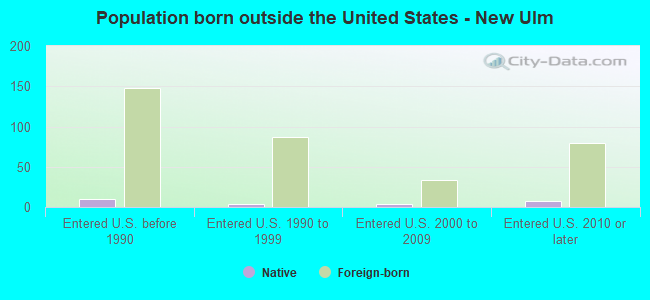
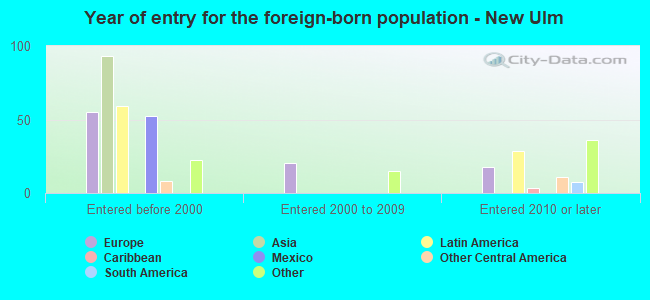
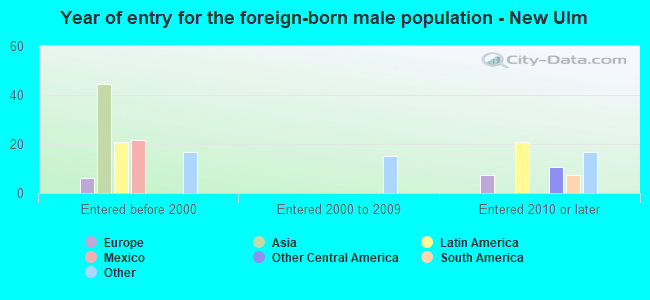
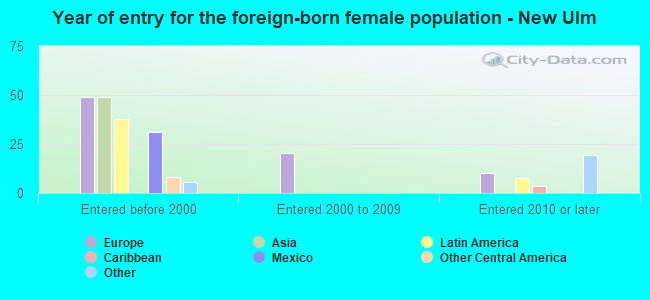
Foreign-born residents in New Ulm 356 residents are foreign born (0.7% Asia , 0.7% Europe , 0.6% Latin America , 0.3% Africa ).
This city:
2.5%Minnesota:
8.5%
Marital status for residents in New Ulm Marital status - White (Caucasian) population 15 years and over
Males 37.0% Never married50.3% Now married0.5% Separated2.9% Widowed9.3% DivorcedFemales 29.4% Never married46.4% Now married0.5% Separated11.4% Widowed12.4% DivorcedWomen who gave birth in the past 12 months Now married:
82.3% (112)Unmarried:
17.7% (24)
Women who did not give birth in the past 12 months Now married:
40.9% (1,113)Unmarried:
59.1% (1,610)
Marital status - Black or African American population 15 years and over
Males 38.2% Never married14.7% Now married0.0% Separated0.0% Widowed47.1% DivorcedFemales 63.2% Never married36.8% Now married0.0% Separated0.0% Widowed0.0% DivorcedWomen who did not give birth in the past 12 months Now married:
51.9% (14)Unmarried:
48.1% (13)
Marital status - American Indian / Alaska Native population 15 years and over
Males 100.0% Never married0.0% Now married0.0% Separated0.0% Widowed0.0% DivorcedFemales 0.0% Never married23.1% Now married0.0% Separated0.0% Widowed76.9% DivorcedWomen who did not give birth in the past 12 months Now married:
23.1% (9)Unmarried:
76.9% (31)
Marital status - Asian population 15 years and over
Males 44.4% Never married55.6% Now married0.0% Separated0.0% Widowed0.0% DivorcedFemales 34.0% Never married55.3% Now married2.1% Separated8.5% Widowed0.0% DivorcedWomen who did not give birth in the past 12 months Now married:
0.0% (0)Unmarried:
100.0% (16)
Marital status - Other race population 15 years and over
Males 33.9% Never married66.1% Now married0.0% Separated0.0% Widowed0.0% DivorcedFemales 31.6% Never married59.2% Now married0.0% Separated0.0% Widowed9.2% DivorcedWomen who did not give birth in the past 12 months Now married:
44.6% (33)Unmarried:
55.4% (41)
Marital status - Two or more races population 15 years and over
Males 51.6% Never married38.7% Now married3.2% Separated0.0% Widowed6.5% DivorcedFemales 74.0% Never married17.1% Now married0.0% Separated8.9% Widowed0.0% DivorcedWomen who gave birth in the past 12 months Now married:
0.0% (0)Unmarried:
100.0% (61)
Women who did not give birth in the past 12 months Now married:
0.0% (0)Unmarried:
100.0% (49)
Marital status - White alone, not Hispanic / Latino population 15 years and over
Males 36.5% Never married50.6% Now married0.5% Separated3.0% Widowed9.4% DivorcedFemales 29.2% Never married46.4% Now married0.5% Separated11.5% Widowed12.5% DivorcedWomen who gave birth in the past 12 months Now married:
82.3% (114)Unmarried:
17.7% (24)
Women who did not give birth in the past 12 months Now married:
41.0% (1,118)Unmarried:
59.0% (1,609)
Marital status - Hispanic or Latino population 15 years and over
Males 68.7% Never married30.1% Now married1.2% Separated0.0% Widowed0.0% DivorcedFemales 38.2% Never married37.6% Now married0.0% Separated2.2% Widowed21.9% DivorcedWomen who did not give birth in the past 12 months Now married:
27.4% (39)Unmarried:
72.6% (104)
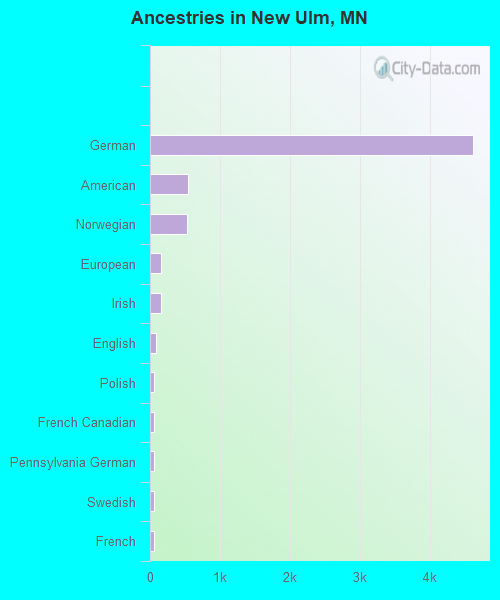
Ancestries in New Ulm
4,615 62.0% German539 7.2% American525 7.1% Norwegian164 2.2% European153 2.1% Irish80 1.1% English64 0.9% Polish59 0.8% French Canadian58 0.8% Pennsylvania German57 0.8% Swedish55 0.7% French38 0.5% Belgian38 0.5% Czech34 0.5% Portuguese34 0.5% Russian20 0.3% Finnish19 0.3% Hungarian16 0.2% Danish15 0.2% British15 0.2% Scandinavian12 0.2% Lebanese8 0.1% Dutch8 0.1% Eastern European7 0.09% Nigerian6 0.08% Italian6 0.08% Somali5 0.07% Scotch-Irish5 0.07% Ethiopian5 0.07% Swiss4 0.05% West Indian2 0.03% Moroccan
Children Nativity (place of birth) in New Ulm
Children under 6 years - Living with two parents Both parents native 604 100.0% NativeOne native, one foreign-born parent 10 100.0% NativeChildren under 6 years - Living with one parent Native parent 174 100.0% NativeForeign-born parent 9 100.0% NativeChildren 6 to 17 years - Living with two parents Both parents native 1,539 100.0% NativeOne native, one foreign-born parent 38 83.5% Native7 16.5% Foreign-bornChildren 6 to 17 years - Living with one parent Native parent 568 100.0% Native
Grandparents responsible for own grandchildren in New Ulm
Grandparents (30 to 59 years) White / Caucasian 4 41.6% Responsible for grandchildren6 58.4% Not responsible for grandchildrenWhite alone, not Hispanic / Latino 4 41.7% Responsible for grandchildren6 58.3% Not responsible for grandchildrenGrandparents (60 years and over) White / Caucasian 13 63.3% Responsible for grandchildren7 36.7% Not responsible for grandchildrenWhite alone, not Hispanic / Latino 13 63.6% Responsible for grandchildren8 36.4% Not responsible for grandchildren