Races in Newark, New Jersey (NJ) Detailed Stats
Data:
Races - White alone (%)
Races - White alone (% change since 2000)
Races - Black alone (%)
Races - Black alone (% change since 2000)
Races - American Indian alone (%)
Races - American Indian alone (% change since 2000)
Races - Asian alone (%)
Races - Asian alone (% change since 2000)
Races - Hispanic (%)
Races - Hispanic (% change since 2000)
Races - Native Hawaiian and Other Pacific Islander alone (%)
Races - Native Hawaiian and Other Pacific Islander alone (% change since 2000)
Races - Two or more races(%)
Races - Two or more races(% change since 2000)
Races - Other race alone (%)
Races - Other race alone (% change since 2000)
Racial diversity
Place of birth - Born in state of residence (%)
Place of birth - Born in state of residence (%) - White
Place of birth - Born in state of residence (%) - Black or African American
Place of birth - Born in state of residence (%) - Asian
Place of birth - Born in state of residence (%) - Hispanic or Latino
Place of birth - Born in state of residence (%) - American Indian and Alaska Native
Place of birth - Born in state of residence (%) - Multirace
Place of birth - Born in state of residence (%) - Other Race
Place of birth - Born in other state (%)
Place of birth - Born in other state (%) - White
Place of birth - Born in other state (%) - Black or African American
Place of birth - Born in other state (%) - Asian
Place of birth - Born in other state (%) - Hispanic or Latino
Place of birth - Born in other state (%) - American Indian and Alaska Native
Place of birth - Born in other state (%) - Multirace
Place of birth - Born in other state (%) - Other Race
Place of birth - Native, outside of US (%)
Place of birth - Native, outside of US (%) - White
Place of birth - Native, outside of US (%) - Black or African American
Place of birth - Native, outside of US (%) - Asian
Place of birth - Native, outside of US (%) - Hispanic or Latino
Place of birth - Native, outside of US (%) - American Indian and Alaska Native
Place of birth - Native, outside of US (%) - Multirace
Place of birth - Native, outside of US (%) - Other Race
Place of birth - Foreign born (%)
Place of birth - Foreign born (%) - White
Place of birth - Foreign born (%) - Black or African American
Place of birth - Foreign born (%) - Asian
Place of birth - Foreign born (%) - Hispanic or Latino
Place of birth - Foreign born (%) - American Indian and Alaska Native
Place of birth - Foreign born (%) - Multirace
Place of birth - Foreign born (%) - Other Race
Residents speaking English at home (%)
Residents speaking English at home - Born in the United States (%)
Residents speaking English at home - Native, born elsewhere (%)
Residents speaking English at home - Foreign born (%)
Residents speaking Spanish at home (%)
Residents speaking Spanish at home - Born in the United States (%)
Residents speaking Spanish at home - Native, born elsewhere (%)
Residents speaking Spanish at home - Foreign born (%)
Residents speaking other language at home (%)
Residents speaking other language at home - Born in the United States (%)
Residents speaking other language at home - Native, born elsewhere (%)
Residents speaking other language at home - Foreign born (%)
Marital status - Never married (%)
Marital status - Now married (%)
Marital status - Separated (%)
Marital status - Widowed (%)
Marital status - Divorced (%)
Ancestries Reported - Arab (%)
Ancestries Reported - Czech (%)
Ancestries Reported - Danish (%)
Ancestries Reported - Dutch (%)
Ancestries Reported - English (%)
Ancestries Reported - French (%)
Ancestries Reported - French Canadian (%)
Ancestries Reported - German (%)
Ancestries Reported - Greek (%)
Ancestries Reported - Hungarian (%)
Ancestries Reported - Irish (%)
Ancestries Reported - Italian (%)
Ancestries Reported - Lithuanian (%)
Ancestries Reported - Norwegian (%)
Ancestries Reported - Polish (%)
Ancestries Reported - Portuguese (%)
Ancestries Reported - Russian (%)
Ancestries Reported - Scotch-Irish (%)
Ancestries Reported - Scottish (%)
Ancestries Reported - Slovak (%)
Ancestries Reported - Subsaharan African (%)
Ancestries Reported - Swedish (%)
Ancestries Reported - Swiss (%)
Ancestries Reported - Ukrainian (%)
Ancestries Reported - United States (%)
Ancestries Reported - Welsh (%)
Ancestries Reported - West Indian (%)
Ancestries Reported - Other (%)
Geographical mobility - Same house 1 year ago (%)
Geographical mobility - Same house 1 year ago (%) - White
Geographical mobility - Same house 1 year ago (%) - Black or African American
Geographical mobility - Same house 1 year ago (%) - Asian
Geographical mobility - Same house 1 year ago (%) - Hispanic or Latino
Geographical mobility - Same house 1 year ago (%) - American Indian and Alaska Native
Geographical mobility - Same house 1 year ago (%) - Multirace
Geographical mobility - Same house 1 year ago (%) - Other Race
Geographical mobility - Moved within same county (%)
Geographical mobility - Moved within same county (%) - White
Geographical mobility - Moved within same county (%) - Black or African American
Geographical mobility - Moved within same county (%) - Asian
Geographical mobility - Moved within same county (%) - Hispanic or Latino
Geographical mobility - Moved within same county (%) - American Indian and Alaska Native
Geographical mobility - Moved within same county (%) - Multirace
Geographical mobility - Moved within same county (%) - Other Race
Geographical mobility - Moved from different county within same state (%)
Geographical mobility - Moved from different county within same state (%) - White
Geographical mobility - Moved from different county within same state (%) - Black or African American
Geographical mobility - Moved from different county within same state (%) - Asian
Geographical mobility - Moved from different county within same state (%) - Hispanic or Latino
Geographical mobility - Moved from different county within same state (%) - American Indian and Alaska Native
Geographical mobility - Moved from different county within same state (%) - Multirace
Geographical mobility - Moved from different county within same state (%) - Other Race
Geographical mobility - Moved from different state (%)
Geographical mobility - Moved from different state (%) - White
Geographical mobility - Moved from different state (%) - Black or African American
Geographical mobility - Moved from different state (%) - Asian
Geographical mobility - Moved from different state (%) - Hispanic or Latino
Geographical mobility - Moved from different state (%) - American Indian and Alaska Native
Geographical mobility - Moved from different state (%) - Multirace
Geographical mobility - Moved from different state (%) - Other Race
Geographical mobility - Moved from abroad (%)
Geographical mobility - Moved from abroad (%) - White
Geographical mobility - Moved from abroad (%) - Black or African American
Geographical mobility - Moved from abroad (%) - Asian
Geographical mobility - Moved from abroad (%) - Hispanic or Latino
Geographical mobility - Moved from abroad (%) - American Indian and Alaska Native
Geographical mobility - Moved from abroad (%) - Multirace
Geographical mobility - Moved from abroad (%) - Other Race
Place of birth for the foreign-born population - Ireland (%)
Place of birth for the foreign-born population - Denmark (%)
Place of birth for the foreign-born population - Norway (%)
Place of birth for the foreign-born population - Sweden (%)
Place of birth for the foreign-born population - United Kingdom (%)
Place of birth for the foreign-born population - England (%)
Place of birth for the foreign-born population - Scotland (%)
Place of birth for the foreign-born population - Other Northern Europe (%)
Place of birth for the foreign-born population - Austria (%)
Place of birth for the foreign-born population - Belgium (%)
Place of birth for the foreign-born population - France (%)
Place of birth for the foreign-born population - Germany (%)
Place of birth for the foreign-born population - Netherlands (%)
Place of birth for the foreign-born population - Switzerland (%)
Place of birth for the foreign-born population - Other Western Europe (%)
Place of birth for the foreign-born population - Greece (%)
Place of birth for the foreign-born population - Italy (%)
Place of birth for the foreign-born population - Portugal (%)
Place of birth for the foreign-born population - Spain (%)
Place of birth for the foreign-born population - Other Southern Europe (%)
Place of birth for the foreign-born population - Albania (%)
Place of birth for the foreign-born population - Belarus (%)
Place of birth for the foreign-born population - Bosnia and Herzegovina (%)
Place of birth for the foreign-born population - Bulgaria (%)
Place of birth for the foreign-born population - Croatia (%)
Place of birth for the foreign-born population - Czechoslovakia (%)
Place of birth for the foreign-born population - Hungary (%)
Place of birth for the foreign-born population - Latvia (%)
Place of birth for the foreign-born population - Lithuania (%)
Place of birth for the foreign-born population - North Macedonia (Macedonia) (%)
Place of birth for the foreign-born population - Moldova (%)
Place of birth for the foreign-born population - Poland (%)
Place of birth for the foreign-born population - Romania (%)
Place of birth for the foreign-born population - Russia (%)
Place of birth for the foreign-born population - Serbia (%)
Place of birth for the foreign-born population - Ukraine (%)
Place of birth for the foreign-born population - Other Eastern Europe (%)
Place of birth for the foreign-born population - China (%)
Place of birth for the foreign-born population - Hong Kong (%)
Place of birth for the foreign-born population - Taiwan (%)
Place of birth for the foreign-born population - Japan (%)
Place of birth for the foreign-born population - Korea (%)
Place of birth for the foreign-born population - Other Eastern Asia (%)
Place of birth for the foreign-born population - Afghanistan (%)
Place of birth for the foreign-born population - Bangladesh (%)
Place of birth for the foreign-born population - India (%)
Place of birth for the foreign-born population - Iran (%)
Place of birth for the foreign-born population - Kazakhstan (%)
Place of birth for the foreign-born population - Nepal (%)
Place of birth for the foreign-born population - Pakistan (%)
Place of birth for the foreign-born population - Sri Lanka (%)
Place of birth for the foreign-born population - Uzbekistan (%)
Place of birth for the foreign-born population - Other South Central Asia (%)
Place of birth for the foreign-born population - Burma (%)
Place of birth for the foreign-born population - Cambodia (%)
Place of birth for the foreign-born population - Indonesia (%)
Place of birth for the foreign-born population - Laos (%)
Place of birth for the foreign-born population - Malaysia (%)
Place of birth for the foreign-born population - Philippines (%)
Place of birth for the foreign-born population - Singapore (%)
Place of birth for the foreign-born population - Thailand (%)
Place of birth for the foreign-born population - Vietnam (%)
Place of birth for the foreign-born population - Other South Eastern Asia (%)
Place of birth for the foreign-born population - Armenia (%)
Place of birth for the foreign-born population - Iraq (%)
Place of birth for the foreign-born population - Israel (%)
Place of birth for the foreign-born population - Jordan (%)
Place of birth for the foreign-born population - Kuwait (%)
Place of birth for the foreign-born population - Lebanon (%)
Place of birth for the foreign-born population - Saudi Arabia (%)
Place of birth for the foreign-born population - Syria (%)
Place of birth for the foreign-born population - Turkey (%)
Place of birth for the foreign-born population - Yemen (%)
Place of birth for the foreign-born population - Other Western Asia (%)
Place of birth for the foreign-born population - Eritrea (%)
Place of birth for the foreign-born population - Ethiopia (%)
Place of birth for the foreign-born population - Kenya (%)
Place of birth for the foreign-born population - Somalia (%)
Place of birth for the foreign-born population - Uganda (%)
Place of birth for the foreign-born population - Zimbabwe (%)
Place of birth for the foreign-born population - Other Eastern Africa (%)
Place of birth for the foreign-born population - Cameroon (%)
Place of birth for the foreign-born population - Congo (%)
Place of birth for the foreign-born population - Democratic Republic of Congo (Zaire) (%)
Place of birth for the foreign-born population - Other Middle Africa (%)
Place of birth for the foreign-born population - Egypt (%)
Place of birth for the foreign-born population - Morocco (%)
Place of birth for the foreign-born population - Sudan (%)
Place of birth for the foreign-born population - Other Northern Africa (%)
Place of birth for the foreign-born population - South Africa (%)
Place of birth for the foreign-born population - Other Southern Africa (%)
Place of birth for the foreign-born population - Cabo Verde (%)
Place of birth for the foreign-born population - Ghana (%)
Place of birth for the foreign-born population - Liberia (%)
Place of birth for the foreign-born population - Nigeria (%)
Place of birth for the foreign-born population - Senegal (%)
Place of birth for the foreign-born population - Sierra Leone (%)
Place of birth for the foreign-born population - Other Western Africa (%)
Place of birth for the foreign-born population - Australia (%)
Place of birth for the foreign-born population - New Zealand (%)
Place of birth for the foreign-born population - Fiji (%)
Place of birth for the foreign-born population - Micronesia (%)
Place of birth for the foreign-born population - Bahamas (%)
Place of birth for the foreign-born population - Barbados (%)
Place of birth for the foreign-born population - Cuba (%)
Place of birth for the foreign-born population - Dominica (%)
Place of birth for the foreign-born population - Dominican Republic (%)
Place of birth for the foreign-born population - Grenada (%)
Place of birth for the foreign-born population - Haiti (%)
Place of birth for the foreign-born population - Jamaica (%)
Place of birth for the foreign-born population - St. Vincent and the Grenadines (%)
Place of birth for the foreign-born population - Trinidad and Tobago (%)
Place of birth for the foreign-born population - West Indies (%)
Place of birth for the foreign-born population - Other Caribbean (%)
Place of birth for the foreign-born population - Belize (%)
Place of birth for the foreign-born population - Costa Rica (%)
Place of birth for the foreign-born population - El Salvador (%)
Place of birth for the foreign-born population - Guatemala (%)
Place of birth for the foreign-born population - Honduras (%)
Place of birth for the foreign-born population - Mexico (%)
Place of birth for the foreign-born population - Nicaragua (%)
Place of birth for the foreign-born population - Panama (%)
Place of birth for the foreign-born population - Other Central America (%)
Place of birth for the foreign-born population - Argentina (%)
Place of birth for the foreign-born population - Bolivia (%)
Place of birth for the foreign-born population - Brazil (%)
Place of birth for the foreign-born population - Chile (%)
Place of birth for the foreign-born population - Colombia (%)
Place of birth for the foreign-born population - Ecuador (%)
Place of birth for the foreign-born population - Guyana (%)
Place of birth for the foreign-born population - Peru (%)
Place of birth for the foreign-born population - Uruguay (%)
Place of birth for the foreign-born population - Venezuela (%)
Place of birth for the foreign-born population - Other South America (%)
Place of birth for the foreign-born population - Canada (%)
Place of birth for the foreign-born population - Other Northern America (%)
Place of birth for the foreign-born population - Other (%)
Latest news about races in Newark, NJ collected exclusively by city-data.com from local newspapers, TV, and radio stations
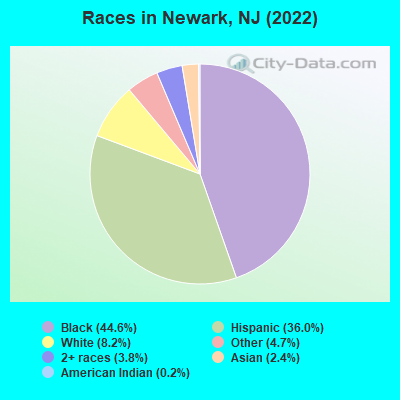
According to 2022 data, the most numerous races in Newark, NJ are White alone (25,125 residents), Hispanic (109,958 residents), and Black alone (136,049 residents). 52.6% of Newark residents speak English at home. 35.4% of Newark, NJ residents are foreign-born (24.3% born in Latin America, 5.5% born in Africa), which is 35.1% greater than the foreign-born rate of 23.0% across the entire state of New Jersey.
Race distribution in Newark
2000 2022
142,083 51.9% Black alone 80,622 29.5% Hispanic 38,950 14.2% White alone 6,121 2.2% Two or more races 3,138 1.1% Asian alone 2,034 0.7% Other race alone 529 0.2% American Indian alone 69 0.03% Native Hawaiian and Other
136,049 44.6% Black alone 109,958 36.0% Hispanic 25,125 8.2% White alone 14,473 4.7% Other race alone 11,577 3.8% Two or more races 7,436 2.4% Asian alone 721 0.2% American Indian alone
2000 2022
5,557,209 66.0% White alone 1,117,191 13.3% Hispanic 1,096,171 13.0% Black alone 477,012 5.7% Asian alone 133,689 1.6% Two or more races 19,565 0.2% Other race alone 11,338 0.1% American Indian alone 2,175 0.03% Native Hawaiian and Other
4,766,476 51.5% White alone 2,028,470 21.9% Hispanic 1,111,632 12.0% Black alone 923,546 10.0% Asian alone 332,237 3.6% Two or more races 89,847 1.0% Other race alone 8,557 0.09% American Indian alone 934 0.01% Native Hawaiian and Other
Income and house value in Newark Median household income in 2022 $72,873 White non-Hispanic householders$42,016 Black householders$59,903 American Indian and Alaska Native householders$45,929 Asian householders$52,249 Some other race householders$47,736 Two or more races householders$46,343 Hispanic or Latino race householdersMedian 2022 house value $362,715 White Non-Hispanic householders$289,237 Black or African American householders$142,801 American Indian or Alaska Native householders $318,057 Asian householders$318,057 Some other race householders$324,028 Two or more races householders$342,722 Hispanic or Latino householders
Median age by race in Newark
36.0 Median age for White residents35.4 36.7 35.8 Median age for Black or African American residents34.8 36.5 37.1 Median age for American Indian / Alaska Native residents38.0 18.9 31.5 Median age for Asian residents31.2 32.0 -666,666,666.0 Median age for Native Hawaiian / Pacific Islander residents-666,666,666.0 -666,666,666.0 31.7 Median age for Other race residents31.7 31.7 39.4 Median age for Two or more races residents36.5 42.2 42.2 Median age for White alone residents40.7 42.8 32.6 Median age for Hispanic or Latino residents31.9 33.0
Owner/renter occupied households by race in Newark
House owners and renters - White residents 5,501 43.2% Owner occupied7,244 56.8% Renter occupiedHouse owners and renters - Black or African American residents 14,915 26.9% Owner occupied40,508 73.1% Renter occupiedHouse owners and renters - American Indian / Alaska Native residents 107 15.2% Owner occupied594 84.8% Renter occupiedHouse owners and renters - Asian residents 1,053 31.6% Owner occupied2,281 68.4% Renter occupiedHouse owners and renters - Native Hawaiian / Pacific Islander residents 20 100.0% Renter occupiedHouse owners and renters - Other race residents 6,803 27.6% Owner occupied17,837 72.4% Renter occupiedHouse owners and renters - Two or more races residents 5,102 31.9% Owner occupied10,872 68.1% Renter occupiedHouse owners and renters - White alone residents 4,584 44.5% Owner occupied5,723 55.5% Renter occupiedHouse owners and renters - Hispanic or Latino residents 9,075 25.8% Owner occupied26,152 74.2% Renter occupied
Language usage in Newark
English speakers - Total 52.6% of residents of Newark speak English at home.
29.4% of residents speak Spanish at home 38,754 46.8% Speak English very well44,114 53.2% Speak English less than very well18.0% of residents speak other language at home 29,825 58.8% Speak English very well20,922 41.2% Speak English less than very well
English speakers - Born in the United States 84.9% of residents of Newark speak English at home.
7.2% of residents speak Spanish at home 1,960 79.4% Speak English very well509 20.6% Speak English less than very well7.9% of residents speak other language at home 2,690 100.0% Speak English very well
English speakers - Native, born elsewhere 24.7% of residents of Newark speak English at home.
71.7% of residents speak Spanish at home 5,233 45.8% Speak English very well6,205 54.2% Speak English less than very well3.6% of residents speak other language at home 581 100.0% Speak English very well
English speakers - Foreign-born 20.3% of residents of Newark speak English at home.
41.3% of residents speak Spanish at home 8,975 20.7% Speak English very well34,334 79.3% Speak English less than very well38.4% of residents speak other language at home 20,011 49.6% Speak English very well20,295 50.4% Speak English less than very well
White (Caucasian) - Speak only English Native:
52.1% (10,030)Foreign-born:
9.2% (1,171)
White (Caucasian) - Speak another language Native:
47.9% (9,205)Foreign-born:
90.8% (11,511)
Black or African American - Speak only English Native:
94.5% (96,092)Foreign-born:
41.1% (11,473)
Black or African American - Speak another language Native:
5.5% (5,605)Foreign-born:
58.9% (16,452)
American Indian / Alaska Native - Speak only English Native:
38.5% (366)Foreign-born:
3.2% (28)
American Indian / Alaska Native - Speak another language Native:
62.3% (592)Foreign-born:
95.1% (837)
Asian - Speak only English Native:
74.6% (1,693)Foreign-born:
19.3% (931)
Asian - Speak another language Native:
25.4% (576)Foreign-born:
80.7% (3,899)
Other race - Speak only English Native:
24.4% (7,122)Foreign-born:
10.9% (4,527)
Other race - Speak another language Native:
75.6% (22,113)Foreign-born:
89.1% (37,094)
Two or more races - Speak only English Native:
48.9% (11,693)Foreign-born:
18.9% (3,188)
Two or more races - Speak another language Native:
51.1% (12,232)Foreign-born:
81.1% (13,689)
White alone - Speak only English Native:
65.0% (8,375)Foreign-born:
9.4% (1,033)
White alone - Speak another language Native:
35.0% (4,516)Foreign-born:
90.6% (9,965)
Hispanic or Latino - Speak only English Native:
26.6% (13,687)Foreign-born:
8.9% (4,200)
Hispanic or Latino - Speak another language Native:
73.4% (37,852)Foreign-born:
91.1% (42,974)
Foreign-born residents in Newark 108,455 residents are foreign born (24.3% Latin America , 5.5% Africa ).
This city:
35.4%New Jersey:
23.2%
Marital status for residents in Newark Marital status - White (Caucasian) population 15 years and over
Males 43.7% Never married46.9% Now married2.6% Separated1.2% Widowed5.6% DivorcedFemales 38.4% Never married41.3% Now married3.7% Separated7.2% Widowed9.3% DivorcedWomen who gave birth in the past 12 months Now married:
100.0% (432)Unmarried:
0.0% (0)
Women who did not give birth in the past 12 months Now married:
34.5% (2,613)Unmarried:
65.5% (4,964)
Marital status - Black or African American population 15 years and over
Males 58.0% Never married25.5% Now married6.7% Separated0.9% Widowed8.9% DivorcedFemales 57.8% Never married20.6% Now married3.9% Separated8.4% Widowed9.2% DivorcedWomen who gave birth in the past 12 months Now married:
61.8% (920)Unmarried:
38.2% (568)
Women who did not give birth in the past 12 months Now married:
19.1% (6,780)Unmarried:
80.9% (28,678)
Marital status - American Indian / Alaska Native population 15 years and over
Males 38.4% Never married38.9% Now married0.0% Separated16.2% Widowed6.4% DivorcedFemales 45.2% Never married20.9% Now married9.3% Separated0.0% Widowed24.5% DivorcedWomen who did not give birth in the past 12 months Now married:
18.0% (99)Unmarried:
82.0% (449)
Marital status - Asian population 15 years and over
Males 49.3% Never married41.1% Now married1.0% Separated5.3% Widowed3.3% DivorcedFemales 45.6% Never married43.5% Now married0.6% Separated4.8% Widowed5.4% DivorcedWomen who gave birth in the past 12 months Now married:
94.8% (112)Unmarried:
5.2% (6)
Women who did not give birth in the past 12 months Now married:
39.7% (701)Unmarried:
60.3% (1,065)
Marital status - Native Hawaiian / Pacific Islander population 15 years and over
Males 100.0% Never married0.0% Now married0.0% Separated0.0% Widowed0.0% DivorcedFemales 0.0% Never married100.0% Now married0.0% Separated0.0% Widowed0.0% DivorcedWomen who did not give birth in the past 12 months Now married:
100.0% (72)Unmarried:
0.0% (0)
Marital status - Other race population 15 years and over
Males 45.3% Never married43.7% Now married1.8% Separated1.6% Widowed7.5% DivorcedFemales 43.2% Never married37.3% Now married3.3% Separated6.8% Widowed9.3% DivorcedWomen who gave birth in the past 12 months Now married:
74.6% (511)Unmarried:
25.4% (174)
Women who did not give birth in the past 12 months Now married:
37.2% (7,196)Unmarried:
62.8% (12,151)
Marital status - Two or more races population 15 years and over
Males 46.1% Never married38.6% Now married0.7% Separated4.0% Widowed10.6% DivorcedFemales 42.8% Never married39.2% Now married4.0% Separated4.9% Widowed9.2% DivorcedWomen who gave birth in the past 12 months Now married:
100.0% (633)Unmarried:
0.0% (0)
Women who did not give birth in the past 12 months Now married:
41.3% (4,352)Unmarried:
58.7% (6,197)
Marital status - White alone, not Hispanic / Latino population 15 years and over
Males 41.1% Never married48.3% Now married2.5% Separated1.5% Widowed6.7% DivorcedFemales 29.9% Never married48.7% Now married2.8% Separated10.0% Widowed8.6% DivorcedWomen who gave birth in the past 12 months Now married:
43.2% (167)Unmarried:
56.8% (219)
Women who did not give birth in the past 12 months Now married:
31.3% (1,929)Unmarried:
68.7% (4,235)
Marital status - Hispanic or Latino population 15 years and over
Males 48.2% Never married39.7% Now married2.4% Separated2.1% Widowed7.6% DivorcedFemales 45.7% Never married33.8% Now married5.0% Separated5.2% Widowed10.3% DivorcedWomen who gave birth in the past 12 months Now married:
87.7% (1,274)Unmarried:
12.3% (179)
Women who did not give birth in the past 12 months Now married:
32.4% (8,508)Unmarried:
67.6% (17,724)
Ancestries in Newark
14,190 6.3% Brazilian7,163 3.2% Portuguese5,914 2.6% Nigerian4,287 1.9% American4,254 1.9% African4,212 1.9% Haitian3,556 1.6% Jamaican3,021 1.3% Ghanaian2,263 1.0% Italian2,199 1.0% Guyanese1,239 0.6% Trinidadian and Tobagonian582 0.3% Irish514 0.2% Liberian439 0.2% West Indian403 0.2% British West Indian370 0.2% Polish355 0.2% Kenyan346 0.2% Senegalese304 0.1% German275 0.1% English258 0.1% Barbadian248 0.1% Cape Verdean241 0.1% European220 0.10% Greek193 0.09% Egyptian159 0.07% Ugandan154 0.07% Ukrainian124 0.06% Moroccan94 0.04% Russian90 0.04% Arab87 0.04% Iranian83 0.04% Palestinian83 0.04% Armenian69 0.03% Eastern European64 0.03% Lebanese59 0.03% Turkish57 0.03% Latvian52 0.02% British51 0.02% Iraqi50 0.02% French45 0.02% Hungarian42 0.02% Swedish37 0.02% Bahamian36 0.02% Scottish33 0.01% Ethiopian25 0.01% Dutch25 0.01% Canadian24 0.01% Belizean20 0.01% Israeli19 0.01% Jordanian19 0.01% Sierra Leonean16 0.01% New Zealander15 0.01% Afghan15 0.01% Sudanese14 0.01% Dutch West Indian13 0.01% Scandinavian13 0.01% South African12 0.01% Albanian
Geographical mobility in Newark Same house 1 year ago 31,900 93.8% White (Caucasian)127,419 92.3% Black or African American1,310 71.5% American Indian / Alaska Native5,522 85.7% Asian91 100.0% Native Hawaiian / Pacific Islander67,712 86.8% Other race39,613 89.0% Two or more races23,033 91.7% White alone, not Hispanic / Latino97,261 89.3% Hispanic or LatinoMoved within same county 796 2.3% White / Caucasian4,903 3.6% Black or African American638 34.8% American Indian / Alaska Native300 4.6% Asian5,724 7.3% Other race1,579 3.5% Two or more races796 3.2% White alone, not Hispanic / Latino7,228 6.6% Hispanic or LatinoMoved within same state 981 2.9% White / Caucasian3,726 2.7% Black or African American48 2.6% American Indian / Alaska Native474 7.4% Asian2,152 2.8% Other race2,135 4.8% Two or more races981 3.9% White alone, not Hispanic / Latino2,969 2.7% Hispanic or LatinoMoved from different state 254 0.7% White / Caucasian605 0.4% Black or African American47 0.7% Asian528 0.7% Other race731 1.6% Two or more races254 1.0% White alone, not Hispanic / Latino972 0.9% Hispanic or LatinoMoved from abroad 61 0.2% White1,394 1.0% Black or African American133 2.1% Asian1,907 2.4% Other race439 1.0% Two or more races61 0.2% White alone, not Hispanic / Latino459 0.4% Hispanic or Latino
Children Nativity (place of birth) in Newark
Children under 6 years - Living with two parents Both parents native 1,564 100.0% NativeBoth parents foreign-born 7,428 86.6% Native1,152 13.4% Foreign-bornOne native, one foreign-born parent 1,533 100.0% NativeChildren under 6 years - Living with one parent Native parent 8,542 100.0% NativeForeign-born parent 4,699 85.8% Native775 14.2% Foreign-bornChildren 6 to 17 years - Living with two parents Both parents native 2,504 100.0% NativeBoth parents foreign-born 12,882 85.3% Native2,228 14.7% Foreign-bornOne native, one foreign-born parent 3,009 100.0% NativeChildren 6 to 17 years - Living with one parent Native parent 11,864 100.0% NativeForeign-born parent 9,506 60.0% Native6,339 40.0% Foreign-born
Place of birth for residents in Newark 76,272 Americas75,961 Latin America41,000 South America24,816 Caribbean17,323 Africa14,031 Western Africa10,144 Central America9,790 Europe8,223 Southern Europe5,047 Asia2,647 South Central Asia1,115 Eastern Asia864 Eastern Africa835 Eastern Europe646 Western Asia638 South Eastern Asia543 China526 Middle Africa509 Northern Europe311 Northern America303 Northern Africa222 Western Europe29 Southern Africa20 Oceania20 Australia and New Zealand Subregion18,760 Ecuador13,513 Brazil12,907 Dominican Republic6,515 Nigeria6,385 Portugal4,692 Haiti3,861 Ghana3,355 Jamaica3,083 Guatemala2,946 Guyana2,602 Peru2,422 Mexico2,406 El Salvador1,637 Honduras1,594 Spain1,592 Trinidad and Tobago1,465 India1,237 Colombia1,154 Liberia963 Cuba630 Uruguay622 Kenya537 Bangladesh526 Venezuela502 Korea495 Philippines469 China455 Ivory Coast445 Pakistan400 Senegal396 Chile391 Togo354 Costa Rica301 United Kingdom277 Poland250 Canada235 Georgia227 Grenada203 Egypt190 Dominica187 Italy186 Barbados161 England156 Ukraine143 Argentina143 Congo140 Cameroon129 St. Vincent and the Grenadines124 Jordan119 Uganda104 Russia103 Azores Islands100 United Arab Emirates96 Lebanon95 Iran91 Belize76 Germany75 Panama75 Sierra Leone72 Nicaragua69 Japan62 Morocco59 France58 Cabo Verde56 Romania55 Greece52 Sri Lanka50 Vietnam49 Belgium48 Taiwan46 Albania43 Kuwait36 Turkey36 Netherlands34 Thailand32 Sudan31 St. Lucia30 Belarus30 Hungary29 South Africa25 Hong Kong24 Indonesia23 Bolivia22 Bahamas20 Cambodia20 Latvia18 Scotland16 Ethiopia16 Denmark15 New Zealand13 Malaysia12 Democratic Republic of Congo (Zaire)11 Somalia10 Afghanistan9 Israel6 Algeria6 Serbia5 Australia4 Bosnia and Herzegovina2 Sweden2 Croatia2 Nepal
Grandparents responsible for own grandchildren in Newark
Grandparents (30 to 59 years) White / Caucasian 29 11.0% Responsible for grandchildren235 89.0% Not responsible for grandchildrenBlack or African American 981 63.2% Responsible for grandchildren571 36.8% Not responsible for grandchildrenAsian 25 100.0% Not responsible for grandchildrenOther race 264 47.8% Responsible for grandchildren288 52.2% Not responsible for grandchildrenTwo or more races 373 62.4% Responsible for grandchildren224 37.6% Not responsible for grandchildrenWhite alone, not Hispanic / Latino 34 100.0% Not responsible for grandchildrenHispanic or Latino 472 41.4% Responsible for grandchildren668 58.6% Not responsible for grandchildrenGrandparents (60 years and over) White / Caucasian 141 30.0% Responsible for grandchildren329 70.0% Not responsible for grandchildrenBlack or African American 467 31.9% Responsible for grandchildren996 68.1% Not responsible for grandchildrenAsian 79 100.0% Not responsible for grandchildrenOther race 212 26.1% Responsible for grandchildren602 73.9% Not responsible for grandchildrenTwo or more races 29 5.0% Responsible for grandchildren561 95.0% Not responsible for grandchildrenWhite alone, not Hispanic / Latino 79 74.5% Responsible for grandchildren27 25.5% Not responsible for grandchildrenHispanic or Latino 246 14.7% Responsible for grandchildren1,433 85.3% Not responsible for grandchildren