Races in Nicoma Park, Oklahoma (OK) Detailed Stats
Data:
Races - White alone (%)
Races - White alone (% change since 2000)
Races - Black alone (%)
Races - Black alone (% change since 2000)
Races - American Indian alone (%)
Races - American Indian alone (% change since 2000)
Races - Asian alone (%)
Races - Asian alone (% change since 2000)
Races - Hispanic (%)
Races - Hispanic (% change since 2000)
Races - Native Hawaiian and Other Pacific Islander alone (%)
Races - Native Hawaiian and Other Pacific Islander alone (% change since 2000)
Races - Two or more races(%)
Races - Two or more races(% change since 2000)
Races - Other race alone (%)
Races - Other race alone (% change since 2000)
Racial diversity
Place of birth - Born in state of residence (%)
Place of birth - Born in state of residence (%) - White
Place of birth - Born in state of residence (%) - Black or African American
Place of birth - Born in state of residence (%) - Asian
Place of birth - Born in state of residence (%) - Hispanic or Latino
Place of birth - Born in state of residence (%) - American Indian and Alaska Native
Place of birth - Born in state of residence (%) - Multirace
Place of birth - Born in state of residence (%) - Other Race
Place of birth - Born in other state (%)
Place of birth - Born in other state (%) - White
Place of birth - Born in other state (%) - Black or African American
Place of birth - Born in other state (%) - Asian
Place of birth - Born in other state (%) - Hispanic or Latino
Place of birth - Born in other state (%) - American Indian and Alaska Native
Place of birth - Born in other state (%) - Multirace
Place of birth - Born in other state (%) - Other Race
Place of birth - Native, outside of US (%)
Place of birth - Native, outside of US (%) - White
Place of birth - Native, outside of US (%) - Black or African American
Place of birth - Native, outside of US (%) - Asian
Place of birth - Native, outside of US (%) - Hispanic or Latino
Place of birth - Native, outside of US (%) - American Indian and Alaska Native
Place of birth - Native, outside of US (%) - Multirace
Place of birth - Native, outside of US (%) - Other Race
Place of birth - Foreign born (%)
Place of birth - Foreign born (%) - White
Place of birth - Foreign born (%) - Black or African American
Place of birth - Foreign born (%) - Asian
Place of birth - Foreign born (%) - Hispanic or Latino
Place of birth - Foreign born (%) - American Indian and Alaska Native
Place of birth - Foreign born (%) - Multirace
Place of birth - Foreign born (%) - Other Race
Residents speaking English at home (%)
Residents speaking English at home - Born in the United States (%)
Residents speaking English at home - Native, born elsewhere (%)
Residents speaking English at home - Foreign born (%)
Residents speaking Spanish at home (%)
Residents speaking Spanish at home - Born in the United States (%)
Residents speaking Spanish at home - Native, born elsewhere (%)
Residents speaking Spanish at home - Foreign born (%)
Residents speaking other language at home (%)
Residents speaking other language at home - Born in the United States (%)
Residents speaking other language at home - Native, born elsewhere (%)
Residents speaking other language at home - Foreign born (%)
Marital status - Never married (%)
Marital status - Now married (%)
Marital status - Separated (%)
Marital status - Widowed (%)
Marital status - Divorced (%)
Ancestries Reported - Arab (%)
Ancestries Reported - Czech (%)
Ancestries Reported - Danish (%)
Ancestries Reported - Dutch (%)
Ancestries Reported - English (%)
Ancestries Reported - French (%)
Ancestries Reported - French Canadian (%)
Ancestries Reported - German (%)
Ancestries Reported - Greek (%)
Ancestries Reported - Hungarian (%)
Ancestries Reported - Irish (%)
Ancestries Reported - Italian (%)
Ancestries Reported - Lithuanian (%)
Ancestries Reported - Norwegian (%)
Ancestries Reported - Polish (%)
Ancestries Reported - Portuguese (%)
Ancestries Reported - Russian (%)
Ancestries Reported - Scotch-Irish (%)
Ancestries Reported - Scottish (%)
Ancestries Reported - Slovak (%)
Ancestries Reported - Subsaharan African (%)
Ancestries Reported - Swedish (%)
Ancestries Reported - Swiss (%)
Ancestries Reported - Ukrainian (%)
Ancestries Reported - United States (%)
Ancestries Reported - Welsh (%)
Ancestries Reported - West Indian (%)
Ancestries Reported - Other (%)
Geographical mobility - Same house 1 year ago (%)
Geographical mobility - Same house 1 year ago (%) - White
Geographical mobility - Same house 1 year ago (%) - Black or African American
Geographical mobility - Same house 1 year ago (%) - Asian
Geographical mobility - Same house 1 year ago (%) - Hispanic or Latino
Geographical mobility - Same house 1 year ago (%) - American Indian and Alaska Native
Geographical mobility - Same house 1 year ago (%) - Multirace
Geographical mobility - Same house 1 year ago (%) - Other Race
Geographical mobility - Moved within same county (%)
Geographical mobility - Moved within same county (%) - White
Geographical mobility - Moved within same county (%) - Black or African American
Geographical mobility - Moved within same county (%) - Asian
Geographical mobility - Moved within same county (%) - Hispanic or Latino
Geographical mobility - Moved within same county (%) - American Indian and Alaska Native
Geographical mobility - Moved within same county (%) - Multirace
Geographical mobility - Moved within same county (%) - Other Race
Geographical mobility - Moved from different county within same state (%)
Geographical mobility - Moved from different county within same state (%) - White
Geographical mobility - Moved from different county within same state (%) - Black or African American
Geographical mobility - Moved from different county within same state (%) - Asian
Geographical mobility - Moved from different county within same state (%) - Hispanic or Latino
Geographical mobility - Moved from different county within same state (%) - American Indian and Alaska Native
Geographical mobility - Moved from different county within same state (%) - Multirace
Geographical mobility - Moved from different county within same state (%) - Other Race
Geographical mobility - Moved from different state (%)
Geographical mobility - Moved from different state (%) - White
Geographical mobility - Moved from different state (%) - Black or African American
Geographical mobility - Moved from different state (%) - Asian
Geographical mobility - Moved from different state (%) - Hispanic or Latino
Geographical mobility - Moved from different state (%) - American Indian and Alaska Native
Geographical mobility - Moved from different state (%) - Multirace
Geographical mobility - Moved from different state (%) - Other Race
Geographical mobility - Moved from abroad (%)
Geographical mobility - Moved from abroad (%) - White
Geographical mobility - Moved from abroad (%) - Black or African American
Geographical mobility - Moved from abroad (%) - Asian
Geographical mobility - Moved from abroad (%) - Hispanic or Latino
Geographical mobility - Moved from abroad (%) - American Indian and Alaska Native
Geographical mobility - Moved from abroad (%) - Multirace
Geographical mobility - Moved from abroad (%) - Other Race
Place of birth for the foreign-born population - Ireland (%)
Place of birth for the foreign-born population - Denmark (%)
Place of birth for the foreign-born population - Norway (%)
Place of birth for the foreign-born population - Sweden (%)
Place of birth for the foreign-born population - United Kingdom (%)
Place of birth for the foreign-born population - England (%)
Place of birth for the foreign-born population - Scotland (%)
Place of birth for the foreign-born population - Other Northern Europe (%)
Place of birth for the foreign-born population - Austria (%)
Place of birth for the foreign-born population - Belgium (%)
Place of birth for the foreign-born population - France (%)
Place of birth for the foreign-born population - Germany (%)
Place of birth for the foreign-born population - Netherlands (%)
Place of birth for the foreign-born population - Switzerland (%)
Place of birth for the foreign-born population - Other Western Europe (%)
Place of birth for the foreign-born population - Greece (%)
Place of birth for the foreign-born population - Italy (%)
Place of birth for the foreign-born population - Portugal (%)
Place of birth for the foreign-born population - Spain (%)
Place of birth for the foreign-born population - Other Southern Europe (%)
Place of birth for the foreign-born population - Albania (%)
Place of birth for the foreign-born population - Belarus (%)
Place of birth for the foreign-born population - Bosnia and Herzegovina (%)
Place of birth for the foreign-born population - Bulgaria (%)
Place of birth for the foreign-born population - Croatia (%)
Place of birth for the foreign-born population - Czechoslovakia (%)
Place of birth for the foreign-born population - Hungary (%)
Place of birth for the foreign-born population - Latvia (%)
Place of birth for the foreign-born population - Lithuania (%)
Place of birth for the foreign-born population - North Macedonia (Macedonia) (%)
Place of birth for the foreign-born population - Moldova (%)
Place of birth for the foreign-born population - Poland (%)
Place of birth for the foreign-born population - Romania (%)
Place of birth for the foreign-born population - Russia (%)
Place of birth for the foreign-born population - Serbia (%)
Place of birth for the foreign-born population - Ukraine (%)
Place of birth for the foreign-born population - Other Eastern Europe (%)
Place of birth for the foreign-born population - China (%)
Place of birth for the foreign-born population - Hong Kong (%)
Place of birth for the foreign-born population - Taiwan (%)
Place of birth for the foreign-born population - Japan (%)
Place of birth for the foreign-born population - Korea (%)
Place of birth for the foreign-born population - Other Eastern Asia (%)
Place of birth for the foreign-born population - Afghanistan (%)
Place of birth for the foreign-born population - Bangladesh (%)
Place of birth for the foreign-born population - India (%)
Place of birth for the foreign-born population - Iran (%)
Place of birth for the foreign-born population - Kazakhstan (%)
Place of birth for the foreign-born population - Nepal (%)
Place of birth for the foreign-born population - Pakistan (%)
Place of birth for the foreign-born population - Sri Lanka (%)
Place of birth for the foreign-born population - Uzbekistan (%)
Place of birth for the foreign-born population - Other South Central Asia (%)
Place of birth for the foreign-born population - Burma (%)
Place of birth for the foreign-born population - Cambodia (%)
Place of birth for the foreign-born population - Indonesia (%)
Place of birth for the foreign-born population - Laos (%)
Place of birth for the foreign-born population - Malaysia (%)
Place of birth for the foreign-born population - Philippines (%)
Place of birth for the foreign-born population - Singapore (%)
Place of birth for the foreign-born population - Thailand (%)
Place of birth for the foreign-born population - Vietnam (%)
Place of birth for the foreign-born population - Other South Eastern Asia (%)
Place of birth for the foreign-born population - Armenia (%)
Place of birth for the foreign-born population - Iraq (%)
Place of birth for the foreign-born population - Israel (%)
Place of birth for the foreign-born population - Jordan (%)
Place of birth for the foreign-born population - Kuwait (%)
Place of birth for the foreign-born population - Lebanon (%)
Place of birth for the foreign-born population - Saudi Arabia (%)
Place of birth for the foreign-born population - Syria (%)
Place of birth for the foreign-born population - Turkey (%)
Place of birth for the foreign-born population - Yemen (%)
Place of birth for the foreign-born population - Other Western Asia (%)
Place of birth for the foreign-born population - Eritrea (%)
Place of birth for the foreign-born population - Ethiopia (%)
Place of birth for the foreign-born population - Kenya (%)
Place of birth for the foreign-born population - Somalia (%)
Place of birth for the foreign-born population - Uganda (%)
Place of birth for the foreign-born population - Zimbabwe (%)
Place of birth for the foreign-born population - Other Eastern Africa (%)
Place of birth for the foreign-born population - Cameroon (%)
Place of birth for the foreign-born population - Congo (%)
Place of birth for the foreign-born population - Democratic Republic of Congo (Zaire) (%)
Place of birth for the foreign-born population - Other Middle Africa (%)
Place of birth for the foreign-born population - Egypt (%)
Place of birth for the foreign-born population - Morocco (%)
Place of birth for the foreign-born population - Sudan (%)
Place of birth for the foreign-born population - Other Northern Africa (%)
Place of birth for the foreign-born population - South Africa (%)
Place of birth for the foreign-born population - Other Southern Africa (%)
Place of birth for the foreign-born population - Cabo Verde (%)
Place of birth for the foreign-born population - Ghana (%)
Place of birth for the foreign-born population - Liberia (%)
Place of birth for the foreign-born population - Nigeria (%)
Place of birth for the foreign-born population - Senegal (%)
Place of birth for the foreign-born population - Sierra Leone (%)
Place of birth for the foreign-born population - Other Western Africa (%)
Place of birth for the foreign-born population - Australia (%)
Place of birth for the foreign-born population - New Zealand (%)
Place of birth for the foreign-born population - Fiji (%)
Place of birth for the foreign-born population - Micronesia (%)
Place of birth for the foreign-born population - Bahamas (%)
Place of birth for the foreign-born population - Barbados (%)
Place of birth for the foreign-born population - Cuba (%)
Place of birth for the foreign-born population - Dominica (%)
Place of birth for the foreign-born population - Dominican Republic (%)
Place of birth for the foreign-born population - Grenada (%)
Place of birth for the foreign-born population - Haiti (%)
Place of birth for the foreign-born population - Jamaica (%)
Place of birth for the foreign-born population - St. Vincent and the Grenadines (%)
Place of birth for the foreign-born population - Trinidad and Tobago (%)
Place of birth for the foreign-born population - West Indies (%)
Place of birth for the foreign-born population - Other Caribbean (%)
Place of birth for the foreign-born population - Belize (%)
Place of birth for the foreign-born population - Costa Rica (%)
Place of birth for the foreign-born population - El Salvador (%)
Place of birth for the foreign-born population - Guatemala (%)
Place of birth for the foreign-born population - Honduras (%)
Place of birth for the foreign-born population - Mexico (%)
Place of birth for the foreign-born population - Nicaragua (%)
Place of birth for the foreign-born population - Panama (%)
Place of birth for the foreign-born population - Other Central America (%)
Place of birth for the foreign-born population - Argentina (%)
Place of birth for the foreign-born population - Bolivia (%)
Place of birth for the foreign-born population - Brazil (%)
Place of birth for the foreign-born population - Chile (%)
Place of birth for the foreign-born population - Colombia (%)
Place of birth for the foreign-born population - Ecuador (%)
Place of birth for the foreign-born population - Guyana (%)
Place of birth for the foreign-born population - Peru (%)
Place of birth for the foreign-born population - Uruguay (%)
Place of birth for the foreign-born population - Venezuela (%)
Place of birth for the foreign-born population - Other South America (%)
Place of birth for the foreign-born population - Canada (%)
Place of birth for the foreign-born population - Other Northern America (%)
Place of birth for the foreign-born population - Other (%)
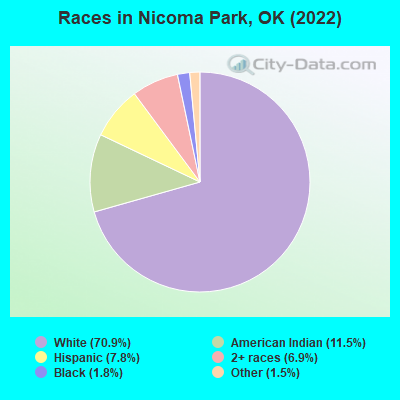
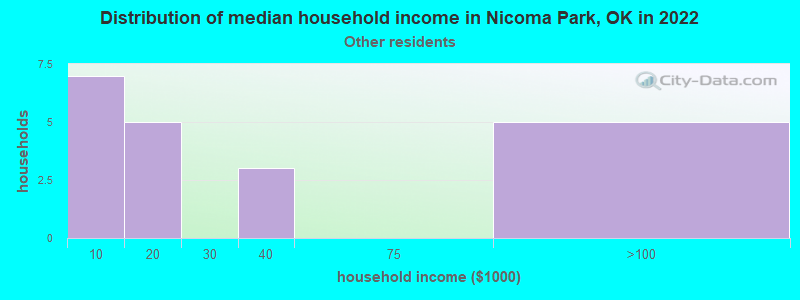
According to 2022 data, the most numerous races in Nicoma Park, OK are White alone (1,817 residents), Hispanic (199 residents), and Two or more races (177 residents). 96.4% of Nicoma Park residents speak English at home. 1.1% of Nicoma Park, OK residents are foreign-born , which is 449.4% less than the foreign-born rate of 6.0% across the entire state of Oklahoma.
Race distribution in Nicoma Park
2000 2022
2,556,368 74.1% White alone 266,158 7.7% American Indian alone 257,981 7.5% Black alone 179,304 5.2% Hispanic 140,249 4.1% Two or more races 46,172 1.3% Asian alone 2,322 0.07% Other race alone 2,100 0.06% Native Hawaiian and Other
2,517,403 62.6% White alone 486,692 12.1% Hispanic 364,453 9.1% Two or more races 273,650 6.8% American Indian alone 268,543 6.7% Black alone 92,672 2.3% Asian alone 10,786 0.3% Other race alone 5,601 0.1% Native Hawaiian and Other
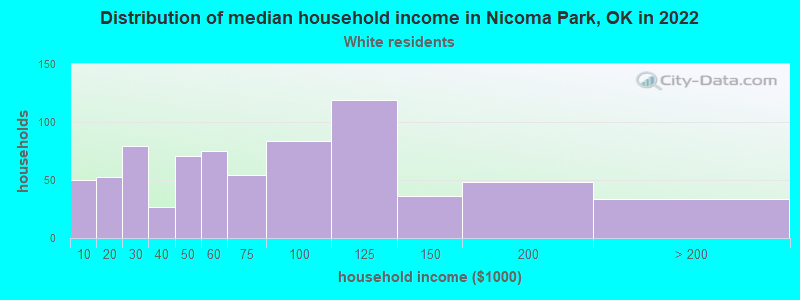
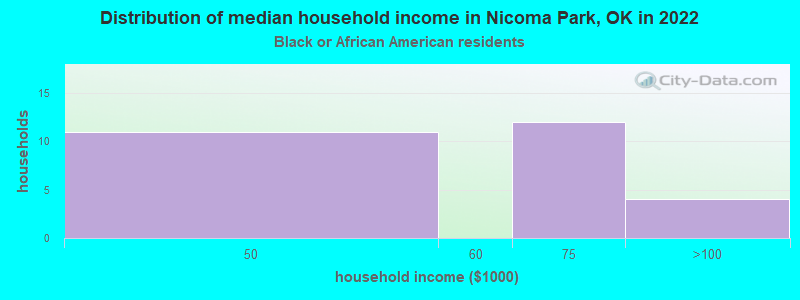
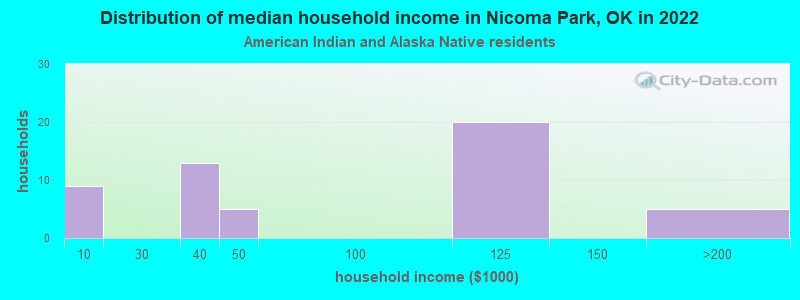
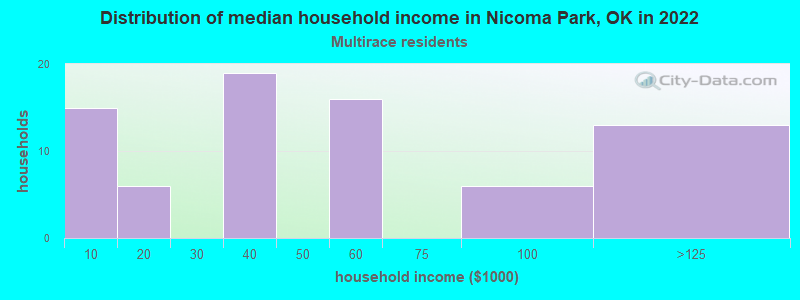
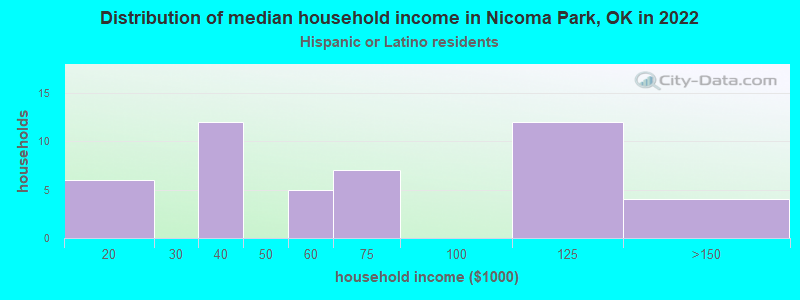
Income and house value in Nicoma Park Median household income in 2022 $60,127 White non-Hispanic householders$64,367 Black householders$114,597 American Indian and Alaska Native householders$39,039 Two or more races householders$53,360 Hispanic or Latino race householdersMedian 2022 house value $171,091 White Non-Hispanic householders$182,413 Black or African American householders$163,543 American Indian or Alaska Native householders$239,025 Some other race householders$94,352 Two or more races householders$147,943 Hispanic or Latino householders
Median age by race in Nicoma Park
39.0 Median age for White residents39.4 38.3 40.1 Median age for Black or African American residents37.6 -668,593,448.3 20.1 Median age for American Indian / Alaska Native residents10.8 36.5 -647,111,110.5 Median age for Asian residents-610,354,222.8 -682,291,666.0 -725,225,224.5 Median age for Native Hawaiian / Pacific Islander residents-675,324,674.6 -767,251,461.2 40.0 Median age for Other race residents18.3 40.3 19.2 Median age for Two or more races residents14.7 21.4 39.6 Median age for White alone residents39.9 38.5 13.1 Median age for Hispanic or Latino residents23.8 10.6
Owner/renter occupied households by race in Nicoma Park
House owners and renters - White residents 578 78.1% Owner occupied162 21.9% Renter occupiedHouse owners and renters - Black or African American residents 14 66.0% Owner occupied7 34.0% Renter occupiedHouse owners and renters - American Indian / Alaska Native residents 42 86.1% Owner occupied7 13.9% Renter occupiedHouse owners and renters - Other race residents 16 74.4% Owner occupied6 25.6% Renter occupiedHouse owners and renters - Two or more races residents 37 51.9% Owner occupied35 48.1% Renter occupiedHouse owners and renters - White alone residents 583 77.4% Owner occupied170 22.6% Renter occupiedHouse owners and renters - Hispanic or Latino residents 23 51.2% Owner occupied22 48.8% Renter occupied
Language usage in Nicoma Park
English speakers - Total 96.4% of residents of Nicoma Park speak English at home.
3.0% of residents speak Spanish at home 48 65.8% Speak English very well25 34.2% Speak English less than very well0.2% of residents speak other language at home 5 100.0% Speak English very well
English speakers - Born in the United States 93.0% of residents of Nicoma Park speak English at home.
6.1% of residents speak Spanish at home 33 89.2% Speak English very well4 10.8% Speak English less than very well0.8% of residents speak other language at home 5 100.0% Speak English very well
English speakers - Native, born elsewhere 89.3% of residents of Nicoma Park speak English at home.
English speakers - Foreign-born 27.6% of residents of Nicoma Park speak English at home.
65.5% of residents speak Spanish at home 5 26.3% Speak English very well14 73.7% Speak English less than very well
White (Caucasian) - Speak only English Native:
100.0% (1,708)Foreign-born:
62.2% (8)
White (Caucasian) - Speak another language Native:
0.6% (10)Foreign-born:
74.5% (9)
White alone - Speak only English Native:
99.7% (1,726)Foreign-born:
100.0% (8)
Hispanic or Latino - Speak another language Native:
35.4% (48)Foreign-born:
98.4% (20)
Foreign-born residents in Nicoma Park 28 residents are foreign born
This city:
1.1%Oklahoma:
6.1%
Marital status for residents in Nicoma Park Marital status - White (Caucasian) population 15 years and over
Males 28.0% Never married51.9% Now married0.6% Separated5.3% Widowed14.3% DivorcedFemales 18.8% Never married49.0% Now married1.6% Separated14.2% Widowed16.4% DivorcedWomen who gave birth in the past 12 months Now married:
68.8% (10)Unmarried:
31.2% (5)
Women who did not give birth in the past 12 months Now married:
50.4% (198)Unmarried:
49.6% (196)
Marital status - Black or African American population 15 years and over
Males 22.6% Never married58.1% Now married0.0% Separated0.0% Widowed19.4% DivorcedFemales 0.0% Never married100.0% Now married0.0% Separated0.0% Widowed0.0% DivorcedWomen who did not give birth in the past 12 months Now married:
100.0% (6)Unmarried:
0.0% (0)
Marital status - American Indian / Alaska Native population 15 years and over
Males 24.4% Never married52.6% Now married0.0% Separated0.0% Widowed23.1% DivorcedFemales 39.5% Never married44.7% Now married0.0% Separated0.0% Widowed15.8% DivorcedWomen who did not give birth in the past 12 months Now married:
35.9% (16)Unmarried:
64.1% (28)
Marital status - Other race population 15 years and over
Males 53.6% Never married10.7% Now married0.0% Separated0.0% Widowed35.7% DivorcedFemales 0.0% Never married10.5% Now married0.0% Separated89.5% Widowed0.0% DivorcedWomen who did not give birth in the past 12 months Now married:
0.0% (0)Unmarried:
100.0% (14)
Marital status - Two or more races population 15 years and over
Males 51.6% Never married43.5% Now married0.0% Separated0.0% Widowed4.8% DivorcedFemales 40.6% Never married31.3% Now married0.0% Separated10.9% Widowed17.2% DivorcedWomen who gave birth in the past 12 months Now married:
60.0% (9)Unmarried:
40.0% (6)
Women who did not give birth in the past 12 months Now married:
25.0% (14)Unmarried:
75.0% (42)
Marital status - White alone, not Hispanic / Latino population 15 years and over
Males 25.1% Never married54.4% Now married0.0% Separated5.5% Widowed15.0% DivorcedFemales 18.4% Never married49.2% Now married1.6% Separated14.5% Widowed16.3% DivorcedWomen who gave birth in the past 12 months Now married:
100.0% (11)Unmarried:
0.0% (0)
Women who did not give birth in the past 12 months Now married:
49.8% (210)Unmarried:
50.2% (212)
Marital status - Hispanic or Latino population 15 years and over
Males 58.5% Never married27.7% Now married6.2% Separated0.0% Widowed7.7% DivorcedFemales 31.0% Never married41.4% Now married0.0% Separated0.0% Widowed27.6% DivorcedWomen who gave birth in the past 12 months Now married:
0.0% (0)Unmarried:
100.0% (5)
Women who did not give birth in the past 12 months Now married:
52.6% (11)Unmarried:
47.4% (10)
Ancestries in Nicoma Park
197 16.4% American88 7.3% English26 2.2% Irish25 2.1% German24 2.0% Scottish20 1.7% Polish13 1.1% Italian9 0.7% French4 0.3% Dutch4 0.3% Eastern European4 0.3% French Canadian4 0.3% Welsh3 0.2% British
Children Nativity (place of birth) in Nicoma Park
Children under 6 years - Living with two parents Both parents native 115 100.0% NativeChildren under 6 years - Living with one parent Native parent 56 100.0% Native
Children 6 to 17 years - Living with two parents Both parents native 417 100.0% NativeChildren 6 to 17 years - Living with one parent Native parent 147 100.0% Native
Place of birth for residents in Nicoma Park 19 Americas19 Latin America19 Central America8 Europe4 Eastern Europe3 Western Europe
Grandparents responsible for own grandchildren in Nicoma Park
Grandparents (30 to 59 years) White / Caucasian 5 30.5% Responsible for grandchildren12 69.5% Not responsible for grandchildrenWhite alone, not Hispanic / Latino 6 28.0% Responsible for grandchildren16 72.0% Not responsible for grandchildrenGrandparents (60 years and over) White / Caucasian 6 15.9% Responsible for grandchildren30 84.1% Not responsible for grandchildrenWhite alone, not Hispanic / Latino 5 14.4% Responsible for grandchildren33 85.6% Not responsible for grandchildren