Races in Niles, Illinois (IL) Detailed Stats
Data:
Races - White alone (%)
Races - White alone (% change since 2000)
Races - Black alone (%)
Races - Black alone (% change since 2000)
Races - American Indian alone (%)
Races - American Indian alone (% change since 2000)
Races - Asian alone (%)
Races - Asian alone (% change since 2000)
Races - Hispanic (%)
Races - Hispanic (% change since 2000)
Races - Native Hawaiian and Other Pacific Islander alone (%)
Races - Native Hawaiian and Other Pacific Islander alone (% change since 2000)
Races - Two or more races(%)
Races - Two or more races(% change since 2000)
Races - Other race alone (%)
Races - Other race alone (% change since 2000)
Racial diversity
Place of birth - Born in state of residence (%)
Place of birth - Born in state of residence (%) - White
Place of birth - Born in state of residence (%) - Black or African American
Place of birth - Born in state of residence (%) - Asian
Place of birth - Born in state of residence (%) - Hispanic or Latino
Place of birth - Born in state of residence (%) - American Indian and Alaska Native
Place of birth - Born in state of residence (%) - Multirace
Place of birth - Born in state of residence (%) - Other Race
Place of birth - Born in other state (%)
Place of birth - Born in other state (%) - White
Place of birth - Born in other state (%) - Black or African American
Place of birth - Born in other state (%) - Asian
Place of birth - Born in other state (%) - Hispanic or Latino
Place of birth - Born in other state (%) - American Indian and Alaska Native
Place of birth - Born in other state (%) - Multirace
Place of birth - Born in other state (%) - Other Race
Place of birth - Native, outside of US (%)
Place of birth - Native, outside of US (%) - White
Place of birth - Native, outside of US (%) - Black or African American
Place of birth - Native, outside of US (%) - Asian
Place of birth - Native, outside of US (%) - Hispanic or Latino
Place of birth - Native, outside of US (%) - American Indian and Alaska Native
Place of birth - Native, outside of US (%) - Multirace
Place of birth - Native, outside of US (%) - Other Race
Place of birth - Foreign born (%)
Place of birth - Foreign born (%) - White
Place of birth - Foreign born (%) - Black or African American
Place of birth - Foreign born (%) - Asian
Place of birth - Foreign born (%) - Hispanic or Latino
Place of birth - Foreign born (%) - American Indian and Alaska Native
Place of birth - Foreign born (%) - Multirace
Place of birth - Foreign born (%) - Other Race
Residents speaking English at home (%)
Residents speaking English at home - Born in the United States (%)
Residents speaking English at home - Native, born elsewhere (%)
Residents speaking English at home - Foreign born (%)
Residents speaking Spanish at home (%)
Residents speaking Spanish at home - Born in the United States (%)
Residents speaking Spanish at home - Native, born elsewhere (%)
Residents speaking Spanish at home - Foreign born (%)
Residents speaking other language at home (%)
Residents speaking other language at home - Born in the United States (%)
Residents speaking other language at home - Native, born elsewhere (%)
Residents speaking other language at home - Foreign born (%)
Marital status - Never married (%)
Marital status - Now married (%)
Marital status - Separated (%)
Marital status - Widowed (%)
Marital status - Divorced (%)
Ancestries Reported - Arab (%)
Ancestries Reported - Czech (%)
Ancestries Reported - Danish (%)
Ancestries Reported - Dutch (%)
Ancestries Reported - English (%)
Ancestries Reported - French (%)
Ancestries Reported - French Canadian (%)
Ancestries Reported - German (%)
Ancestries Reported - Greek (%)
Ancestries Reported - Hungarian (%)
Ancestries Reported - Irish (%)
Ancestries Reported - Italian (%)
Ancestries Reported - Lithuanian (%)
Ancestries Reported - Norwegian (%)
Ancestries Reported - Polish (%)
Ancestries Reported - Portuguese (%)
Ancestries Reported - Russian (%)
Ancestries Reported - Scotch-Irish (%)
Ancestries Reported - Scottish (%)
Ancestries Reported - Slovak (%)
Ancestries Reported - Subsaharan African (%)
Ancestries Reported - Swedish (%)
Ancestries Reported - Swiss (%)
Ancestries Reported - Ukrainian (%)
Ancestries Reported - United States (%)
Ancestries Reported - Welsh (%)
Ancestries Reported - West Indian (%)
Ancestries Reported - Other (%)
Geographical mobility - Same house 1 year ago (%)
Geographical mobility - Same house 1 year ago (%) - White
Geographical mobility - Same house 1 year ago (%) - Black or African American
Geographical mobility - Same house 1 year ago (%) - Asian
Geographical mobility - Same house 1 year ago (%) - Hispanic or Latino
Geographical mobility - Same house 1 year ago (%) - American Indian and Alaska Native
Geographical mobility - Same house 1 year ago (%) - Multirace
Geographical mobility - Same house 1 year ago (%) - Other Race
Geographical mobility - Moved within same county (%)
Geographical mobility - Moved within same county (%) - White
Geographical mobility - Moved within same county (%) - Black or African American
Geographical mobility - Moved within same county (%) - Asian
Geographical mobility - Moved within same county (%) - Hispanic or Latino
Geographical mobility - Moved within same county (%) - American Indian and Alaska Native
Geographical mobility - Moved within same county (%) - Multirace
Geographical mobility - Moved within same county (%) - Other Race
Geographical mobility - Moved from different county within same state (%)
Geographical mobility - Moved from different county within same state (%) - White
Geographical mobility - Moved from different county within same state (%) - Black or African American
Geographical mobility - Moved from different county within same state (%) - Asian
Geographical mobility - Moved from different county within same state (%) - Hispanic or Latino
Geographical mobility - Moved from different county within same state (%) - American Indian and Alaska Native
Geographical mobility - Moved from different county within same state (%) - Multirace
Geographical mobility - Moved from different county within same state (%) - Other Race
Geographical mobility - Moved from different state (%)
Geographical mobility - Moved from different state (%) - White
Geographical mobility - Moved from different state (%) - Black or African American
Geographical mobility - Moved from different state (%) - Asian
Geographical mobility - Moved from different state (%) - Hispanic or Latino
Geographical mobility - Moved from different state (%) - American Indian and Alaska Native
Geographical mobility - Moved from different state (%) - Multirace
Geographical mobility - Moved from different state (%) - Other Race
Geographical mobility - Moved from abroad (%)
Geographical mobility - Moved from abroad (%) - White
Geographical mobility - Moved from abroad (%) - Black or African American
Geographical mobility - Moved from abroad (%) - Asian
Geographical mobility - Moved from abroad (%) - Hispanic or Latino
Geographical mobility - Moved from abroad (%) - American Indian and Alaska Native
Geographical mobility - Moved from abroad (%) - Multirace
Geographical mobility - Moved from abroad (%) - Other Race
Place of birth for the foreign-born population - Ireland (%)
Place of birth for the foreign-born population - Denmark (%)
Place of birth for the foreign-born population - Norway (%)
Place of birth for the foreign-born population - Sweden (%)
Place of birth for the foreign-born population - United Kingdom (%)
Place of birth for the foreign-born population - England (%)
Place of birth for the foreign-born population - Scotland (%)
Place of birth for the foreign-born population - Other Northern Europe (%)
Place of birth for the foreign-born population - Austria (%)
Place of birth for the foreign-born population - Belgium (%)
Place of birth for the foreign-born population - France (%)
Place of birth for the foreign-born population - Germany (%)
Place of birth for the foreign-born population - Netherlands (%)
Place of birth for the foreign-born population - Switzerland (%)
Place of birth for the foreign-born population - Other Western Europe (%)
Place of birth for the foreign-born population - Greece (%)
Place of birth for the foreign-born population - Italy (%)
Place of birth for the foreign-born population - Portugal (%)
Place of birth for the foreign-born population - Spain (%)
Place of birth for the foreign-born population - Other Southern Europe (%)
Place of birth for the foreign-born population - Albania (%)
Place of birth for the foreign-born population - Belarus (%)
Place of birth for the foreign-born population - Bosnia and Herzegovina (%)
Place of birth for the foreign-born population - Bulgaria (%)
Place of birth for the foreign-born population - Croatia (%)
Place of birth for the foreign-born population - Czechoslovakia (%)
Place of birth for the foreign-born population - Hungary (%)
Place of birth for the foreign-born population - Latvia (%)
Place of birth for the foreign-born population - Lithuania (%)
Place of birth for the foreign-born population - North Macedonia (Macedonia) (%)
Place of birth for the foreign-born population - Moldova (%)
Place of birth for the foreign-born population - Poland (%)
Place of birth for the foreign-born population - Romania (%)
Place of birth for the foreign-born population - Russia (%)
Place of birth for the foreign-born population - Serbia (%)
Place of birth for the foreign-born population - Ukraine (%)
Place of birth for the foreign-born population - Other Eastern Europe (%)
Place of birth for the foreign-born population - China (%)
Place of birth for the foreign-born population - Hong Kong (%)
Place of birth for the foreign-born population - Taiwan (%)
Place of birth for the foreign-born population - Japan (%)
Place of birth for the foreign-born population - Korea (%)
Place of birth for the foreign-born population - Other Eastern Asia (%)
Place of birth for the foreign-born population - Afghanistan (%)
Place of birth for the foreign-born population - Bangladesh (%)
Place of birth for the foreign-born population - India (%)
Place of birth for the foreign-born population - Iran (%)
Place of birth for the foreign-born population - Kazakhstan (%)
Place of birth for the foreign-born population - Nepal (%)
Place of birth for the foreign-born population - Pakistan (%)
Place of birth for the foreign-born population - Sri Lanka (%)
Place of birth for the foreign-born population - Uzbekistan (%)
Place of birth for the foreign-born population - Other South Central Asia (%)
Place of birth for the foreign-born population - Burma (%)
Place of birth for the foreign-born population - Cambodia (%)
Place of birth for the foreign-born population - Indonesia (%)
Place of birth for the foreign-born population - Laos (%)
Place of birth for the foreign-born population - Malaysia (%)
Place of birth for the foreign-born population - Philippines (%)
Place of birth for the foreign-born population - Singapore (%)
Place of birth for the foreign-born population - Thailand (%)
Place of birth for the foreign-born population - Vietnam (%)
Place of birth for the foreign-born population - Other South Eastern Asia (%)
Place of birth for the foreign-born population - Armenia (%)
Place of birth for the foreign-born population - Iraq (%)
Place of birth for the foreign-born population - Israel (%)
Place of birth for the foreign-born population - Jordan (%)
Place of birth for the foreign-born population - Kuwait (%)
Place of birth for the foreign-born population - Lebanon (%)
Place of birth for the foreign-born population - Saudi Arabia (%)
Place of birth for the foreign-born population - Syria (%)
Place of birth for the foreign-born population - Turkey (%)
Place of birth for the foreign-born population - Yemen (%)
Place of birth for the foreign-born population - Other Western Asia (%)
Place of birth for the foreign-born population - Eritrea (%)
Place of birth for the foreign-born population - Ethiopia (%)
Place of birth for the foreign-born population - Kenya (%)
Place of birth for the foreign-born population - Somalia (%)
Place of birth for the foreign-born population - Uganda (%)
Place of birth for the foreign-born population - Zimbabwe (%)
Place of birth for the foreign-born population - Other Eastern Africa (%)
Place of birth for the foreign-born population - Cameroon (%)
Place of birth for the foreign-born population - Congo (%)
Place of birth for the foreign-born population - Democratic Republic of Congo (Zaire) (%)
Place of birth for the foreign-born population - Other Middle Africa (%)
Place of birth for the foreign-born population - Egypt (%)
Place of birth for the foreign-born population - Morocco (%)
Place of birth for the foreign-born population - Sudan (%)
Place of birth for the foreign-born population - Other Northern Africa (%)
Place of birth for the foreign-born population - South Africa (%)
Place of birth for the foreign-born population - Other Southern Africa (%)
Place of birth for the foreign-born population - Cabo Verde (%)
Place of birth for the foreign-born population - Ghana (%)
Place of birth for the foreign-born population - Liberia (%)
Place of birth for the foreign-born population - Nigeria (%)
Place of birth for the foreign-born population - Senegal (%)
Place of birth for the foreign-born population - Sierra Leone (%)
Place of birth for the foreign-born population - Other Western Africa (%)
Place of birth for the foreign-born population - Australia (%)
Place of birth for the foreign-born population - New Zealand (%)
Place of birth for the foreign-born population - Fiji (%)
Place of birth for the foreign-born population - Micronesia (%)
Place of birth for the foreign-born population - Bahamas (%)
Place of birth for the foreign-born population - Barbados (%)
Place of birth for the foreign-born population - Cuba (%)
Place of birth for the foreign-born population - Dominica (%)
Place of birth for the foreign-born population - Dominican Republic (%)
Place of birth for the foreign-born population - Grenada (%)
Place of birth for the foreign-born population - Haiti (%)
Place of birth for the foreign-born population - Jamaica (%)
Place of birth for the foreign-born population - St. Vincent and the Grenadines (%)
Place of birth for the foreign-born population - Trinidad and Tobago (%)
Place of birth for the foreign-born population - West Indies (%)
Place of birth for the foreign-born population - Other Caribbean (%)
Place of birth for the foreign-born population - Belize (%)
Place of birth for the foreign-born population - Costa Rica (%)
Place of birth for the foreign-born population - El Salvador (%)
Place of birth for the foreign-born population - Guatemala (%)
Place of birth for the foreign-born population - Honduras (%)
Place of birth for the foreign-born population - Mexico (%)
Place of birth for the foreign-born population - Nicaragua (%)
Place of birth for the foreign-born population - Panama (%)
Place of birth for the foreign-born population - Other Central America (%)
Place of birth for the foreign-born population - Argentina (%)
Place of birth for the foreign-born population - Bolivia (%)
Place of birth for the foreign-born population - Brazil (%)
Place of birth for the foreign-born population - Chile (%)
Place of birth for the foreign-born population - Colombia (%)
Place of birth for the foreign-born population - Ecuador (%)
Place of birth for the foreign-born population - Guyana (%)
Place of birth for the foreign-born population - Peru (%)
Place of birth for the foreign-born population - Uruguay (%)
Place of birth for the foreign-born population - Venezuela (%)
Place of birth for the foreign-born population - Other South America (%)
Place of birth for the foreign-born population - Canada (%)
Place of birth for the foreign-born population - Other Northern America (%)
Place of birth for the foreign-born population - Other (%)
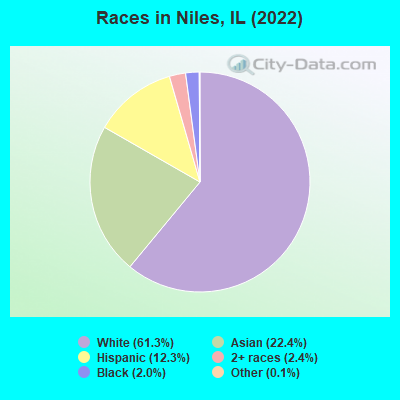
According to 2022 data, the most numerous races in Niles, IL are White alone (18,377 residents), Hispanic (3,670 residents), and Black alone (591 residents). 41.1% of Niles residents speak English at home. 43.3% of Niles, IL residents are foreign-born (20.3% born in Asia, 16.2% born in Europe, 4.9% born in Latin America), which is 67.6% greater than the foreign-born rate of 14.0% across the entire state of Illinois.
Race distribution in Niles
2000 2022
8,424,140 67.8% White alone 1,856,152 14.9% Black alone 1,530,262 12.3% Hispanic 419,916 3.4% Asian alone 153,996 1.2% Two or more races 13,479 0.1% Other race alone 18,232 0.1% American Indian alone 3,116 0.03% Native Hawaiian and Other
7,356,301 58.5% White alone 2,299,726 18.3% Hispanic 1,660,423 13.2% Black alone 747,296 5.9% Asian alone 458,599 3.6% Two or more races 45,386 0.4% Other race alone 10,405 0.08% American Indian alone 3,896 0.03% Native Hawaiian and Other
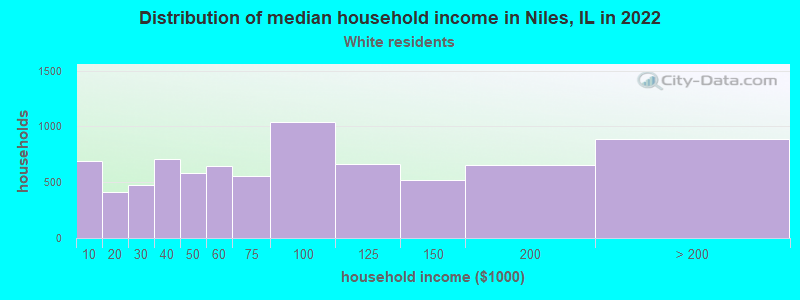
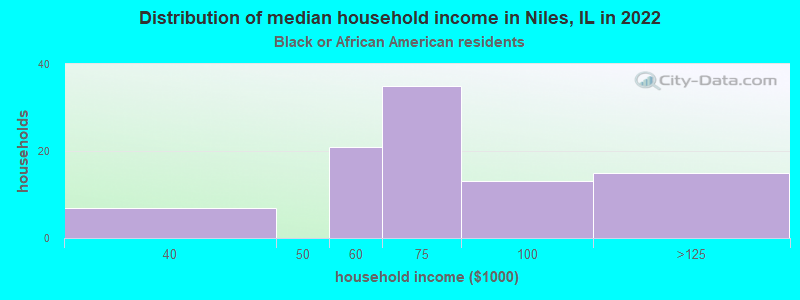
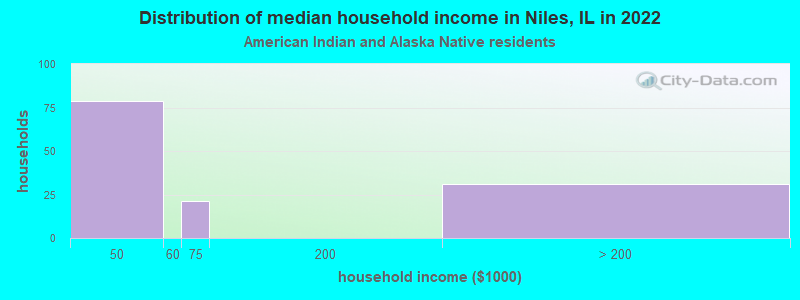
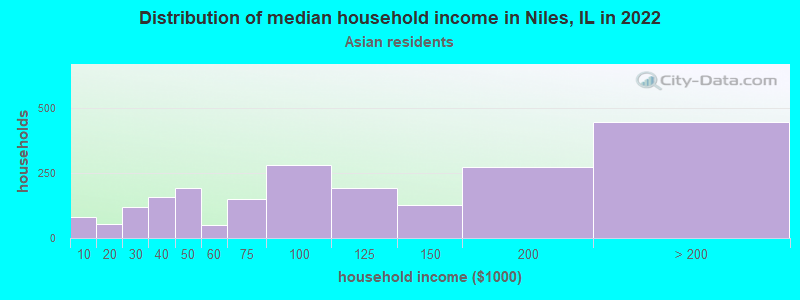
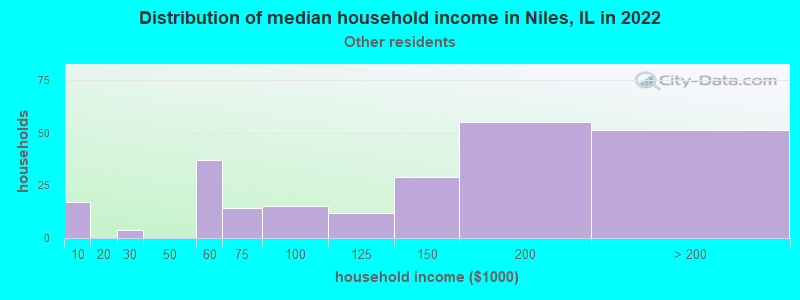
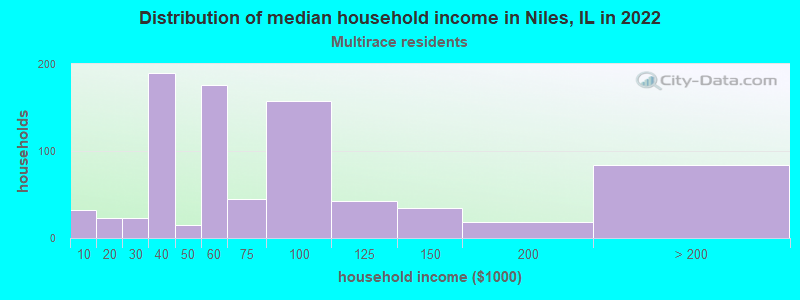
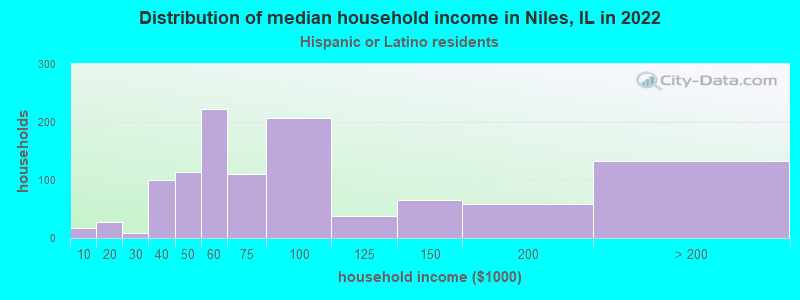
Income and house value in Niles Median household income in 2022 $69,396 White non-Hispanic householders$64,221 Black householders$46,551 American Indian and Alaska Native householders$104,444 Asian householders$147,127 Some other race householders$56,411 Two or more races householders$69,544 Hispanic or Latino race householdersMedian 2022 house value $358,954 White Non-Hispanic householders$207,008 Black or African American householders$239,593 American Indian or Alaska Native householders $328,983 Asian householders$435,624 Some other race householders$310,338 Two or more races householders$395,720 Hispanic or Latino householders
Median age by race in Niles
52.9 Median age for White residents51.7 55.8 48.6 Median age for Black or African American residents43.5 61.9 75.7 Median age for American Indian / Alaska Native residents86.3 71.4 44.7 Median age for Asian residents44.5 45.1 -687,999,999.3 Median age for Native Hawaiian / Pacific Islander residents-918,721,460.3 -610,229,276.3 32.1 Median age for Other race residents33.1 30.2 35.9 Median age for Two or more races residents31.0 41.8 52.5 Median age for White alone residents50.9 55.6 36.4 Median age for Hispanic or Latino residents32.9 38.6
Owner/renter occupied households by race in Niles
House owners and renters - White residents 6,180 79.0% Owner occupied1,641 21.0% Renter occupiedHouse owners and renters - Black or African American residents 58 60.3% Owner occupied39 39.7% Renter occupiedHouse owners and renters - American Indian / Alaska Native residents 133 79.5% Owner occupied34 20.5% Renter occupiedHouse owners and renters - Asian residents 1,652 77.5% Owner occupied479 22.5% Renter occupiedHouse owners and renters - Other race residents 150 63.9% Owner occupied85 36.1% Renter occupiedHouse owners and renters - Two or more races residents 429 51.4% Owner occupied406 48.6% Renter occupiedHouse owners and renters - White alone residents 6,319 79.0% Owner occupied1,680 21.0% Renter occupiedHouse owners and renters - Hispanic or Latino residents 599 55.4% Owner occupied483 44.6% Renter occupied
Language usage in Niles
English speakers - Total 41.1% of residents of Niles speak English at home.
9.4% of residents speak Spanish at home 1,240 45.9% Speak English very well1,459 54.1% Speak English less than very well50.5% of residents speak other language at home 8,142 56.3% Speak English very well6,318 43.7% Speak English less than very well
English speakers - Born in the United States 80.4% of residents of Niles speak English at home.
8.2% of residents speak Spanish at home 121 100.0% Speak English very well11.9% of residents speak other language at home 173 98.9% Speak English very well2 1.1% Speak English less than very well
English speakers - Native, born elsewhere 8.2% of residents of Niles speak English at home.
56.2% of residents speak Spanish at home 118 41.1% Speak English very well169 58.9% Speak English less than very well34.4% of residents speak other language at home 71 40.3% Speak English very well105 59.7% Speak English less than very well
English speakers - Foreign-born 5.1% of residents of Niles speak English at home.
10.8% of residents speak Spanish at home 240 17.1% Speak English very well1,160 82.9% Speak English less than very well84.0% of residents speak other language at home 5,082 46.8% Speak English very well5,774 53.2% Speak English less than very well
White (Caucasian) - Speak only English Native:
80.3% (9,138)Foreign-born:
7.1% (358)
White (Caucasian) - Speak another language Native:
17.3% (1,968)Foreign-born:
92.4% (4,668)
Black or African American - Speak another language Native:
11.5% (58)Foreign-born:
91.2% (78)
American Indian / Alaska Native - Speak another language Native:
56.2% (98)Foreign-born:
100.0% (159)
Asian - Speak only English Native:
30.3% (478)Foreign-born:
4.2% (206)
Asian - Speak another language Native:
69.5% (1,098)Foreign-born:
96.8% (4,734)
Other race - Speak another language Native:
89.7% (445)Foreign-born:
100.0% (406)
Two or more races - Speak only English Native:
65.6% (769)Foreign-born:
3.5% (46)
Two or more races - Speak another language Native:
33.2% (389)Foreign-born:
96.5% (1,282)
White alone - Speak only English Native:
79.2% (9,050)Foreign-born:
6.1% (381)
White alone - Speak another language Native:
22.1% (2,528)Foreign-born:
95.0% (5,983)
Hispanic or Latino - Speak only English Native:
34.3% (662)Foreign-born:
2.7% (39)
Hispanic or Latino - Speak another language Native:
65.8% (1,270)Foreign-born:
97.5% (1,409)
Foreign-born residents in Niles 12,958 residents are foreign born (20.3% Asia , 16.2% Europe , 4.9% Latin America ).
This city:
43.3%Illinois:
14.1%
Marital status for residents in Niles Marital status - White (Caucasian) population 15 years and over
Males 30.2% Never married55.7% Now married0.8% Separated6.7% Widowed6.6% DivorcedFemales 23.0% Never married47.6% Now married1.6% Separated19.9% Widowed7.9% DivorcedWomen who gave birth in the past 12 months Now married:
100.0% (117)Unmarried:
0.0% (0)
Women who did not give birth in the past 12 months Now married:
54.6% (1,632)Unmarried:
45.4% (1,359)
Marital status - Black or African American population 15 years and over
Males 55.3% Never married24.3% Now married13.6% Separated0.0% Widowed6.8% DivorcedFemales 38.9% Never married28.8% Now married2.2% Separated20.4% Widowed9.7% DivorcedWomen who gave birth in the past 12 months Now married:
100.0% (20)Unmarried:
0.0% (0)
Women who did not give birth in the past 12 months Now married:
42.6% (25)Unmarried:
57.4% (33)
Marital status - American Indian / Alaska Native population 15 years and over
Males 15.3% Never married84.7% Now married0.0% Separated0.0% Widowed0.0% DivorcedFemales 14.1% Never married85.9% Now married0.0% Separated0.0% Widowed0.0% DivorcedWomen who did not give birth in the past 12 months Now married:
53.8% (25)Unmarried:
46.2% (22)
Marital status - Asian population 15 years and over
Males 30.5% Never married64.2% Now married2.2% Separated0.8% Widowed2.3% DivorcedFemales 28.0% Never married55.3% Now married3.5% Separated8.5% Widowed4.6% DivorcedWomen who gave birth in the past 12 months Now married:
87.6% (100)Unmarried:
12.4% (14)
Women who did not give birth in the past 12 months Now married:
49.7% (731)Unmarried:
50.3% (741)
Marital status - Other race population 15 years and over
Males 39.9% Never married50.5% Now married6.8% Separated1.6% Widowed1.4% DivorcedFemales 31.8% Never married55.6% Now married11.7% Separated0.0% Widowed0.8% DivorcedWomen who did not give birth in the past 12 months Now married:
57.0% (111)Unmarried:
43.0% (84)
Marital status - Two or more races population 15 years and over
Males 42.1% Never married56.7% Now married0.0% Separated0.0% Widowed1.1% DivorcedFemales 23.9% Never married51.6% Now married0.9% Separated5.7% Widowed17.9% DivorcedWomen who did not give birth in the past 12 months Now married:
65.5% (295)Unmarried:
34.5% (155)
Marital status - White alone, not Hispanic / Latino population 15 years and over
Males 29.6% Never married55.6% Now married0.8% Separated7.0% Widowed7.0% DivorcedFemales 22.6% Never married47.5% Now married1.6% Separated21.0% Widowed7.3% DivorcedWomen who gave birth in the past 12 months Now married:
100.0% (114)Unmarried:
0.0% (0)
Women who did not give birth in the past 12 months Now married:
56.0% (1,671)Unmarried:
44.0% (1,311)
Marital status - Hispanic or Latino population 15 years and over
Males 40.2% Never married56.6% Now married1.8% Separated0.4% Widowed1.0% DivorcedFemales 26.0% Never married54.6% Now married3.1% Separated4.1% Widowed12.2% DivorcedWomen who gave birth in the past 12 months Now married:
100.0% (18)Unmarried:
0.0% (0)
Women who did not give birth in the past 12 months Now married:
56.8% (449)Unmarried:
43.2% (341)
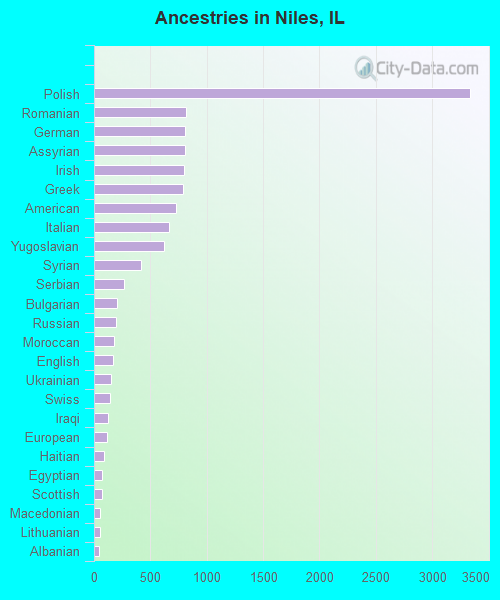
Ancestries in Niles
3,337 17.3% Polish820 4.2% Romanian806 4.2% German804 4.2% Assyrian795 4.1% Irish788 4.1% Greek729 3.8% American668 3.5% Italian624 3.2% Yugoslavian420 2.2% Syrian262 1.4% Serbian201 1.0% Bulgarian193 1.0% Russian181 0.9% Moroccan165 0.9% English152 0.8% Ukrainian142 0.7% Swiss127 0.7% Iraqi112 0.6% European88 0.5% Haitian72 0.4% Egyptian72 0.4% Scottish57 0.3% Macedonian53 0.3% Lithuanian45 0.2% Albanian44 0.2% Eastern European34 0.2% French33 0.2% Norwegian30 0.2% Scotch-Irish29 0.2% Swedish25 0.1% Slovak16 0.08% Arab16 0.08% Afghan14 0.07% Belgian9 0.05% Austrian9 0.05% Croatian7 0.04% Czech6 0.03% Armenian5 0.03% British5 0.03% Dutch5 0.03% Danish3 0.02% Hungarian
Geographical mobility in Niles Same house 1 year ago 16,204 92.8% White (Caucasian)498 81.5% Black or African American138 42.4% American Indian / Alaska Native5,768 87.1% Asian21 100.0% Native Hawaiian / Pacific Islander1,025 99.7% Other race2,688 98.0% Two or more races17,013 92.9% White alone, not Hispanic / Latino3,484 95.4% Hispanic or LatinoMoved within same county 864 4.9% White / Caucasian85 13.9% Black or African American215 66.1% American Indian / Alaska Native669 10.1% Asian12 1.1% Other race26 1.0% Two or more races928 5.1% White alone, not Hispanic / Latino151 4.1% Hispanic or LatinoMoved within same state 103 0.6% White / Caucasian22 3.6% Black or African American7 0.1% Asian108 0.6% White alone, not Hispanic / LatinoMoved from different state 103 0.6% White / Caucasian2 0.4% Black or African American68 1.0% Asian106 0.6% White alone, not Hispanic / LatinoMoved from abroad 64 0.4% White91 1.4% Asian70 0.4% White alone, not Hispanic / Latino
Children Nativity (place of birth) in Niles
Children under 6 years - Living with two parents Both parents native 226 100.0% NativeBoth parents foreign-born 609 95.3% Native30 4.7% Foreign-bornOne native, one foreign-born parent 432 100.0% NativeChildren under 6 years - Living with one parent Native parent 133 100.0% NativeForeign-born parent 79 100.0% NativeChildren 6 to 17 years - Living with two parents Both parents native 756 100.0% NativeBoth parents foreign-born 1,478 83.5% Native291 16.5% Foreign-bornOne native, one foreign-born parent 406 94.5% Native24 5.5% Foreign-bornChildren 6 to 17 years - Living with one parent Native parent 279 100.0% NativeForeign-born parent 166 51.8% Native154 48.2% Foreign-born
Place of birth for residents in Niles 6,167 Asia4,927 Europe4,120 Eastern Europe2,053 South Eastern Asia1,839 South Central Asia1,557 Americas1,492 Latin America1,324 Western Asia1,120 Central America950 Eastern Asia516 Southern Europe259 Africa218 Caribbean210 Northern Africa200 Western Europe153 South America138 China89 Northern Europe65 Northern America48 Eastern Africa45 Oceania21 Australia and New Zealand Subregion2,126 Poland1,797 Philippines1,334 India1,040 Mexico825 Iraq620 Korea537 Romania471 Pakistan402 Bosnia and Herzegovina381 Syria323 Greece248 Vietnam239 Serbia193 Italy188 Bulgaria178 Ukraine142 Cuba138 China134 Morocco132 Russia123 Germany76 Egypt70 Haiti65 Canada62 Moldova57 Ecuador55 Azerbaijan52 Lithuania51 Colombia47 United Kingdom46 Belarus46 Albania43 Austria42 Honduras41 Ireland33 France28 North Macedonia (Macedonia)26 Kenya25 El Salvador25 Kuwait23 Croatia23 Fiji21 Ethiopia21 Australia21 Argentina21 Chile20 Georgia14 United Arab Emirates12 Uzbekistan10 Czechoslovakia10 Guatemala7 Cambodia5 Dominican Republic
Grandparents responsible for own grandchildren in Niles
Grandparents (30 to 59 years) White / Caucasian 11 36.7% Responsible for grandchildren18 63.3% Not responsible for grandchildrenAsian 45 42.9% Responsible for grandchildren59 57.1% Not responsible for grandchildrenOther race 17 100.0% Not responsible for grandchildrenWhite alone, not Hispanic / Latino 14 47.3% Responsible for grandchildren16 52.7% Not responsible for grandchildrenHispanic or Latino 14 100.0% Not responsible for grandchildren
Grandparents (60 years and over) White / Caucasian 5 3.0% Responsible for grandchildren173 97.0% Not responsible for grandchildrenAsian 305 100.0% Not responsible for grandchildrenOther race 2 100.0% Not responsible for grandchildrenWhite alone, not Hispanic / Latino 6 2.8% Responsible for grandchildren222 97.2% Not responsible for grandchildrenHispanic or Latino 17 100.0% Not responsible for grandchildren