Races in North Albany, Oregon (OR) Detailed Stats
Ancestries, Foreign-born residents, place of birth
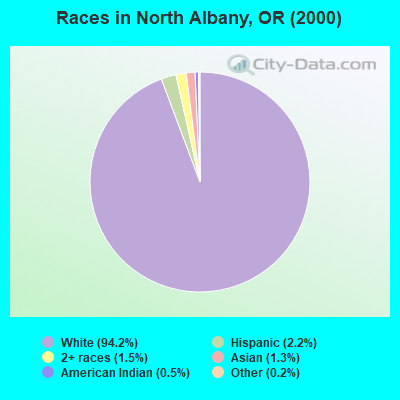
Race distribution in North Albany

- 6,57894.2%White alone
- 1512.2%Hispanic
- 1051.5%Two or more races
- 941.3%Asian alone
- 330.5%American Indian alone
- 130.2%Other race alone
- 60.09%Black alone
- 40.06%Native Hawaiian and Other
Pacific Islander alone
2000
2022
-
- 2,857,61683.5%White alone
- 275,3148.0%Hispanic
- 100,3332.9%Asian alone
- 82,7332.4%Two or more races
- 53,3251.6%Black alone
- 40,1301.2%American Indian alone
- 7,3980.2%Native Hawaiian and Other
Pacific Islander alone - 4,5500.1%Other race alone

-
- 3,037,57171.6%White alone
- 609,53814.4%Hispanic
- 252,7446.0%Two or more races
- 191,2834.5%Asian alone
- 78,2281.8%Black alone
- 29,3990.7%American Indian alone
- 25,7310.6%Other race alone
- 15,6430.4%Native Hawaiian and Other
Pacific Islander alone

Income and house value in North Albany
- Median household income in 2022
- $106,278White non-Hispanic householders
- over $200,000American Indian and Alaska Native householders
- over $200,000Asian householders
- $106,654Some other race householders
- $123,573Two or more races householders
- $86,037Hispanic or Latino race householders
- Median 2022 house value
- $590,752White Non-Hispanic householders
- $430,007Black or African American householders
- $820,923American Indian or Alaska Native householders
- $990,424Asian householders
- $615,145Some other race householders
- $476,917Two or more races householders
- $599,508Hispanic or Latino householders
Household income for White non-Hispanic householders

Household income for Black householders

Household income for American Indian and Alaska Native householders

Household income for Asian householders

Household income for Two or more races householders

Household income for Hispanic or Latino race householders

Zip code: 97321