Races in North Augusta, South Carolina (SC) Detailed Stats
Data:
Races - White alone (%)
Races - White alone (% change since 2000)
Races - Black alone (%)
Races - Black alone (% change since 2000)
Races - American Indian alone (%)
Races - American Indian alone (% change since 2000)
Races - Asian alone (%)
Races - Asian alone (% change since 2000)
Races - Hispanic (%)
Races - Hispanic (% change since 2000)
Races - Native Hawaiian and Other Pacific Islander alone (%)
Races - Native Hawaiian and Other Pacific Islander alone (% change since 2000)
Races - Two or more races(%)
Races - Two or more races(% change since 2000)
Races - Other race alone (%)
Races - Other race alone (% change since 2000)
Racial diversity
Place of birth - Born in state of residence (%)
Place of birth - Born in state of residence (%) - White
Place of birth - Born in state of residence (%) - Black or African American
Place of birth - Born in state of residence (%) - Asian
Place of birth - Born in state of residence (%) - Hispanic or Latino
Place of birth - Born in state of residence (%) - American Indian and Alaska Native
Place of birth - Born in state of residence (%) - Multirace
Place of birth - Born in state of residence (%) - Other Race
Place of birth - Born in other state (%)
Place of birth - Born in other state (%) - White
Place of birth - Born in other state (%) - Black or African American
Place of birth - Born in other state (%) - Asian
Place of birth - Born in other state (%) - Hispanic or Latino
Place of birth - Born in other state (%) - American Indian and Alaska Native
Place of birth - Born in other state (%) - Multirace
Place of birth - Born in other state (%) - Other Race
Place of birth - Native, outside of US (%)
Place of birth - Native, outside of US (%) - White
Place of birth - Native, outside of US (%) - Black or African American
Place of birth - Native, outside of US (%) - Asian
Place of birth - Native, outside of US (%) - Hispanic or Latino
Place of birth - Native, outside of US (%) - American Indian and Alaska Native
Place of birth - Native, outside of US (%) - Multirace
Place of birth - Native, outside of US (%) - Other Race
Place of birth - Foreign born (%)
Place of birth - Foreign born (%) - White
Place of birth - Foreign born (%) - Black or African American
Place of birth - Foreign born (%) - Asian
Place of birth - Foreign born (%) - Hispanic or Latino
Place of birth - Foreign born (%) - American Indian and Alaska Native
Place of birth - Foreign born (%) - Multirace
Place of birth - Foreign born (%) - Other Race
Residents speaking English at home (%)
Residents speaking English at home - Born in the United States (%)
Residents speaking English at home - Native, born elsewhere (%)
Residents speaking English at home - Foreign born (%)
Residents speaking Spanish at home (%)
Residents speaking Spanish at home - Born in the United States (%)
Residents speaking Spanish at home - Native, born elsewhere (%)
Residents speaking Spanish at home - Foreign born (%)
Residents speaking other language at home (%)
Residents speaking other language at home - Born in the United States (%)
Residents speaking other language at home - Native, born elsewhere (%)
Residents speaking other language at home - Foreign born (%)
Marital status - Never married (%)
Marital status - Now married (%)
Marital status - Separated (%)
Marital status - Widowed (%)
Marital status - Divorced (%)
Ancestries Reported - Arab (%)
Ancestries Reported - Czech (%)
Ancestries Reported - Danish (%)
Ancestries Reported - Dutch (%)
Ancestries Reported - English (%)
Ancestries Reported - French (%)
Ancestries Reported - French Canadian (%)
Ancestries Reported - German (%)
Ancestries Reported - Greek (%)
Ancestries Reported - Hungarian (%)
Ancestries Reported - Irish (%)
Ancestries Reported - Italian (%)
Ancestries Reported - Lithuanian (%)
Ancestries Reported - Norwegian (%)
Ancestries Reported - Polish (%)
Ancestries Reported - Portuguese (%)
Ancestries Reported - Russian (%)
Ancestries Reported - Scotch-Irish (%)
Ancestries Reported - Scottish (%)
Ancestries Reported - Slovak (%)
Ancestries Reported - Subsaharan African (%)
Ancestries Reported - Swedish (%)
Ancestries Reported - Swiss (%)
Ancestries Reported - Ukrainian (%)
Ancestries Reported - United States (%)
Ancestries Reported - Welsh (%)
Ancestries Reported - West Indian (%)
Ancestries Reported - Other (%)
Geographical mobility - Same house 1 year ago (%)
Geographical mobility - Same house 1 year ago (%) - White
Geographical mobility - Same house 1 year ago (%) - Black or African American
Geographical mobility - Same house 1 year ago (%) - Asian
Geographical mobility - Same house 1 year ago (%) - Hispanic or Latino
Geographical mobility - Same house 1 year ago (%) - American Indian and Alaska Native
Geographical mobility - Same house 1 year ago (%) - Multirace
Geographical mobility - Same house 1 year ago (%) - Other Race
Geographical mobility - Moved within same county (%)
Geographical mobility - Moved within same county (%) - White
Geographical mobility - Moved within same county (%) - Black or African American
Geographical mobility - Moved within same county (%) - Asian
Geographical mobility - Moved within same county (%) - Hispanic or Latino
Geographical mobility - Moved within same county (%) - American Indian and Alaska Native
Geographical mobility - Moved within same county (%) - Multirace
Geographical mobility - Moved within same county (%) - Other Race
Geographical mobility - Moved from different county within same state (%)
Geographical mobility - Moved from different county within same state (%) - White
Geographical mobility - Moved from different county within same state (%) - Black or African American
Geographical mobility - Moved from different county within same state (%) - Asian
Geographical mobility - Moved from different county within same state (%) - Hispanic or Latino
Geographical mobility - Moved from different county within same state (%) - American Indian and Alaska Native
Geographical mobility - Moved from different county within same state (%) - Multirace
Geographical mobility - Moved from different county within same state (%) - Other Race
Geographical mobility - Moved from different state (%)
Geographical mobility - Moved from different state (%) - White
Geographical mobility - Moved from different state (%) - Black or African American
Geographical mobility - Moved from different state (%) - Asian
Geographical mobility - Moved from different state (%) - Hispanic or Latino
Geographical mobility - Moved from different state (%) - American Indian and Alaska Native
Geographical mobility - Moved from different state (%) - Multirace
Geographical mobility - Moved from different state (%) - Other Race
Geographical mobility - Moved from abroad (%)
Geographical mobility - Moved from abroad (%) - White
Geographical mobility - Moved from abroad (%) - Black or African American
Geographical mobility - Moved from abroad (%) - Asian
Geographical mobility - Moved from abroad (%) - Hispanic or Latino
Geographical mobility - Moved from abroad (%) - American Indian and Alaska Native
Geographical mobility - Moved from abroad (%) - Multirace
Geographical mobility - Moved from abroad (%) - Other Race
Place of birth for the foreign-born population - Ireland (%)
Place of birth for the foreign-born population - Denmark (%)
Place of birth for the foreign-born population - Norway (%)
Place of birth for the foreign-born population - Sweden (%)
Place of birth for the foreign-born population - United Kingdom (%)
Place of birth for the foreign-born population - England (%)
Place of birth for the foreign-born population - Scotland (%)
Place of birth for the foreign-born population - Other Northern Europe (%)
Place of birth for the foreign-born population - Austria (%)
Place of birth for the foreign-born population - Belgium (%)
Place of birth for the foreign-born population - France (%)
Place of birth for the foreign-born population - Germany (%)
Place of birth for the foreign-born population - Netherlands (%)
Place of birth for the foreign-born population - Switzerland (%)
Place of birth for the foreign-born population - Other Western Europe (%)
Place of birth for the foreign-born population - Greece (%)
Place of birth for the foreign-born population - Italy (%)
Place of birth for the foreign-born population - Portugal (%)
Place of birth for the foreign-born population - Spain (%)
Place of birth for the foreign-born population - Other Southern Europe (%)
Place of birth for the foreign-born population - Albania (%)
Place of birth for the foreign-born population - Belarus (%)
Place of birth for the foreign-born population - Bosnia and Herzegovina (%)
Place of birth for the foreign-born population - Bulgaria (%)
Place of birth for the foreign-born population - Croatia (%)
Place of birth for the foreign-born population - Czechoslovakia (%)
Place of birth for the foreign-born population - Hungary (%)
Place of birth for the foreign-born population - Latvia (%)
Place of birth for the foreign-born population - Lithuania (%)
Place of birth for the foreign-born population - North Macedonia (Macedonia) (%)
Place of birth for the foreign-born population - Moldova (%)
Place of birth for the foreign-born population - Poland (%)
Place of birth for the foreign-born population - Romania (%)
Place of birth for the foreign-born population - Russia (%)
Place of birth for the foreign-born population - Serbia (%)
Place of birth for the foreign-born population - Ukraine (%)
Place of birth for the foreign-born population - Other Eastern Europe (%)
Place of birth for the foreign-born population - China (%)
Place of birth for the foreign-born population - Hong Kong (%)
Place of birth for the foreign-born population - Taiwan (%)
Place of birth for the foreign-born population - Japan (%)
Place of birth for the foreign-born population - Korea (%)
Place of birth for the foreign-born population - Other Eastern Asia (%)
Place of birth for the foreign-born population - Afghanistan (%)
Place of birth for the foreign-born population - Bangladesh (%)
Place of birth for the foreign-born population - India (%)
Place of birth for the foreign-born population - Iran (%)
Place of birth for the foreign-born population - Kazakhstan (%)
Place of birth for the foreign-born population - Nepal (%)
Place of birth for the foreign-born population - Pakistan (%)
Place of birth for the foreign-born population - Sri Lanka (%)
Place of birth for the foreign-born population - Uzbekistan (%)
Place of birth for the foreign-born population - Other South Central Asia (%)
Place of birth for the foreign-born population - Burma (%)
Place of birth for the foreign-born population - Cambodia (%)
Place of birth for the foreign-born population - Indonesia (%)
Place of birth for the foreign-born population - Laos (%)
Place of birth for the foreign-born population - Malaysia (%)
Place of birth for the foreign-born population - Philippines (%)
Place of birth for the foreign-born population - Singapore (%)
Place of birth for the foreign-born population - Thailand (%)
Place of birth for the foreign-born population - Vietnam (%)
Place of birth for the foreign-born population - Other South Eastern Asia (%)
Place of birth for the foreign-born population - Armenia (%)
Place of birth for the foreign-born population - Iraq (%)
Place of birth for the foreign-born population - Israel (%)
Place of birth for the foreign-born population - Jordan (%)
Place of birth for the foreign-born population - Kuwait (%)
Place of birth for the foreign-born population - Lebanon (%)
Place of birth for the foreign-born population - Saudi Arabia (%)
Place of birth for the foreign-born population - Syria (%)
Place of birth for the foreign-born population - Turkey (%)
Place of birth for the foreign-born population - Yemen (%)
Place of birth for the foreign-born population - Other Western Asia (%)
Place of birth for the foreign-born population - Eritrea (%)
Place of birth for the foreign-born population - Ethiopia (%)
Place of birth for the foreign-born population - Kenya (%)
Place of birth for the foreign-born population - Somalia (%)
Place of birth for the foreign-born population - Uganda (%)
Place of birth for the foreign-born population - Zimbabwe (%)
Place of birth for the foreign-born population - Other Eastern Africa (%)
Place of birth for the foreign-born population - Cameroon (%)
Place of birth for the foreign-born population - Congo (%)
Place of birth for the foreign-born population - Democratic Republic of Congo (Zaire) (%)
Place of birth for the foreign-born population - Other Middle Africa (%)
Place of birth for the foreign-born population - Egypt (%)
Place of birth for the foreign-born population - Morocco (%)
Place of birth for the foreign-born population - Sudan (%)
Place of birth for the foreign-born population - Other Northern Africa (%)
Place of birth for the foreign-born population - South Africa (%)
Place of birth for the foreign-born population - Other Southern Africa (%)
Place of birth for the foreign-born population - Cabo Verde (%)
Place of birth for the foreign-born population - Ghana (%)
Place of birth for the foreign-born population - Liberia (%)
Place of birth for the foreign-born population - Nigeria (%)
Place of birth for the foreign-born population - Senegal (%)
Place of birth for the foreign-born population - Sierra Leone (%)
Place of birth for the foreign-born population - Other Western Africa (%)
Place of birth for the foreign-born population - Australia (%)
Place of birth for the foreign-born population - New Zealand (%)
Place of birth for the foreign-born population - Fiji (%)
Place of birth for the foreign-born population - Micronesia (%)
Place of birth for the foreign-born population - Bahamas (%)
Place of birth for the foreign-born population - Barbados (%)
Place of birth for the foreign-born population - Cuba (%)
Place of birth for the foreign-born population - Dominica (%)
Place of birth for the foreign-born population - Dominican Republic (%)
Place of birth for the foreign-born population - Grenada (%)
Place of birth for the foreign-born population - Haiti (%)
Place of birth for the foreign-born population - Jamaica (%)
Place of birth for the foreign-born population - St. Vincent and the Grenadines (%)
Place of birth for the foreign-born population - Trinidad and Tobago (%)
Place of birth for the foreign-born population - West Indies (%)
Place of birth for the foreign-born population - Other Caribbean (%)
Place of birth for the foreign-born population - Belize (%)
Place of birth for the foreign-born population - Costa Rica (%)
Place of birth for the foreign-born population - El Salvador (%)
Place of birth for the foreign-born population - Guatemala (%)
Place of birth for the foreign-born population - Honduras (%)
Place of birth for the foreign-born population - Mexico (%)
Place of birth for the foreign-born population - Nicaragua (%)
Place of birth for the foreign-born population - Panama (%)
Place of birth for the foreign-born population - Other Central America (%)
Place of birth for the foreign-born population - Argentina (%)
Place of birth for the foreign-born population - Bolivia (%)
Place of birth for the foreign-born population - Brazil (%)
Place of birth for the foreign-born population - Chile (%)
Place of birth for the foreign-born population - Colombia (%)
Place of birth for the foreign-born population - Ecuador (%)
Place of birth for the foreign-born population - Guyana (%)
Place of birth for the foreign-born population - Peru (%)
Place of birth for the foreign-born population - Uruguay (%)
Place of birth for the foreign-born population - Venezuela (%)
Place of birth for the foreign-born population - Other South America (%)
Place of birth for the foreign-born population - Canada (%)
Place of birth for the foreign-born population - Other Northern America (%)
Place of birth for the foreign-born population - Other (%)
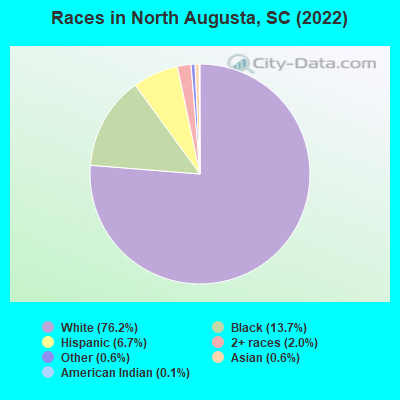
According to 2022 data, the most numerous races in North Augusta, SC are White alone (19,072 residents), Black alone (3,433 residents), and Hispanic (1,688 residents). 94.7% of North Augusta residents speak English at home. 3.1% of North Augusta, SC residents are foreign-born (1.9% born in Latin America, 1.1% born in Asia), which is 62.8% less than the foreign-born rate of 5.0% across the entire state of South Carolina.
Race distribution in North Augusta
2000 2022
2,652,291 66.1% White alone 1,178,486 29.4% Black alone 95,076 2.4% Hispanic 35,568 0.9% Asian alone 33,290 0.8% Two or more races 12,765 0.3% American Indian alone 3,266 0.08% Other race alone 1,270 0.03% Native Hawaiian and Other
3,301,739 62.5% White alone 1,313,290 24.9% Black alone 343,783 6.5% Hispanic 190,508 3.6% Two or more races 89,888 1.7% Asian alone 29,390 0.6% Other race alone 12,112 0.2% American Indian alone 1,924 0.04% Native Hawaiian and Other
Income and house value in North Augusta Median household income in 2022 $96,244 White non-Hispanic householders$70,119 Black householders$123,134 Asian householders$61,664 Two or more races householdersMedian 2022 house value $254,666 White Non-Hispanic householders$182,844 Black or African American householders $616,792 Asian householders$150,771 Some other race householders$372,542 Two or more races householders$352,531 Hispanic or Latino householders
Median age by race in North Augusta
43.0 Median age for White residents41.2 44.5 52.6 Median age for Black or African American residents64.0 46.3 41.7 Median age for American Indian / Alaska Native residents9.5 -504,009,163.3 65.4 Median age for Asian residents66.8 60.8 -662,650,601.7 Median age for Native Hawaiian / Pacific Islander residents-666,666,666.0 -666,666,666.0 40.6 Median age for Other race residents45.4 21.7 32.7 Median age for Two or more races residents27.6 43.0 42.8 Median age for White alone residents41.5 44.0 36.5 Median age for Hispanic or Latino residents27.5 45.0
Owner/renter occupied households by race in North Augusta
House owners and renters - White residents 6,935 79.3% Owner occupied1,812 20.7% Renter occupiedHouse owners and renters - Black or African American residents 958 54.0% Owner occupied816 46.0% Renter occupiedHouse owners and renters - American Indian / Alaska Native residents 11 100.0% Owner occupiedHouse owners and renters - Asian residents 37 52.8% Owner occupied33 47.2% Renter occupiedHouse owners and renters - Other race residents 66 30.2% Owner occupied152 69.8% Renter occupiedHouse owners and renters - Two or more races residents 307 75.5% Owner occupied99 24.5% Renter occupiedHouse owners and renters - White alone residents 6,813 80.9% Owner occupied1,613 19.1% Renter occupiedHouse owners and renters - Hispanic or Latino residents 284 34.9% Owner occupied530 65.1% Renter occupied
Language usage in North Augusta
English speakers - Total 94.7% of residents of North Augusta speak English at home.
3.9% of residents speak Spanish at home 673 72.4% Speak English very well257 27.6% Speak English less than very well1.0% of residents speak other language at home 159 63.9% Speak English very well90 36.1% Speak English less than very well
English speakers - Born in the United States 97.3% of residents of North Augusta speak English at home.
2.6% of residents speak Spanish at home 352 72.0% Speak English very well137 28.0% Speak English less than very well0.3% of residents speak other language at home 53 100.0% Speak English very well
English speakers - Native, born elsewhere 67.4% of residents of North Augusta speak English at home.
23.5% of residents speak Spanish at home 55 53.4% Speak English very well48 46.6% Speak English less than very well4.6% of residents speak other language at home 20 100.0% Speak English very well
English speakers - Foreign-born 19.4% of residents of North Augusta speak English at home.
69.8% of residents speak Spanish at home 305 73.7% Speak English very well109 26.3% Speak English less than very well29.8% of residents speak other language at home 67 37.9% Speak English very well110 62.1% Speak English less than very well
White (Caucasian) - Speak only English Native:
98.0% (17,667)Foreign-born:
42.9% (111)
White (Caucasian) - Speak another language Native:
1.3% (240)Foreign-born:
100.0% (259)
Asian - Speak only English Native:
95.1% (47)Foreign-born:
51.5% (42)
Other race - Speak only English Native:
83.4% (486)Foreign-born:
77.9% (2)
Other race - Speak another language Native:
23.0% (134)Foreign-born:
32.9% (1)
Two or more races - Speak only English Native:
86.3% (756)Foreign-born:
19.5% (28)
Two or more races - Speak another language Native:
3.9% (34)Foreign-born:
92.7% (133)
White alone - Speak only English Native:
97.7% (17,272)Foreign-born:
60.5% (118)
White alone - Speak another language Native:
1.7% (301)Foreign-born:
39.4% (77)
Hispanic or Latino - Speak only English Native:
77.4% (1,148)Foreign-born:
9.9% (24)
Hispanic or Latino - Speak another language Native:
20.3% (302)Foreign-born:
99.1% (240)
Foreign-born residents in North Augusta 769 residents are foreign born (1.9% Latin America , 1.1% Asia ).
This city:
3.1%South Carolina:
5.3%
Marital status for residents in North Augusta Marital status - White (Caucasian) population 15 years and over
Males 22.8% Never married59.4% Now married1.3% Separated3.4% Widowed13.1% DivorcedFemales 18.2% Never married52.4% Now married1.6% Separated11.4% Widowed16.5% DivorcedWomen who gave birth in the past 12 months Now married:
74.5% (206)Unmarried:
25.5% (70)
Women who did not give birth in the past 12 months Now married:
52.2% (2,172)Unmarried:
47.8% (1,990)
Marital status - Black or African American population 15 years and over
Males 27.8% Never married63.8% Now married2.4% Separated5.8% Widowed0.2% DivorcedFemales 37.9% Never married50.8% Now married0.3% Separated3.5% Widowed7.5% DivorcedWomen who gave birth in the past 12 months Now married:
100.0% (34)Unmarried:
0.0% (0)
Women who did not give birth in the past 12 months Now married:
22.7% (194)Unmarried:
77.3% (662)
Marital status - American Indian / Alaska Native population 15 years and over
Males 0.0% Never married0.0% Now married0.0% Separated0.0% Widowed100.0% DivorcedFemales 0.0% Never married100.0% Now married0.0% Separated0.0% Widowed0.0% DivorcedWomen who did not give birth in the past 12 months Now married:
100.0% (11)Unmarried:
0.0% (0)
Marital status - Asian population 15 years and over
Males 0.0% Never married100.0% Now married0.0% Separated0.0% Widowed0.0% DivorcedFemales 0.0% Never married60.9% Now married0.0% Separated0.0% Widowed39.1% DivorcedWomen who did not give birth in the past 12 months Now married:
43.3% (29)Unmarried:
56.7% (38)
Marital status - Other race population 15 years and over
Males 23.5% Never married66.3% Now married0.0% Separated0.0% Widowed10.2% DivorcedFemales 0.0% Never married18.8% Now married0.0% Separated41.3% Widowed40.0% DivorcedWomen who gave birth in the past 12 months Now married:
0.0% (0)Unmarried:
100.0% (20)
Marital status - Two or more races population 15 years and over
Males 51.0% Never married49.0% Now married0.0% Separated0.0% Widowed0.0% DivorcedFemales 52.9% Never married31.8% Now married2.4% Separated3.9% Widowed9.0% DivorcedWomen who did not give birth in the past 12 months Now married:
18.0% (45)Unmarried:
82.0% (206)
Marital status - White alone, not Hispanic / Latino population 15 years and over
Males 22.1% Never married60.5% Now married1.3% Separated3.6% Widowed12.5% DivorcedFemales 17.9% Never married53.3% Now married1.6% Separated11.8% Widowed15.4% DivorcedWomen who gave birth in the past 12 months Now married:
74.5% (211)Unmarried:
25.5% (72)
Women who did not give birth in the past 12 months Now married:
54.5% (2,181)Unmarried:
45.5% (1,822)
Marital status - Hispanic or Latino population 15 years and over
Males 34.7% Never married53.3% Now married0.0% Separated0.0% Widowed12.0% DivorcedFemales 32.8% Never married27.2% Now married1.2% Separated6.8% Widowed32.0% DivorcedWomen who gave birth in the past 12 months Now married:
44.4% (12)Unmarried:
55.6% (15)
Women who did not give birth in the past 12 months Now married:
21.5% (80)Unmarried:
78.5% (293)
Ancestries in North Augusta
3,094 22.7% American2,804 20.6% English904 6.6% German730 5.4% Irish412 3.0% European361 2.7% Italian283 2.1% Scottish217 1.6% Scotch-Irish121 0.9% French92 0.7% French Canadian78 0.6% Iranian73 0.5% Greek73 0.5% African55 0.4% British50 0.4% Norwegian50 0.4% Polish40 0.3% Swedish34 0.2% Dutch30 0.2% Romanian16 0.1% Bulgarian13 0.10% Scandinavian7 0.05% Portuguese5 0.04% Czechoslovakian1 0.01% Jamaican
Children Nativity (place of birth) in North Augusta
Children under 6 years - Living with two parents Both parents native 1,102 100.0% NativeBoth parents foreign-born 63 100.0% NativeOne native, one foreign-born parent 66 100.0% NativeChildren under 6 years - Living with one parent Native parent 314 100.0% NativeForeign-born parent 19 100.0% NativeChildren 6 to 17 years - Living with two parents Both parents native 2,150 100.0% NativeBoth parents foreign-born 43 100.0% NativeOne native, one foreign-born parent 111 100.0% NativeChildren 6 to 17 years - Living with one parent Native parent 598 100.0% NativeForeign-born parent 9 49.6% Native9 50.4% Foreign-born
Grandparents responsible for own grandchildren in North Augusta
Grandparents (30 to 59 years) White / Caucasian 6 100.0% Not responsible for grandchildrenBlack or African American 28 100.0% Responsible for grandchildrenWhite alone, not Hispanic / Latino 6 100.0% Not responsible for grandchildrenGrandparents (60 years and over) White / Caucasian 7 7.6% Responsible for grandchildren91 92.4% Not responsible for grandchildrenBlack or African American 49 100.0% Responsible for grandchildrenWhite alone, not Hispanic / Latino 8 8.0% Responsible for grandchildren87 92.0% Not responsible for grandchildren