Races in North Charleston, South Carolina (SC) Detailed Stats
Data:
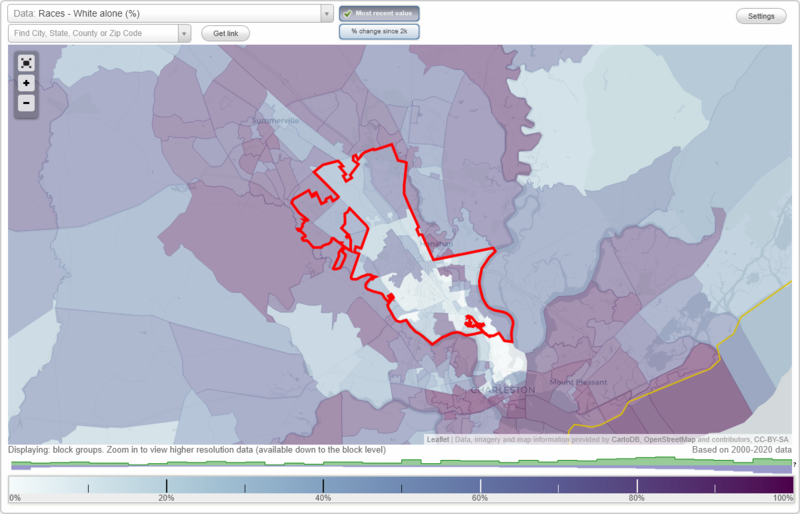
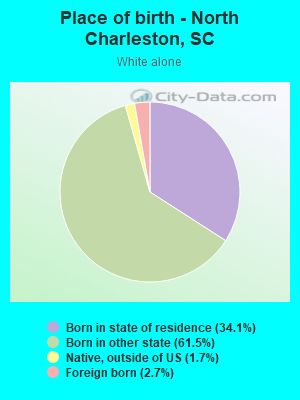
Races - White alone (%)
Races - White alone (% change since 2000)
Races - Black alone (%)
Races - Black alone (% change since 2000)
Races - American Indian alone (%)
Races - American Indian alone (% change since 2000)
Races - Asian alone (%)
Races - Asian alone (% change since 2000)
Races - Hispanic (%)
Races - Hispanic (% change since 2000)
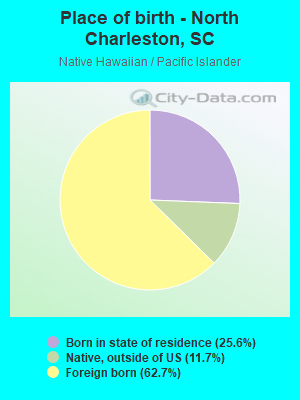
Races - Native Hawaiian and Other Pacific Islander alone (%)
Races - Native Hawaiian and Other Pacific Islander alone (% change since 2000)
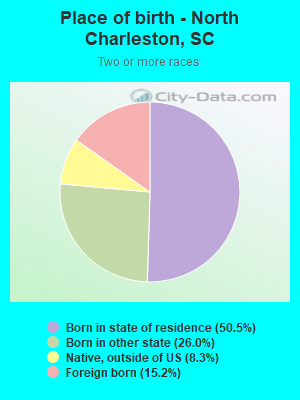
Races - Two or more races(%)
Races - Two or more races(% change since 2000)
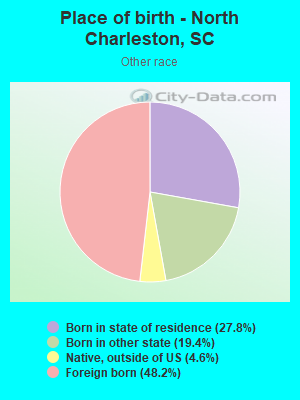
Races - Other race alone (%)
Races - Other race alone (% change since 2000)
Racial diversity
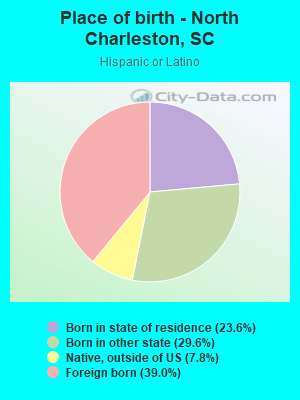
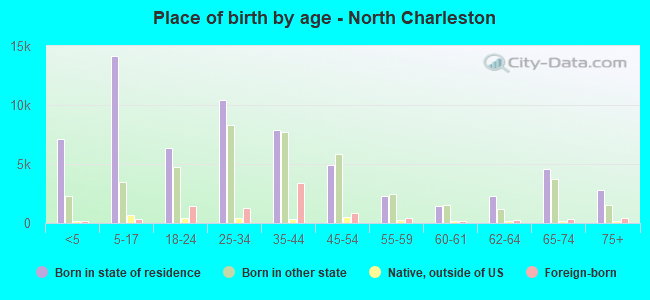
Place of birth - Born in state of residence (%)
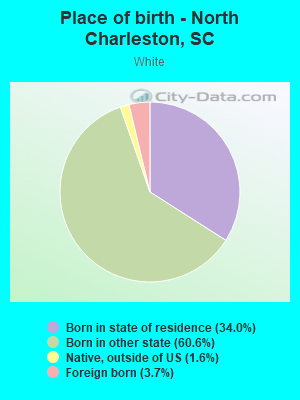
Place of birth - Born in state of residence (%) - White
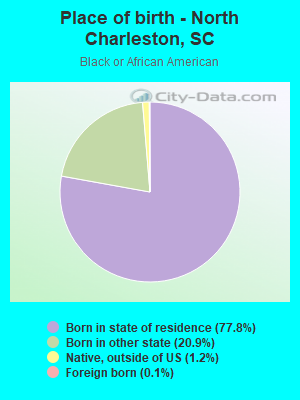
Place of birth - Born in state of residence (%) - Black or African American
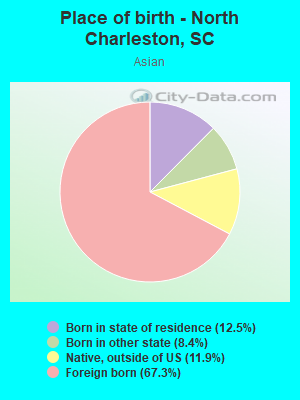
Place of birth - Born in state of residence (%) - Asian
Place of birth - Born in state of residence (%) - Hispanic or Latino
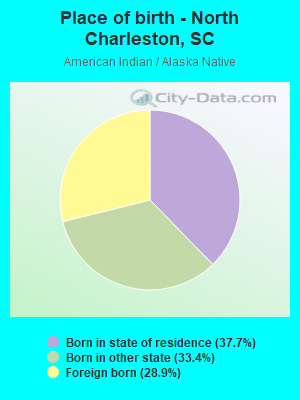
Place of birth - Born in state of residence (%) - American Indian and Alaska Native
Place of birth - Born in state of residence (%) - Multirace
Place of birth - Born in state of residence (%) - Other Race
Place of birth - Born in other state (%)
Place of birth - Born in other state (%) - White
Place of birth - Born in other state (%) - Black or African American
Place of birth - Born in other state (%) - Asian
Place of birth - Born in other state (%) - Hispanic or Latino
Place of birth - Born in other state (%) - American Indian and Alaska Native
Place of birth - Born in other state (%) - Multirace
Place of birth - Born in other state (%) - Other Race
Place of birth - Native, outside of US (%)
Place of birth - Native, outside of US (%) - White
Place of birth - Native, outside of US (%) - Black or African American
Place of birth - Native, outside of US (%) - Asian
Place of birth - Native, outside of US (%) - Hispanic or Latino
Place of birth - Native, outside of US (%) - American Indian and Alaska Native
Place of birth - Native, outside of US (%) - Multirace
Place of birth - Native, outside of US (%) - Other Race
Place of birth - Foreign born (%)
Place of birth - Foreign born (%) - White
Place of birth - Foreign born (%) - Black or African American
Place of birth - Foreign born (%) - Asian
Place of birth - Foreign born (%) - Hispanic or Latino
Place of birth - Foreign born (%) - American Indian and Alaska Native
Place of birth - Foreign born (%) - Multirace
Place of birth - Foreign born (%) - Other Race
Residents speaking English at home (%)
Residents speaking English at home - Born in the United States (%)
Residents speaking English at home - Native, born elsewhere (%)
Residents speaking English at home - Foreign born (%)
Residents speaking Spanish at home (%)
Residents speaking Spanish at home - Born in the United States (%)
Residents speaking Spanish at home - Native, born elsewhere (%)
Residents speaking Spanish at home - Foreign born (%)
Residents speaking other language at home (%)
Residents speaking other language at home - Born in the United States (%)
Residents speaking other language at home - Native, born elsewhere (%)
Residents speaking other language at home - Foreign born (%)
Marital status - Never married (%)
Marital status - Now married (%)
Marital status - Separated (%)
Marital status - Widowed (%)
Marital status - Divorced (%)
Ancestries Reported - Arab (%)
Ancestries Reported - Czech (%)
Ancestries Reported - Danish (%)
Ancestries Reported - Dutch (%)
Ancestries Reported - English (%)
Ancestries Reported - French (%)
Ancestries Reported - French Canadian (%)
Ancestries Reported - German (%)
Ancestries Reported - Greek (%)
Ancestries Reported - Hungarian (%)
Ancestries Reported - Irish (%)
Ancestries Reported - Italian (%)
Ancestries Reported - Lithuanian (%)
Ancestries Reported - Norwegian (%)
Ancestries Reported - Polish (%)
Ancestries Reported - Portuguese (%)
Ancestries Reported - Russian (%)
Ancestries Reported - Scotch-Irish (%)
Ancestries Reported - Scottish (%)
Ancestries Reported - Slovak (%)
Ancestries Reported - Subsaharan African (%)
Ancestries Reported - Swedish (%)
Ancestries Reported - Swiss (%)
Ancestries Reported - Ukrainian (%)
Ancestries Reported - United States (%)
Ancestries Reported - Welsh (%)
Ancestries Reported - West Indian (%)
Ancestries Reported - Other (%)
Geographical mobility - Same house 1 year ago (%)
Geographical mobility - Same house 1 year ago (%) - White
Geographical mobility - Same house 1 year ago (%) - Black or African American
Geographical mobility - Same house 1 year ago (%) - Asian
Geographical mobility - Same house 1 year ago (%) - Hispanic or Latino
Geographical mobility - Same house 1 year ago (%) - American Indian and Alaska Native
Geographical mobility - Same house 1 year ago (%) - Multirace
Geographical mobility - Same house 1 year ago (%) - Other Race
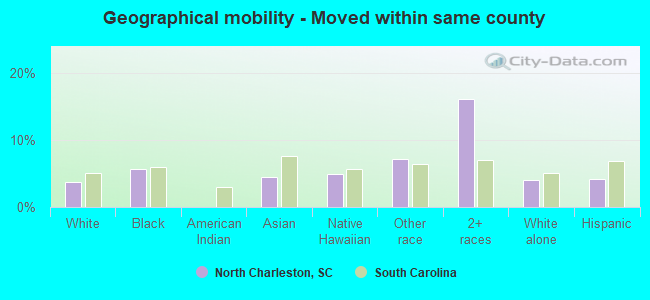
Geographical mobility - Moved within same county (%)
Geographical mobility - Moved within same county (%) - White
Geographical mobility - Moved within same county (%) - Black or African American
Geographical mobility - Moved within same county (%) - Asian
Geographical mobility - Moved within same county (%) - Hispanic or Latino
Geographical mobility - Moved within same county (%) - American Indian and Alaska Native
Geographical mobility - Moved within same county (%) - Multirace
Geographical mobility - Moved within same county (%) - Other Race
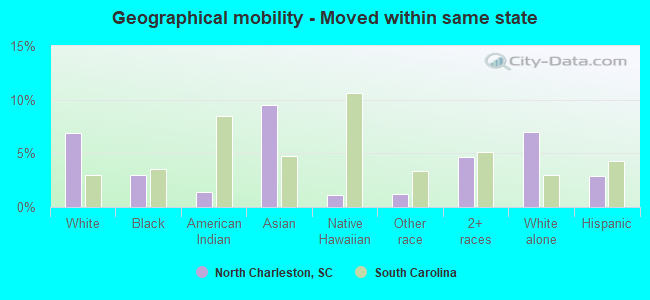
Geographical mobility - Moved from different county within same state (%)
Geographical mobility - Moved from different county within same state (%) - White
Geographical mobility - Moved from different county within same state (%) - Black or African American
Geographical mobility - Moved from different county within same state (%) - Asian
Geographical mobility - Moved from different county within same state (%) - Hispanic or Latino
Geographical mobility - Moved from different county within same state (%) - American Indian and Alaska Native
Geographical mobility - Moved from different county within same state (%) - Multirace
Geographical mobility - Moved from different county within same state (%) - Other Race
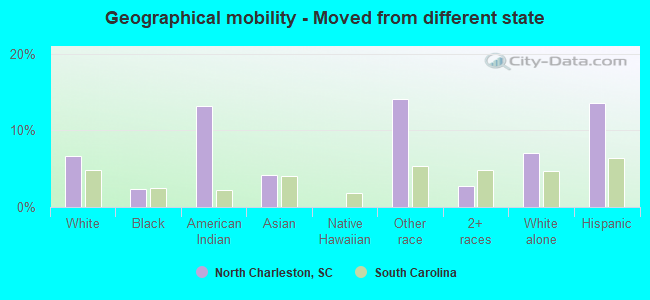
Geographical mobility - Moved from different state (%)
Geographical mobility - Moved from different state (%) - White
Geographical mobility - Moved from different state (%) - Black or African American
Geographical mobility - Moved from different state (%) - Asian
Geographical mobility - Moved from different state (%) - Hispanic or Latino
Geographical mobility - Moved from different state (%) - American Indian and Alaska Native
Geographical mobility - Moved from different state (%) - Multirace
Geographical mobility - Moved from different state (%) - Other Race
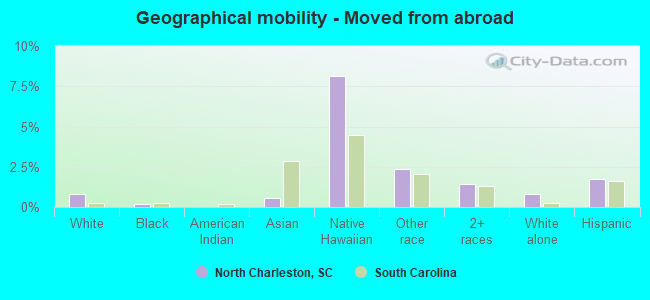
Geographical mobility - Moved from abroad (%)
Geographical mobility - Moved from abroad (%) - White
Geographical mobility - Moved from abroad (%) - Black or African American
Geographical mobility - Moved from abroad (%) - Asian
Geographical mobility - Moved from abroad (%) - Hispanic or Latino
Geographical mobility - Moved from abroad (%) - American Indian and Alaska Native
Geographical mobility - Moved from abroad (%) - Multirace
Geographical mobility - Moved from abroad (%) - Other Race
Place of birth for the foreign-born population - Ireland (%)
Place of birth for the foreign-born population - Denmark (%)
Place of birth for the foreign-born population - Norway (%)
Place of birth for the foreign-born population - Sweden (%)
Place of birth for the foreign-born population - United Kingdom (%)
Place of birth for the foreign-born population - England (%)
Place of birth for the foreign-born population - Scotland (%)
Place of birth for the foreign-born population - Other Northern Europe (%)
Place of birth for the foreign-born population - Austria (%)
Place of birth for the foreign-born population - Belgium (%)
Place of birth for the foreign-born population - France (%)
Place of birth for the foreign-born population - Germany (%)
Place of birth for the foreign-born population - Netherlands (%)
Place of birth for the foreign-born population - Switzerland (%)
Place of birth for the foreign-born population - Other Western Europe (%)
Place of birth for the foreign-born population - Greece (%)
Place of birth for the foreign-born population - Italy (%)
Place of birth for the foreign-born population - Portugal (%)
Place of birth for the foreign-born population - Spain (%)
Place of birth for the foreign-born population - Other Southern Europe (%)
Place of birth for the foreign-born population - Albania (%)
Place of birth for the foreign-born population - Belarus (%)
Place of birth for the foreign-born population - Bosnia and Herzegovina (%)
Place of birth for the foreign-born population - Bulgaria (%)
Place of birth for the foreign-born population - Croatia (%)
Place of birth for the foreign-born population - Czechoslovakia (%)
Place of birth for the foreign-born population - Hungary (%)
Place of birth for the foreign-born population - Latvia (%)
Place of birth for the foreign-born population - Lithuania (%)
Place of birth for the foreign-born population - North Macedonia (Macedonia) (%)
Place of birth for the foreign-born population - Moldova (%)
Place of birth for the foreign-born population - Poland (%)
Place of birth for the foreign-born population - Romania (%)
Place of birth for the foreign-born population - Russia (%)
Place of birth for the foreign-born population - Serbia (%)
Place of birth for the foreign-born population - Ukraine (%)
Place of birth for the foreign-born population - Other Eastern Europe (%)
Place of birth for the foreign-born population - China (%)
Place of birth for the foreign-born population - Hong Kong (%)
Place of birth for the foreign-born population - Taiwan (%)
Place of birth for the foreign-born population - Japan (%)
Place of birth for the foreign-born population - Korea (%)
Place of birth for the foreign-born population - Other Eastern Asia (%)
Place of birth for the foreign-born population - Afghanistan (%)
Place of birth for the foreign-born population - Bangladesh (%)
Place of birth for the foreign-born population - India (%)
Place of birth for the foreign-born population - Iran (%)
Place of birth for the foreign-born population - Kazakhstan (%)
Place of birth for the foreign-born population - Nepal (%)
Place of birth for the foreign-born population - Pakistan (%)
Place of birth for the foreign-born population - Sri Lanka (%)
Place of birth for the foreign-born population - Uzbekistan (%)
Place of birth for the foreign-born population - Other South Central Asia (%)
Place of birth for the foreign-born population - Burma (%)
Place of birth for the foreign-born population - Cambodia (%)
Place of birth for the foreign-born population - Indonesia (%)
Place of birth for the foreign-born population - Laos (%)
Place of birth for the foreign-born population - Malaysia (%)
Place of birth for the foreign-born population - Philippines (%)
Place of birth for the foreign-born population - Singapore (%)
Place of birth for the foreign-born population - Thailand (%)
Place of birth for the foreign-born population - Vietnam (%)
Place of birth for the foreign-born population - Other South Eastern Asia (%)
Place of birth for the foreign-born population - Armenia (%)
Place of birth for the foreign-born population - Iraq (%)
Place of birth for the foreign-born population - Israel (%)
Place of birth for the foreign-born population - Jordan (%)
Place of birth for the foreign-born population - Kuwait (%)
Place of birth for the foreign-born population - Lebanon (%)
Place of birth for the foreign-born population - Saudi Arabia (%)
Place of birth for the foreign-born population - Syria (%)
Place of birth for the foreign-born population - Turkey (%)
Place of birth for the foreign-born population - Yemen (%)
Place of birth for the foreign-born population - Other Western Asia (%)
Place of birth for the foreign-born population - Eritrea (%)
Place of birth for the foreign-born population - Ethiopia (%)
Place of birth for the foreign-born population - Kenya (%)
Place of birth for the foreign-born population - Somalia (%)
Place of birth for the foreign-born population - Uganda (%)
Place of birth for the foreign-born population - Zimbabwe (%)
Place of birth for the foreign-born population - Other Eastern Africa (%)
Place of birth for the foreign-born population - Cameroon (%)
Place of birth for the foreign-born population - Congo (%)
Place of birth for the foreign-born population - Democratic Republic of Congo (Zaire) (%)
Place of birth for the foreign-born population - Other Middle Africa (%)
Place of birth for the foreign-born population - Egypt (%)
Place of birth for the foreign-born population - Morocco (%)
Place of birth for the foreign-born population - Sudan (%)
Place of birth for the foreign-born population - Other Northern Africa (%)
Place of birth for the foreign-born population - South Africa (%)
Place of birth for the foreign-born population - Other Southern Africa (%)
Place of birth for the foreign-born population - Cabo Verde (%)
Place of birth for the foreign-born population - Ghana (%)
Place of birth for the foreign-born population - Liberia (%)
Place of birth for the foreign-born population - Nigeria (%)
Place of birth for the foreign-born population - Senegal (%)
Place of birth for the foreign-born population - Sierra Leone (%)
Place of birth for the foreign-born population - Other Western Africa (%)
Place of birth for the foreign-born population - Australia (%)
Place of birth for the foreign-born population - New Zealand (%)
Place of birth for the foreign-born population - Fiji (%)
Place of birth for the foreign-born population - Micronesia (%)
Place of birth for the foreign-born population - Bahamas (%)
Place of birth for the foreign-born population - Barbados (%)
Place of birth for the foreign-born population - Cuba (%)
Place of birth for the foreign-born population - Dominica (%)
Place of birth for the foreign-born population - Dominican Republic (%)
Place of birth for the foreign-born population - Grenada (%)
Place of birth for the foreign-born population - Haiti (%)
Place of birth for the foreign-born population - Jamaica (%)
Place of birth for the foreign-born population - St. Vincent and the Grenadines (%)
Place of birth for the foreign-born population - Trinidad and Tobago (%)
Place of birth for the foreign-born population - West Indies (%)
Place of birth for the foreign-born population - Other Caribbean (%)
Place of birth for the foreign-born population - Belize (%)
Place of birth for the foreign-born population - Costa Rica (%)
Place of birth for the foreign-born population - El Salvador (%)
Place of birth for the foreign-born population - Guatemala (%)
Place of birth for the foreign-born population - Honduras (%)
Place of birth for the foreign-born population - Mexico (%)
Place of birth for the foreign-born population - Nicaragua (%)
Place of birth for the foreign-born population - Panama (%)
Place of birth for the foreign-born population - Other Central America (%)
Place of birth for the foreign-born population - Argentina (%)
Place of birth for the foreign-born population - Bolivia (%)
Place of birth for the foreign-born population - Brazil (%)
Place of birth for the foreign-born population - Chile (%)
Place of birth for the foreign-born population - Colombia (%)
Place of birth for the foreign-born population - Ecuador (%)
Place of birth for the foreign-born population - Guyana (%)
Place of birth for the foreign-born population - Peru (%)
Place of birth for the foreign-born population - Uruguay (%)
Place of birth for the foreign-born population - Venezuela (%)
Place of birth for the foreign-born population - Other South America (%)
Place of birth for the foreign-born population - Canada (%)
Place of birth for the foreign-born population - Other Northern America (%)
Place of birth for the foreign-born population - Other (%)
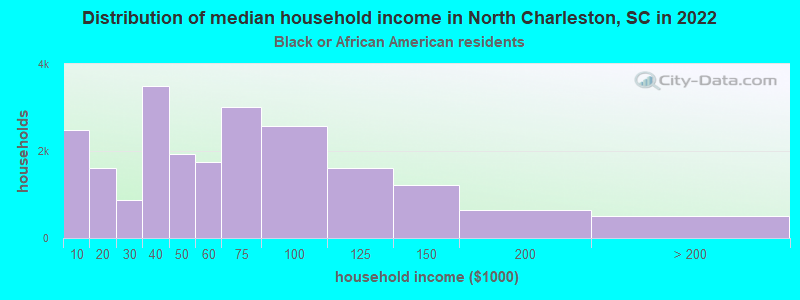
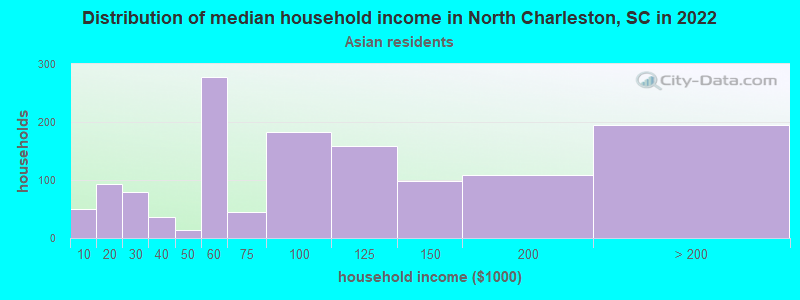
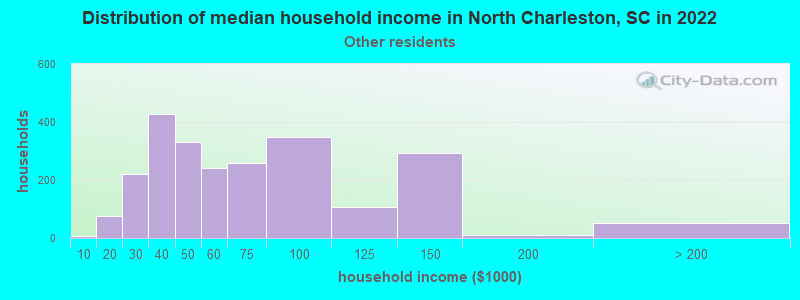
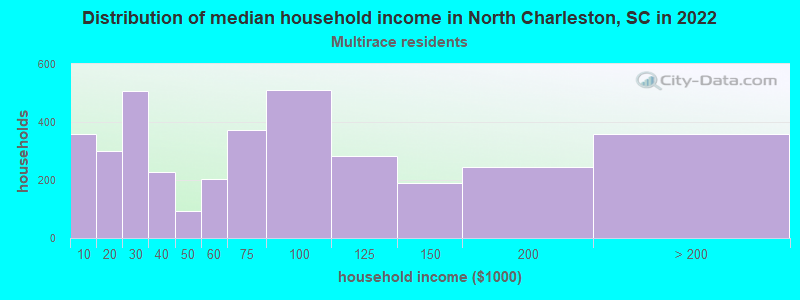
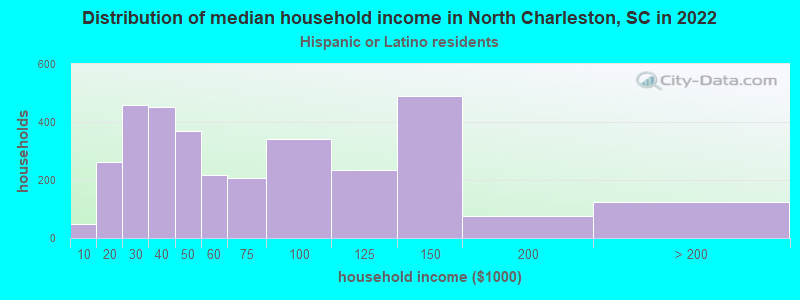
According to 2022 data, the most numerous races in North Charleston, SC are White alone (43,474 residents), Black alone (54,031 residents), and Hispanic (10,421 residents). 88.9% of North Charleston residents speak English at home. 10.4% of North Charleston, SC residents are foreign-born (6.0% born in Latin America, 2.7% born in Asia, 1.0% born in Europe), which is 51.9% greater than the foreign-born rate of 5.0% across the entire state of South Carolina.
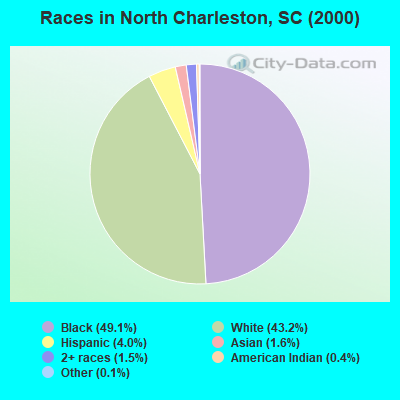
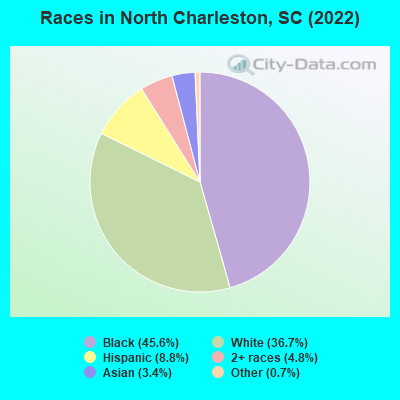
Race distribution in North Charleston
2000 2022
39,096 49.1% Black alone 34,443 43.2% White alone 3,163 4.0% Hispanic 1,245 1.6% Asian alone 1,234 1.5% Two or more races 290 0.4% American Indian alone 116 0.1% Other race alone 54 0.07% Native Hawaiian and Other
54,031 45.6% Black alone 43,474 36.7% White alone 10,421 8.8% Hispanic 5,733 4.8% Two or more races 4,079 3.4% Asian alone 800 0.7% Other race alone 66 0.06% American Indian alone
2000 2022
2,652,291 66.1% White alone 1,178,486 29.4% Black alone 95,076 2.4% Hispanic 35,568 0.9% Asian alone 33,290 0.8% Two or more races 12,765 0.3% American Indian alone 3,266 0.08% Other race alone 1,270 0.03% Native Hawaiian and Other
3,301,739 62.5% White alone 1,313,290 24.9% Black alone 343,783 6.5% Hispanic 190,508 3.6% Two or more races 89,888 1.7% Asian alone 29,390 0.6% Other race alone 12,112 0.2% American Indian alone 1,924 0.04% Native Hawaiian and Other
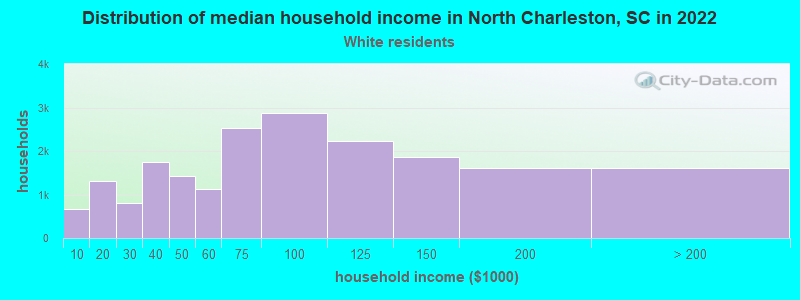
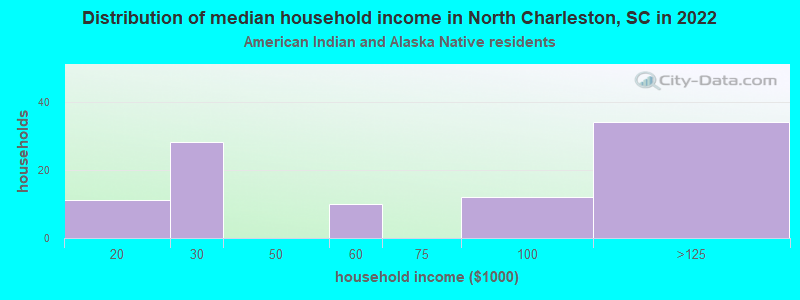
Income and house value in North Charleston Median household income in 2022 $76,529 White non-Hispanic householders$51,129 Black householders$80,385 Asian householders$78,797 Some other race householders$35,349 Two or more races householders$65,503 Hispanic or Latino race householdersMedian 2022 house value $389,217 White Non-Hispanic householders$313,590 Black or African American householders$471,107 American Indian or Alaska Native householders $412,339 Asian householders$438,833 Some other race householders$244,706 Two or more races householders$424,382 Hispanic or Latino householders
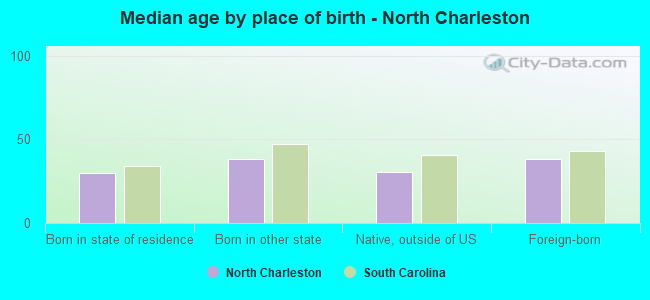
Median age by race in North Charleston
35.7 Median age for White residents35.3 35.9 32.6 Median age for Black or African American residents31.1 36.2 14.9 Median age for American Indian / Alaska Native residents-666,666,666.0 18.0 36.3 Median age for Asian residents36.2 38.2 -666,666,666.0 Median age for Native Hawaiian / Pacific Islander residents-666,666,666.0 -666,666,666.0 20.7 Median age for Other race residents26.9 16.5 30.7 Median age for Two or more races residents24.7 35.0 36.4 Median age for White alone residents35.5 37.5 19.0 Median age for Hispanic or Latino residents21.0 14.8
Owner/renter occupied households by race in North Charleston
House owners and renters - White residents 11,273 57.0% Owner occupied8,494 43.0% Renter occupiedHouse owners and renters - Black or African American residents 7,648 35.2% Owner occupied14,083 64.8% Renter occupiedHouse owners and renters - American Indian / Alaska Native residents 33 46.7% Owner occupied38 53.3% Renter occupiedHouse owners and renters - Asian residents 878 82.9% Owner occupied181 17.1% Renter occupiedHouse owners and renters - Native Hawaiian / Pacific Islander residents 22 21.0% Owner occupied83 79.0% Renter occupiedHouse owners and renters - Other race residents 808 66.8% Owner occupied401 33.2% Renter occupiedHouse owners and renters - Two or more races residents 1,414 40.2% Owner occupied2,104 59.8% Renter occupiedHouse owners and renters - White alone residents 10,955 56.8% Owner occupied8,343 43.2% Renter occupiedHouse owners and renters - Hispanic or Latino residents 1,122 47.8% Owner occupied1,227 52.2% Renter occupied
Language usage in North Charleston
English speakers - Total 88.9% of residents of North Charleston speak English at home.
6.7% of residents speak Spanish at home 3,604 49.6% Speak English very well3,666 50.4% Speak English less than very well4.5% of residents speak other language at home 3,764 77.2% Speak English very well1,109 22.8% Speak English less than very well
English speakers - Born in the United States 93.8% of residents of North Charleston speak English at home.
5.0% of residents speak Spanish at home 1,869 92.8% Speak English very well145 7.2% Speak English less than very well1.2% of residents speak other language at home 394 78.5% Speak English very well108 21.5% Speak English less than very well
English speakers - Native, born elsewhere 68.4% of residents of North Charleston speak English at home.
22.4% of residents speak Spanish at home 503 81.3% Speak English very well116 18.7% Speak English less than very well9.1% of residents speak other language at home 252 100.0% Speak English very well
English speakers - Foreign-born 22.8% of residents of North Charleston speak English at home.
39.8% of residents speak Spanish at home 618 17.8% Speak English very well2,860 82.2% Speak English less than very well37.5% of residents speak other language at home 2,358 71.9% Speak English very well920 28.1% Speak English less than very well
White (Caucasian) - Speak only English Native:
95.1% (38,505)Foreign-born:
23.0% (395)
White (Caucasian) - Speak another language Native:
4.9% (2,005)Foreign-born:
77.0% (1,324)
Black or African American - Speak only English Native:
98.8% (46,696)Foreign-born:
27.3% (217)
Black or African American - Speak another language Native:
1.1% (535)Foreign-born:
86.2% (685)
American Indian / Alaska Native - Speak only English Native:
56.4% (100)Foreign-born:
17.3% (12)
American Indian / Alaska Native - Speak another language Native:
48.5% (86)Foreign-born:
80.7% (56)
Asian - Speak only English Native:
48.8% (614)Foreign-born:
20.7% (568)
Asian - Speak another language Native:
51.2% (645)Foreign-born:
79.3% (2,176)
Native Hawaiian / Pacific Islander - Speak only English Native:
56.9% (52)Foreign-born:
26.9% (52)
Native Hawaiian / Pacific Islander - Speak another language Native:
43.5% (40)Foreign-born:
72.7% (139)
Other race - Speak only English Native:
42.9% (974)Foreign-born:
17.3% (470)
Other race - Speak another language Native:
57.1% (1,299)Foreign-born:
82.7% (2,248)
Two or more races - Speak only English Native:
81.1% (4,690)Foreign-born:
40.4% (509)
Two or more races - Speak another language Native:
18.9% (1,095)Foreign-born:
59.6% (750)
White alone - Speak only English Native:
97.1% (38,249)Foreign-born:
33.2% (395)
White alone - Speak another language Native:
2.9% (1,153)Foreign-born:
66.8% (795)
Hispanic or Latino - Speak only English Native:
38.8% (1,671)Foreign-born:
13.7% (559)
Hispanic or Latino - Speak another language Native:
61.2% (2,632)Foreign-born:
86.3% (3,510)
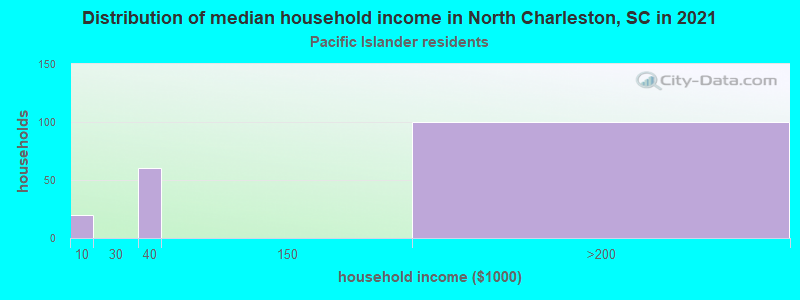
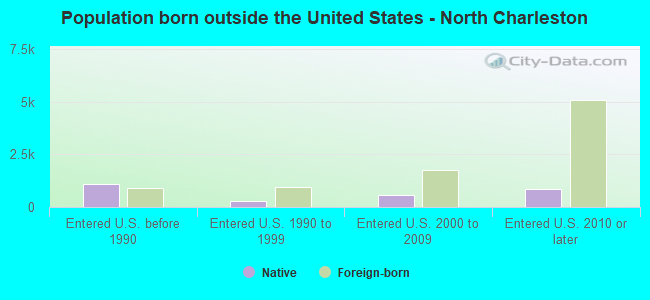
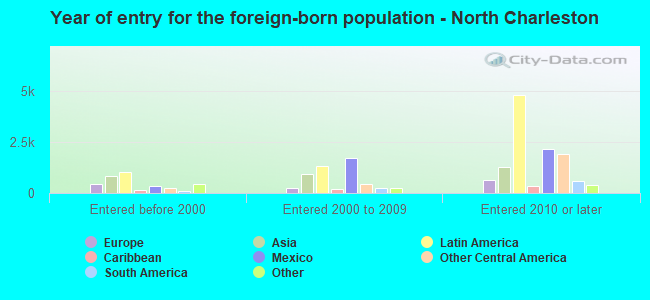
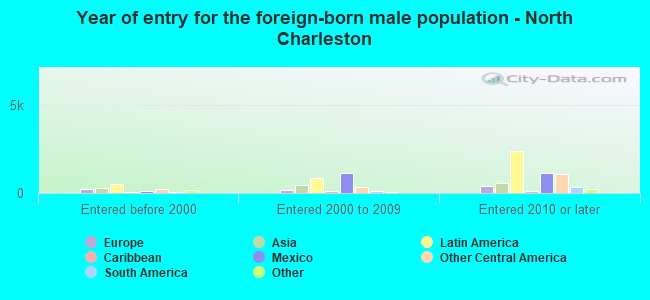
Foreign-born residents in North Charleston 12,310 residents are foreign born (6.0% Latin America , 2.7% Asia , 1.0% Europe ).
This city:
10.4%South Carolina:
5.3%
Marital status for residents in North Charleston Marital status - White (Caucasian) population 15 years and over
Males 37.9% Never married48.2% Now married0.6% Separated1.1% Widowed12.2% DivorcedFemales 27.6% Never married49.1% Now married0.5% Separated6.8% Widowed16.0% DivorcedWomen who gave birth in the past 12 months Now married:
83.7% (751)Unmarried:
16.3% (146)
Women who did not give birth in the past 12 months Now married:
46.8% (5,220)Unmarried:
53.2% (5,929)
Marital status - Black or African American population 15 years and over
Males 59.2% Never married22.9% Now married1.8% Separated1.5% Widowed14.5% DivorcedFemales 49.0% Never married23.8% Now married4.2% Separated7.4% Widowed15.6% DivorcedWomen who gave birth in the past 12 months Now married:
10.3% (68)Unmarried:
89.7% (591)
Women who did not give birth in the past 12 months Now married:
19.2% (2,446)Unmarried:
80.8% (10,262)
Marital status - American Indian / Alaska Native population 15 years and over
Males 43.5% Never married45.2% Now married0.0% Separated11.3% Widowed0.0% DivorcedFemales 69.4% Never married30.6% Now married0.0% Separated0.0% Widowed0.0% DivorcedWomen who did not give birth in the past 12 months Now married:
26.1% (16)Unmarried:
73.9% (47)
Marital status - Asian population 15 years and over
Males 27.5% Never married59.4% Now married3.8% Separated3.0% Widowed6.4% DivorcedFemales 18.2% Never married60.7% Now married3.4% Separated7.7% Widowed9.9% DivorcedWomen who gave birth in the past 12 months Now married:
8.3% (1)Unmarried:
91.7% (12)
Women who did not give birth in the past 12 months Now married:
67.7% (935)Unmarried:
32.3% (447)
Marital status - Native Hawaiian / Pacific Islander population 15 years and over
Males 38.4% Never married61.6% Now married0.0% Separated0.0% Widowed0.0% DivorcedFemales 78.6% Never married12.3% Now married0.0% Separated0.0% Widowed9.1% DivorcedWomen who gave birth in the past 12 months Now married:
100.0% (20)Unmarried:
0.0% (0)
Women who did not give birth in the past 12 months Now married:
0.0% (0)Unmarried:
100.0% (127)
Marital status - Other race population 15 years and over
Males 50.5% Never married45.8% Now married1.9% Separated0.0% Widowed1.7% DivorcedFemales 49.0% Never married46.9% Now married2.9% Separated0.0% Widowed1.2% DivorcedWomen who gave birth in the past 12 months Now married:
34.0% (43)Unmarried:
66.0% (84)
Women who did not give birth in the past 12 months Now married:
45.2% (802)Unmarried:
54.8% (973)
Marital status - Two or more races population 15 years and over
Males 46.0% Never married43.8% Now married0.0% Separated0.0% Widowed10.2% DivorcedFemales 25.4% Never married30.9% Now married23.6% Separated10.3% Widowed9.8% DivorcedWomen who gave birth in the past 12 months Now married:
19.9% (53)Unmarried:
80.1% (214)
Women who did not give birth in the past 12 months Now married:
41.1% (701)Unmarried:
58.9% (1,005)
Marital status - White alone, not Hispanic / Latino population 15 years and over
Males 37.1% Never married48.4% Now married0.6% Separated1.2% Widowed12.7% DivorcedFemales 27.1% Never married49.0% Now married0.3% Separated7.0% Widowed16.5% DivorcedWomen who gave birth in the past 12 months Now married:
83.7% (751)Unmarried:
16.3% (146)
Women who did not give birth in the past 12 months Now married:
46.4% (4,933)Unmarried:
53.6% (5,694)
Marital status - Hispanic or Latino population 15 years and over
Males 50.6% Never married43.9% Now married2.1% Separated0.0% Widowed3.4% DivorcedFemales 43.8% Never married46.9% Now married3.4% Separated2.2% Widowed3.8% DivorcedWomen who gave birth in the past 12 months Now married:
48.4% (130)Unmarried:
51.6% (139)
Women who did not give birth in the past 12 months Now married:
48.1% (1,236)Unmarried:
51.9% (1,336)
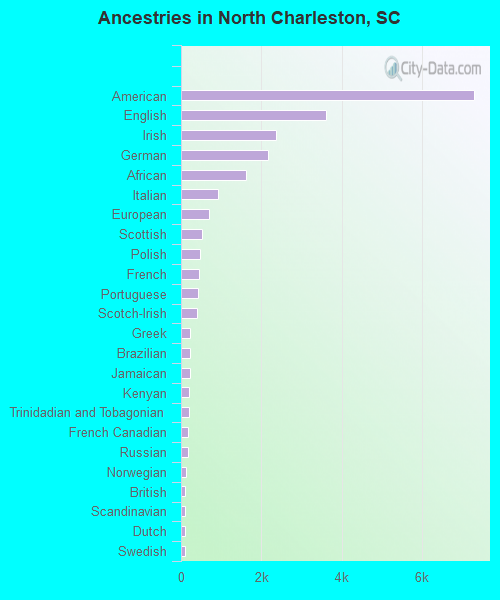
Ancestries in North Charleston
7,310 9.5% American3,617 4.7% English2,358 3.1% Irish2,163 2.8% German1,616 2.1% African934 1.2% Italian697 0.9% European530 0.7% Scottish474 0.6% Polish456 0.6% French425 0.6% Portuguese389 0.5% Scotch-Irish235 0.3% Greek234 0.3% Brazilian222 0.3% Jamaican208 0.3% Kenyan194 0.3% Trinidadian and Tobagonian182 0.2% French Canadian165 0.2% Russian124 0.2% Norwegian110 0.1% British107 0.1% Scandinavian98 0.1% Dutch90 0.1% Swedish46 0.06% Ghanaian42 0.05% Finnish40 0.05% Romanian39 0.05% Ukrainian34 0.04% Hungarian34 0.04% Welsh29 0.04% Ethiopian29 0.04% Swiss28 0.04% Canadian25 0.03% Iranian24 0.03% Austrian23 0.03% Haitian20 0.03% Egyptian20 0.03% Lebanese18 0.02% Czech18 0.02% Slovak15 0.02% Latvian13 0.02% Iraqi11 0.01% Eastern European10 0.01% Serbian10 0.01% Turkish8 0.01% Slavic4 0.01% Danish
Geographical mobility in North Charleston Same house 1 year ago 36,745 81.8% White (Caucasian)47,963 88.8% Black or African American201 84.0% American Indian / Alaska Native3,367 82.5% Asian239 83.1% Native Hawaiian / Pacific Islander5,502 78.4% Other race6,202 75.1% Two or more races34,480 81.1% White alone, not Hispanic / Latino9,074 74.5% Hispanic or LatinoMoved within same county 1,696 3.8% White / Caucasian3,093 5.7% Black or African American180 4.4% Asian14 4.9% Native Hawaiian / Pacific Islander499 7.1% Other race1,323 16.0% Two or more races1,696 4.0% White alone, not Hispanic / Latino514 4.2% Hispanic or LatinoMoved within same state 3,090 6.9% White / Caucasian1,601 3.0% Black or African American3 1.4% American Indian / Alaska Native389 9.5% Asian3 1.2% Native Hawaiian / Pacific Islander85 1.2% Other race385 4.7% Two or more races2,974 7.0% White alone, not Hispanic / Latino349 2.9% Hispanic or LatinoMoved from different state 3,012 6.7% White / Caucasian1,242 2.3% Black or African American31 13.2% American Indian / Alaska Native172 4.2% Asian984 14.0% Other race227 2.8% Two or more races3,012 7.1% White alone, not Hispanic / Latino1,656 13.6% Hispanic or LatinoMoved from abroad 356 0.8% White92 0.2% Black or African American22 0.6% Asian23 8.1% Native Hawaiian / Pacific Islander165 2.3% Other race116 1.4% Two or more races356 0.8% White alone, not Hispanic / Latino211 1.7% Hispanic or Latino
Children Nativity (place of birth) in North Charleston
Children under 6 years - Living with two parents Both parents native 3,074 100.0% NativeBoth parents foreign-born 736 90.4% Native78 9.6% Foreign-bornOne native, one foreign-born parent 396 100.0% NativeChildren under 6 years - Living with one parent Native parent 3,129 100.0% NativeForeign-born parent 678 99.9% Native1 0.1% Foreign-bornChildren 6 to 17 years - Living with two parents Both parents native 5,482 98.9% Native63 1.1% Foreign-bornBoth parents foreign-born 1,204 74.0% Native423 26.0% Foreign-bornOne native, one foreign-born parent 1,236 95.2% Native62 4.8% Foreign-bornChildren 6 to 17 years - Living with one parent Native parent 6,547 100.0% NativeForeign-born parent 822 60.0% Native547 40.0% Foreign-born
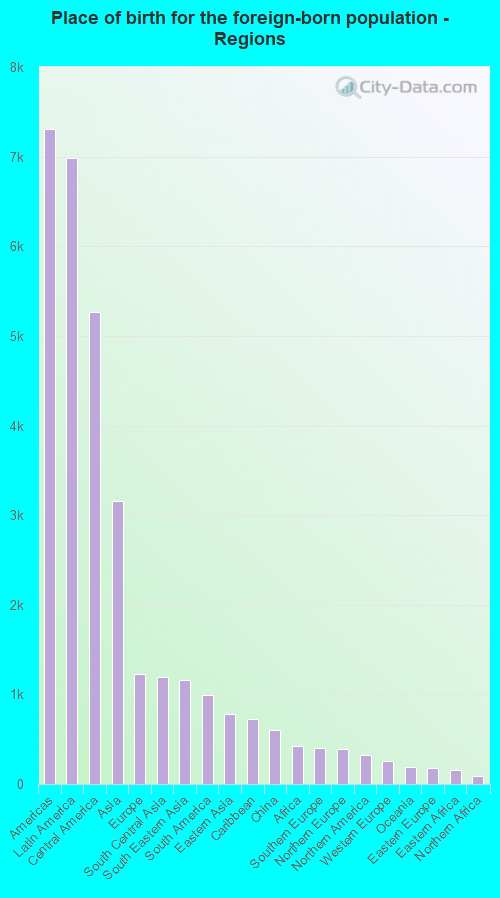
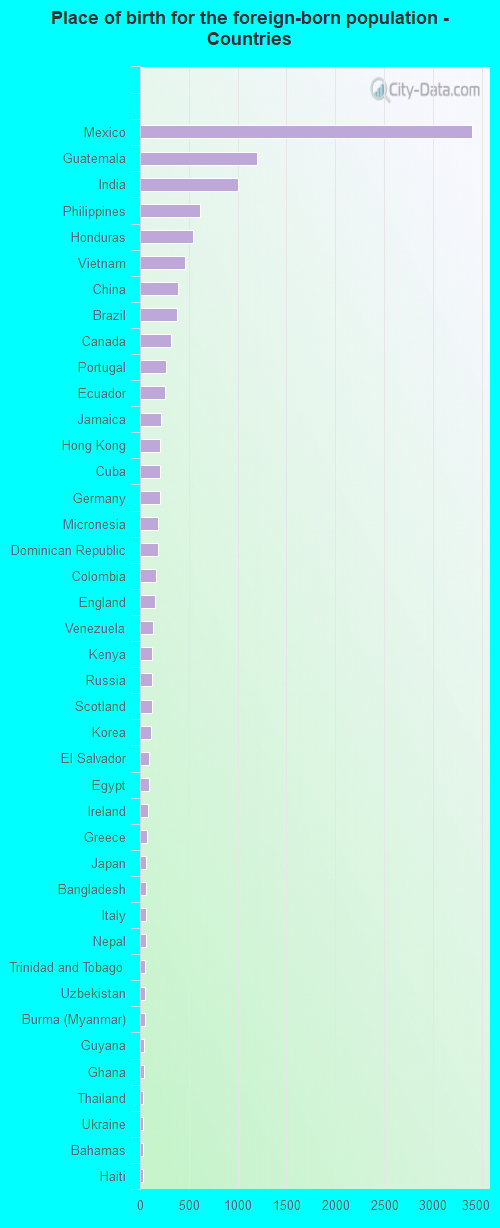
Place of birth for residents in North Charleston 7,308 Americas6,988 Latin America5,267 Central America3,159 Asia1,229 Europe1,197 South Central Asia1,156 South Eastern Asia996 South America786 Eastern Asia724 Caribbean606 China424 Africa399 Southern Europe389 Northern Europe319 Northern America258 Western Europe188 Oceania182 Eastern Europe156 Eastern Africa91 Northern Africa66 Western Africa19 Western Asia3,405 Mexico1,196 Guatemala1,007 India611 Philippines540 Honduras460 Vietnam393 China376 Brazil319 Canada267 Portugal256 Ecuador214 Jamaica206 Hong Kong204 Cuba202 Germany188 Micronesia185 Dominican Republic166 Colombia155 England133 Venezuela128 Kenya120 Russia120 Scotland117 Korea92 El Salvador91 Egypt79 Ireland71 Greece62 Japan61 Bangladesh60 Italy58 Nepal56 Trinidad and Tobago51 Uzbekistan49 Burma (Myanmar)44 Guyana40 Ghana35 Thailand33 Ukraine32 Bahamas31 Haiti28 Ethiopia26 Nigeria25 France22 Costa Rica19 Peru18 Sweden18 Netherlands16 Kazakhstan16 Serbia12 Belarus12 Austria11 Saudi Arabia11 Panama9 United Kingdom8 Iraq6 Denmark6 Taiwan1 Sri Lanka
Grandparents responsible for own grandchildren in North Charleston
Grandparents (30 to 59 years) White / Caucasian 111 59.0% Responsible for grandchildren77 41.0% Not responsible for grandchildrenBlack or African American 302 55.8% Responsible for grandchildren239 44.2% Not responsible for grandchildrenAsian 1 9.5% Responsible for grandchildren7 90.5% Not responsible for grandchildrenOther race 87 100.0% Responsible for grandchildrenTwo or more races 41 38.9% Responsible for grandchildren64 61.1% Not responsible for grandchildrenWhite alone, not Hispanic / Latino 112 59.5% Responsible for grandchildren76 40.5% Not responsible for grandchildrenHispanic or Latino 48 51.8% Responsible for grandchildren45 48.2% Not responsible for grandchildrenGrandparents (60 years and over) White / Caucasian 77 29.6% Responsible for grandchildren184 70.4% Not responsible for grandchildrenBlack or African American 393 38.1% Responsible for grandchildren638 61.9% Not responsible for grandchildrenAsian 20 28.5% Responsible for grandchildren51 71.5% Not responsible for grandchildrenTwo or more races 15 100.0% Not responsible for grandchildrenWhite alone, not Hispanic / Latino 78 29.2% Responsible for grandchildren190 70.8% Not responsible for grandchildren