Races in North Creek, Washington (WA) Detailed Stats
Ancestries, Foreign-born residents, place of birth

Recent posts about races in North Creek, Washington on our local forum with over 2,400,000 registered users:
 | North metro Seattle for retirees (19 replies) |
| Mill Creek opinions? (8 replies) |
| Is Monroe a good place to live in? (22 replies) |
| Looking in Bothell - Northshore vs. Everett schools (20 replies) |
| live in Mill Creek, Bothell, or Kirkland? (9 replies) |
| Property - Bellevue/Redmond/Issaquah vs Lynnwood/Bothell vs Renton/Kent/Auburn/Burien (3 replies) |
8.3% of North Creek, WA residents are foreign-born (4.3% born in Asia, 1.7% born in Europe, 1.3% born in Latin America), which is 79.8% less than the foreign-born rate of 15.0% across the entire state of Washington.
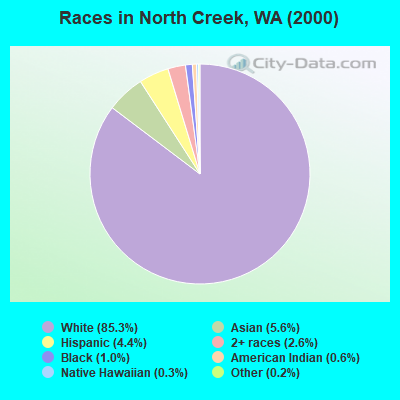
Race distribution in North Creek

- 21,95285.3%White alone
- 1,4415.6%Asian alone
- 1,1374.4%Hispanic
- 6822.6%Two or more races
- 2521.0%Black alone
- 1550.6%American Indian alone
- 730.3%Native Hawaiian and Other
Pacific Islander alone - 500.2%Other race alone
2000
2022
-
- 4,652,49078.9%White alone
- 441,5097.5%Hispanic
- 319,4015.4%Asian alone
- 184,6313.1%Black alone
- 175,9263.0%Two or more races
- 85,3961.4%American Indian alone
- 22,7790.4%Native Hawaiian and Other
Pacific Islander alone - 11,9890.2%Other race alone

-
- 4,941,45663.5%White alone
- 1,093,31314.0%Hispanic
- 755,8329.7%Asian alone
- 523,4486.7%Two or more races
- 299,5373.8%Black alone
- 69,0240.9%American Indian alone
- 52,2310.7%Native Hawaiian and Other
Pacific Islander alone - 50,9450.7%Other race alone

Income and house value in North Creek
- Median household income in 2022
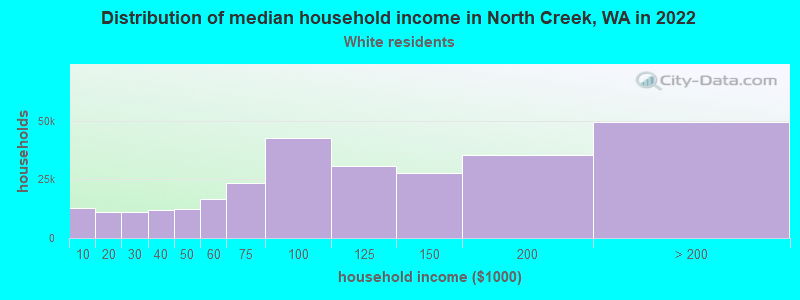
- $125,173White non-Hispanic householders
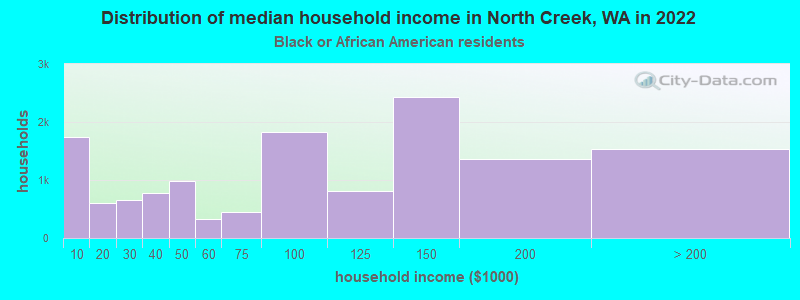
- $115,613Black householders
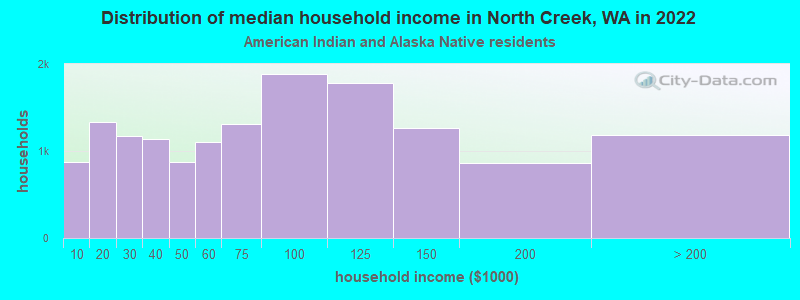
- $115,791American Indian and Alaska Native householders
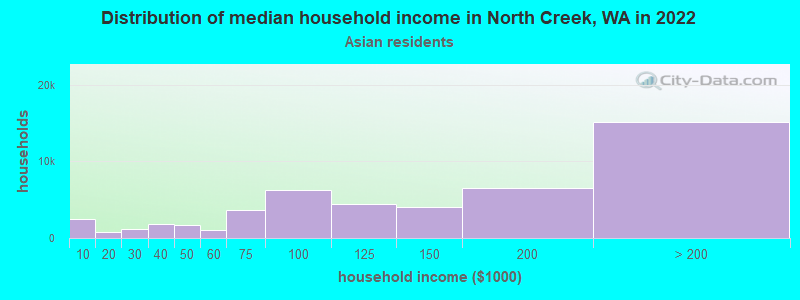
- $174,476Asian householders
- $63,394Some other race householders
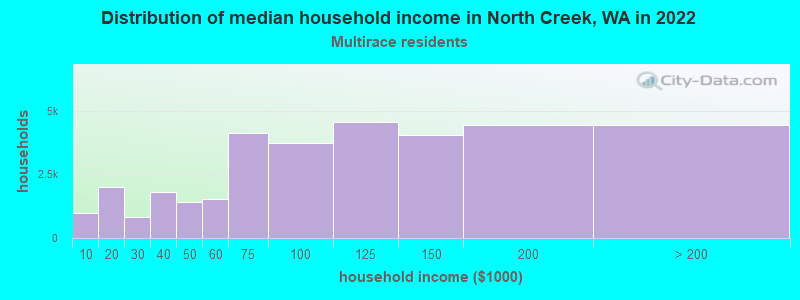
- $142,653Two or more races householders
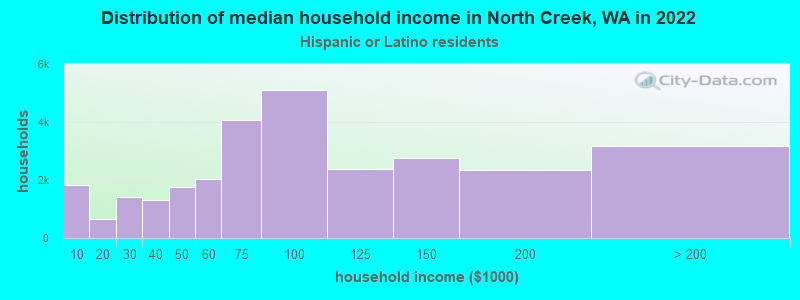
- $101,719Hispanic or Latino race householders
- Median 2022 house value
- $844,797White Non-Hispanic householders
- $772,192Black or African American householders
- $531,685American Indian or Alaska Native householders
- $817,570Asian householders
- over $1,000,000Some other race householders
- $806,226Two or more races householders
- $654,964Hispanic or Latino householders
Household income for White non-Hispanic householders
Household income for Black householders
Household income for American Indian and Alaska Native householders
Household income for Asian householders
Household income for Two or more races householders
Household income for Hispanic or Latino race householders
Foreign-born residents in North Creek
2,147 residents are foreign born (4.3% Asia, 1.7% Europe, 1.3% Latin America).
| This city: | 8.3% |
| Washington: | 10.4% |
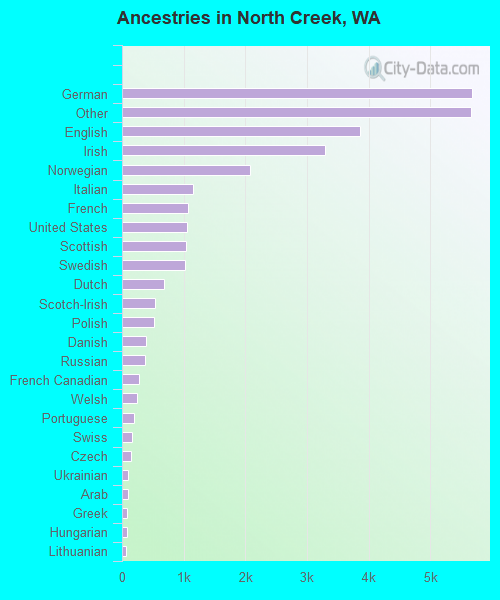
Ancestries in North Creek

- 5,66818.9%German
- 5,65918.9%Other
- 3,86012.9%English
- 3,29911.0%Irish
- 2,0796.9%Norwegian
- 1,1533.9%Italian
- 1,0643.6%French
- 1,0573.5%United States
- 1,0333.5%Scottish
- 1,0293.4%Swedish
- 6772.3%Dutch
- 5311.8%Scotch-Irish
- 5271.8%Polish
- 3901.3%Danish
- 3711.2%Russian
- 2750.9%French Canadian
- 2490.8%Welsh
- 1870.6%Portuguese
- 1610.5%Swiss
- 1400.5%Czech
- 1000.3%Ukrainian
- 940.3%Arab
- 770.3%Greek
- 740.2%Hungarian
- 640.2%Lithuanian
- 570.2%West Indian
- 280.09%Subsaharan African
- 190.06%Slovak
Zip codes: 98012.