Races in North Decatur, Georgia (GA) Detailed Stats
Data:
Races - White alone (%)
Races - White alone (% change since 2000)
Races - Black alone (%)
Races - Black alone (% change since 2000)
Races - American Indian alone (%)
Races - American Indian alone (% change since 2000)
Races - Asian alone (%)
Races - Asian alone (% change since 2000)
Races - Hispanic (%)
Races - Hispanic (% change since 2000)
Races - Native Hawaiian and Other Pacific Islander alone (%)
Races - Native Hawaiian and Other Pacific Islander alone (% change since 2000)
Races - Two or more races(%)
Races - Two or more races(% change since 2000)
Races - Other race alone (%)
Races - Other race alone (% change since 2000)
Racial diversity
Place of birth - Born in state of residence (%)
Place of birth - Born in state of residence (%) - White
Place of birth - Born in state of residence (%) - Black or African American
Place of birth - Born in state of residence (%) - Asian
Place of birth - Born in state of residence (%) - Hispanic or Latino
Place of birth - Born in state of residence (%) - American Indian and Alaska Native
Place of birth - Born in state of residence (%) - Multirace
Place of birth - Born in state of residence (%) - Other Race
Place of birth - Born in other state (%)
Place of birth - Born in other state (%) - White
Place of birth - Born in other state (%) - Black or African American
Place of birth - Born in other state (%) - Asian
Place of birth - Born in other state (%) - Hispanic or Latino
Place of birth - Born in other state (%) - American Indian and Alaska Native
Place of birth - Born in other state (%) - Multirace
Place of birth - Born in other state (%) - Other Race
Place of birth - Native, outside of US (%)
Place of birth - Native, outside of US (%) - White
Place of birth - Native, outside of US (%) - Black or African American
Place of birth - Native, outside of US (%) - Asian
Place of birth - Native, outside of US (%) - Hispanic or Latino
Place of birth - Native, outside of US (%) - American Indian and Alaska Native
Place of birth - Native, outside of US (%) - Multirace
Place of birth - Native, outside of US (%) - Other Race
Place of birth - Foreign born (%)
Place of birth - Foreign born (%) - White
Place of birth - Foreign born (%) - Black or African American
Place of birth - Foreign born (%) - Asian
Place of birth - Foreign born (%) - Hispanic or Latino
Place of birth - Foreign born (%) - American Indian and Alaska Native
Place of birth - Foreign born (%) - Multirace
Place of birth - Foreign born (%) - Other Race
Residents speaking English at home (%)
Residents speaking English at home - Born in the United States (%)
Residents speaking English at home - Native, born elsewhere (%)
Residents speaking English at home - Foreign born (%)
Residents speaking Spanish at home (%)
Residents speaking Spanish at home - Born in the United States (%)
Residents speaking Spanish at home - Native, born elsewhere (%)
Residents speaking Spanish at home - Foreign born (%)
Residents speaking other language at home (%)
Residents speaking other language at home - Born in the United States (%)
Residents speaking other language at home - Native, born elsewhere (%)
Residents speaking other language at home - Foreign born (%)
Marital status - Never married (%)
Marital status - Now married (%)
Marital status - Separated (%)
Marital status - Widowed (%)
Marital status - Divorced (%)
Ancestries Reported - Arab (%)
Ancestries Reported - Czech (%)
Ancestries Reported - Danish (%)
Ancestries Reported - Dutch (%)
Ancestries Reported - English (%)
Ancestries Reported - French (%)
Ancestries Reported - French Canadian (%)
Ancestries Reported - German (%)
Ancestries Reported - Greek (%)
Ancestries Reported - Hungarian (%)
Ancestries Reported - Irish (%)
Ancestries Reported - Italian (%)
Ancestries Reported - Lithuanian (%)
Ancestries Reported - Norwegian (%)
Ancestries Reported - Polish (%)
Ancestries Reported - Portuguese (%)
Ancestries Reported - Russian (%)
Ancestries Reported - Scotch-Irish (%)
Ancestries Reported - Scottish (%)
Ancestries Reported - Slovak (%)
Ancestries Reported - Subsaharan African (%)
Ancestries Reported - Swedish (%)
Ancestries Reported - Swiss (%)
Ancestries Reported - Ukrainian (%)
Ancestries Reported - United States (%)
Ancestries Reported - Welsh (%)
Ancestries Reported - West Indian (%)
Ancestries Reported - Other (%)
Geographical mobility - Same house 1 year ago (%)
Geographical mobility - Same house 1 year ago (%) - White
Geographical mobility - Same house 1 year ago (%) - Black or African American
Geographical mobility - Same house 1 year ago (%) - Asian
Geographical mobility - Same house 1 year ago (%) - Hispanic or Latino
Geographical mobility - Same house 1 year ago (%) - American Indian and Alaska Native
Geographical mobility - Same house 1 year ago (%) - Multirace
Geographical mobility - Same house 1 year ago (%) - Other Race
Geographical mobility - Moved within same county (%)
Geographical mobility - Moved within same county (%) - White
Geographical mobility - Moved within same county (%) - Black or African American
Geographical mobility - Moved within same county (%) - Asian
Geographical mobility - Moved within same county (%) - Hispanic or Latino
Geographical mobility - Moved within same county (%) - American Indian and Alaska Native
Geographical mobility - Moved within same county (%) - Multirace
Geographical mobility - Moved within same county (%) - Other Race
Geographical mobility - Moved from different county within same state (%)
Geographical mobility - Moved from different county within same state (%) - White
Geographical mobility - Moved from different county within same state (%) - Black or African American
Geographical mobility - Moved from different county within same state (%) - Asian
Geographical mobility - Moved from different county within same state (%) - Hispanic or Latino
Geographical mobility - Moved from different county within same state (%) - American Indian and Alaska Native
Geographical mobility - Moved from different county within same state (%) - Multirace
Geographical mobility - Moved from different county within same state (%) - Other Race
Geographical mobility - Moved from different state (%)
Geographical mobility - Moved from different state (%) - White
Geographical mobility - Moved from different state (%) - Black or African American
Geographical mobility - Moved from different state (%) - Asian
Geographical mobility - Moved from different state (%) - Hispanic or Latino
Geographical mobility - Moved from different state (%) - American Indian and Alaska Native
Geographical mobility - Moved from different state (%) - Multirace
Geographical mobility - Moved from different state (%) - Other Race
Geographical mobility - Moved from abroad (%)
Geographical mobility - Moved from abroad (%) - White
Geographical mobility - Moved from abroad (%) - Black or African American
Geographical mobility - Moved from abroad (%) - Asian
Geographical mobility - Moved from abroad (%) - Hispanic or Latino
Geographical mobility - Moved from abroad (%) - American Indian and Alaska Native
Geographical mobility - Moved from abroad (%) - Multirace
Geographical mobility - Moved from abroad (%) - Other Race
Place of birth for the foreign-born population - Ireland (%)
Place of birth for the foreign-born population - Denmark (%)
Place of birth for the foreign-born population - Norway (%)
Place of birth for the foreign-born population - Sweden (%)
Place of birth for the foreign-born population - United Kingdom (%)
Place of birth for the foreign-born population - England (%)
Place of birth for the foreign-born population - Scotland (%)
Place of birth for the foreign-born population - Other Northern Europe (%)
Place of birth for the foreign-born population - Austria (%)
Place of birth for the foreign-born population - Belgium (%)
Place of birth for the foreign-born population - France (%)
Place of birth for the foreign-born population - Germany (%)
Place of birth for the foreign-born population - Netherlands (%)
Place of birth for the foreign-born population - Switzerland (%)
Place of birth for the foreign-born population - Other Western Europe (%)
Place of birth for the foreign-born population - Greece (%)
Place of birth for the foreign-born population - Italy (%)
Place of birth for the foreign-born population - Portugal (%)
Place of birth for the foreign-born population - Spain (%)
Place of birth for the foreign-born population - Other Southern Europe (%)
Place of birth for the foreign-born population - Albania (%)
Place of birth for the foreign-born population - Belarus (%)
Place of birth for the foreign-born population - Bosnia and Herzegovina (%)
Place of birth for the foreign-born population - Bulgaria (%)
Place of birth for the foreign-born population - Croatia (%)
Place of birth for the foreign-born population - Czechoslovakia (%)
Place of birth for the foreign-born population - Hungary (%)
Place of birth for the foreign-born population - Latvia (%)
Place of birth for the foreign-born population - Lithuania (%)
Place of birth for the foreign-born population - North Macedonia (Macedonia) (%)
Place of birth for the foreign-born population - Moldova (%)
Place of birth for the foreign-born population - Poland (%)
Place of birth for the foreign-born population - Romania (%)
Place of birth for the foreign-born population - Russia (%)
Place of birth for the foreign-born population - Serbia (%)
Place of birth for the foreign-born population - Ukraine (%)
Place of birth for the foreign-born population - Other Eastern Europe (%)
Place of birth for the foreign-born population - China (%)
Place of birth for the foreign-born population - Hong Kong (%)
Place of birth for the foreign-born population - Taiwan (%)
Place of birth for the foreign-born population - Japan (%)
Place of birth for the foreign-born population - Korea (%)
Place of birth for the foreign-born population - Other Eastern Asia (%)
Place of birth for the foreign-born population - Afghanistan (%)
Place of birth for the foreign-born population - Bangladesh (%)
Place of birth for the foreign-born population - India (%)
Place of birth for the foreign-born population - Iran (%)
Place of birth for the foreign-born population - Kazakhstan (%)
Place of birth for the foreign-born population - Nepal (%)
Place of birth for the foreign-born population - Pakistan (%)
Place of birth for the foreign-born population - Sri Lanka (%)
Place of birth for the foreign-born population - Uzbekistan (%)
Place of birth for the foreign-born population - Other South Central Asia (%)
Place of birth for the foreign-born population - Burma (%)
Place of birth for the foreign-born population - Cambodia (%)
Place of birth for the foreign-born population - Indonesia (%)
Place of birth for the foreign-born population - Laos (%)
Place of birth for the foreign-born population - Malaysia (%)
Place of birth for the foreign-born population - Philippines (%)
Place of birth for the foreign-born population - Singapore (%)
Place of birth for the foreign-born population - Thailand (%)
Place of birth for the foreign-born population - Vietnam (%)
Place of birth for the foreign-born population - Other South Eastern Asia (%)
Place of birth for the foreign-born population - Armenia (%)
Place of birth for the foreign-born population - Iraq (%)
Place of birth for the foreign-born population - Israel (%)
Place of birth for the foreign-born population - Jordan (%)
Place of birth for the foreign-born population - Kuwait (%)
Place of birth for the foreign-born population - Lebanon (%)
Place of birth for the foreign-born population - Saudi Arabia (%)
Place of birth for the foreign-born population - Syria (%)
Place of birth for the foreign-born population - Turkey (%)
Place of birth for the foreign-born population - Yemen (%)
Place of birth for the foreign-born population - Other Western Asia (%)
Place of birth for the foreign-born population - Eritrea (%)
Place of birth for the foreign-born population - Ethiopia (%)
Place of birth for the foreign-born population - Kenya (%)
Place of birth for the foreign-born population - Somalia (%)
Place of birth for the foreign-born population - Uganda (%)
Place of birth for the foreign-born population - Zimbabwe (%)
Place of birth for the foreign-born population - Other Eastern Africa (%)
Place of birth for the foreign-born population - Cameroon (%)
Place of birth for the foreign-born population - Congo (%)
Place of birth for the foreign-born population - Democratic Republic of Congo (Zaire) (%)
Place of birth for the foreign-born population - Other Middle Africa (%)
Place of birth for the foreign-born population - Egypt (%)
Place of birth for the foreign-born population - Morocco (%)
Place of birth for the foreign-born population - Sudan (%)
Place of birth for the foreign-born population - Other Northern Africa (%)
Place of birth for the foreign-born population - South Africa (%)
Place of birth for the foreign-born population - Other Southern Africa (%)
Place of birth for the foreign-born population - Cabo Verde (%)
Place of birth for the foreign-born population - Ghana (%)
Place of birth for the foreign-born population - Liberia (%)
Place of birth for the foreign-born population - Nigeria (%)
Place of birth for the foreign-born population - Senegal (%)
Place of birth for the foreign-born population - Sierra Leone (%)
Place of birth for the foreign-born population - Other Western Africa (%)
Place of birth for the foreign-born population - Australia (%)
Place of birth for the foreign-born population - New Zealand (%)
Place of birth for the foreign-born population - Fiji (%)
Place of birth for the foreign-born population - Micronesia (%)
Place of birth for the foreign-born population - Bahamas (%)
Place of birth for the foreign-born population - Barbados (%)
Place of birth for the foreign-born population - Cuba (%)
Place of birth for the foreign-born population - Dominica (%)
Place of birth for the foreign-born population - Dominican Republic (%)
Place of birth for the foreign-born population - Grenada (%)
Place of birth for the foreign-born population - Haiti (%)
Place of birth for the foreign-born population - Jamaica (%)
Place of birth for the foreign-born population - St. Vincent and the Grenadines (%)
Place of birth for the foreign-born population - Trinidad and Tobago (%)
Place of birth for the foreign-born population - West Indies (%)
Place of birth for the foreign-born population - Other Caribbean (%)
Place of birth for the foreign-born population - Belize (%)
Place of birth for the foreign-born population - Costa Rica (%)
Place of birth for the foreign-born population - El Salvador (%)
Place of birth for the foreign-born population - Guatemala (%)
Place of birth for the foreign-born population - Honduras (%)
Place of birth for the foreign-born population - Mexico (%)
Place of birth for the foreign-born population - Nicaragua (%)
Place of birth for the foreign-born population - Panama (%)
Place of birth for the foreign-born population - Other Central America (%)
Place of birth for the foreign-born population - Argentina (%)
Place of birth for the foreign-born population - Bolivia (%)
Place of birth for the foreign-born population - Brazil (%)
Place of birth for the foreign-born population - Chile (%)
Place of birth for the foreign-born population - Colombia (%)
Place of birth for the foreign-born population - Ecuador (%)
Place of birth for the foreign-born population - Guyana (%)
Place of birth for the foreign-born population - Peru (%)
Place of birth for the foreign-born population - Uruguay (%)
Place of birth for the foreign-born population - Venezuela (%)
Place of birth for the foreign-born population - Other South America (%)
Place of birth for the foreign-born population - Canada (%)
Place of birth for the foreign-born population - Other Northern America (%)
Place of birth for the foreign-born population - Other (%)
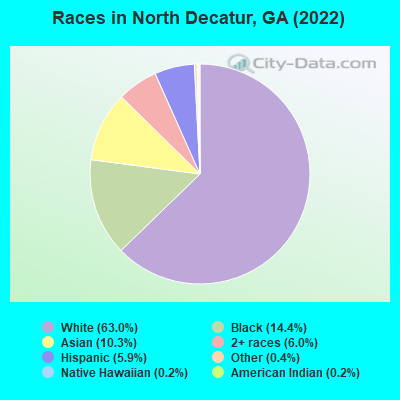
According to 2022 data, the most numerous races in North Decatur, GA are White alone (10,855 residents), Black alone (2,486 residents), and Hispanic (1,018 residents). 83.8% of North Decatur residents speak English at home. 16.7% of North Decatur, GA residents are foreign-born (9.7% born in Asia, 2.3% born in Latin America, 1.9% born in Europe, 1.7% born in Africa), which is 40.2% greater than the foreign-born rate of 10.0% across the entire state of Georgia.
Race distribution in North Decatur
2000 2022
5,128,661 62.6% White alone 2,331,465 28.5% Black alone 435,227 5.3% Hispanic 171,513 2.1% Asian alone 87,364 1.1% Two or more races 17,670 0.2% American Indian alone 11,275 0.1% Other race alone 3,278 0.04% Native Hawaiian and Other
5,415,657 49.6% White alone 3,349,240 30.7% Black alone 1,132,604 10.4% Hispanic 479,156 4.4% Asian alone 462,923 4.2% Two or more races 54,416 0.5% Other race alone 11,923 0.1% American Indian alone 6,957 0.06% Native Hawaiian and Other
Income and house value in North Decatur Median household income in 2022 $116,986 White non-Hispanic householders$67,646 Black householders$162,831 Some other race householders$124,297 Two or more races householders$180,260 Hispanic or Latino race householdersMedian 2022 house value $496,338 White Non-Hispanic householders$486,386 Black or African American householders$100,033 American Indian or Alaska Native householders $619,083 Asian householders$414,679 Some other race householders$240,896 Two or more races householders$474,392 Hispanic or Latino householders
Median age by race in North Decatur
44.4 Median age for White residents44.7 44.5 36.1 Median age for Black or African American residents40.1 35.1 -631,178,706.6 Median age for American Indian / Alaska Native residents-658,914,728.0 -565,432,098.2 40.4 Median age for Asian residents40.8 36.9 -657,243,815.6 Median age for Native Hawaiian / Pacific Islander residents-693,227,090.9 -776,776,776.0 40.8 Median age for Other race residents55.8 25.8 28.1 Median age for Two or more races residents15.7 30.8 44.5 Median age for White alone residents44.9 43.9 29.4 Median age for Hispanic or Latino residents31.5 28.1
Owner/renter occupied households by race in North Decatur
House owners and renters - White residents 3,652 69.3% Owner occupied1,615 30.7% Renter occupiedHouse owners and renters - Black or African American residents 321 26.7% Owner occupied882 73.3% Renter occupiedHouse owners and renters - American Indian / Alaska Native residents 23 100.0% Renter occupiedHouse owners and renters - Asian residents 398 47.5% Owner occupied440 52.5% Renter occupiedHouse owners and renters - Other race residents 51 50.0% Owner occupied51 50.0% Renter occupiedHouse owners and renters - Two or more races residents 278 59.3% Owner occupied191 40.7% Renter occupiedHouse owners and renters - White alone residents 3,594 67.8% Owner occupied1,705 32.2% Renter occupiedHouse owners and renters - Hispanic or Latino residents 225 85.9% Owner occupied37 14.1% Renter occupied
Language usage in North Decatur
English speakers - Total 83.8% of residents of North Decatur speak English at home.
3.8% of residents speak Spanish at home 521 83.4% Speak English very well104 16.6% Speak English less than very well12.6% of residents speak other language at home 1,292 62.7% Speak English very well768 37.3% Speak English less than very well
English speakers - Born in the United States 94.1% of residents of North Decatur speak English at home.
3.3% of residents speak Spanish at home 267 100.0% Speak English very well2.1% of residents speak other language at home 171 100.0% Speak English very well
English speakers - Native, born elsewhere 66.8% of residents of North Decatur speak English at home.
13.7% of residents speak Spanish at home 18 62.1% Speak English very well11 37.9% Speak English less than very well15.2% of residents speak other language at home 32 100.0% Speak English very well
English speakers - Foreign-born 27.5% of residents of North Decatur speak English at home.
7.8% of residents speak Spanish at home 169 82.4% Speak English very well36 17.6% Speak English less than very well66.6% of residents speak other language at home 1,050 59.9% Speak English very well703 40.1% Speak English less than very well
White (Caucasian) - Speak only English Native:
98.4% (9,823)Foreign-born:
53.7% (187)
White (Caucasian) - Speak another language Native:
2.5% (252)Foreign-born:
54.3% (189)
Black or African American - Speak only English Native:
94.7% (2,004)Foreign-born:
62.3% (177)
Black or African American - Speak another language Native:
5.6% (118)Foreign-born:
38.4% (109)
Asian - Speak only English Native:
63.1% (247)Foreign-born:
16.7% (215)
Asian - Speak another language Native:
38.5% (151)Foreign-born:
81.0% (1,043)
Other race - Speak another language Native:
23.7% (38)Foreign-born:
100.0% (91)
Two or more races - Speak only English Native:
100.0% (1,024)Foreign-born:
2.7% (8)
Two or more races - Speak another language Native:
4.0% (41)Foreign-born:
94.3% (301)
White alone - Speak only English Native:
98.0% (9,707)Foreign-born:
40.7% (182)
White alone - Speak another language Native:
2.2% (214)Foreign-born:
57.9% (259)
Hispanic or Latino - Speak only English Native:
89.5% (697)Foreign-born:
8.4% (19)
Hispanic or Latino - Speak another language Native:
25.5% (199)Foreign-born:
91.9% (211)
Foreign-born residents in North Decatur 2,879 residents are foreign born (9.7% Asia , 2.3% Latin America , 1.9% Europe , 1.7% Africa ).
This city:
16.7%Georgia:
10.4%
Marital status for residents in North Decatur Marital status - White (Caucasian) population 15 years and over
Males 34.9% Never married53.5% Now married0.8% Separated1.8% Widowed9.1% DivorcedFemales 31.9% Never married45.8% Now married0.7% Separated10.3% Widowed11.3% DivorcedWomen who gave birth in the past 12 months Now married:
100.0% (114)Unmarried:
0.0% (0)
Women who did not give birth in the past 12 months Now married:
48.0% (1,227)Unmarried:
52.0% (1,327)
Marital status - Black or African American population 15 years and over
Males 38.0% Never married25.4% Now married0.0% Separated0.0% Widowed36.6% DivorcedFemales 39.3% Never married27.7% Now married0.4% Separated6.4% Widowed26.2% DivorcedWomen who gave birth in the past 12 months Now married:
58.6% (17)Unmarried:
41.4% (12)
Women who did not give birth in the past 12 months Now married:
21.8% (138)Unmarried:
78.2% (498)
Marital status - Asian population 15 years and over
Males 40.2% Never married48.4% Now married0.0% Separated2.2% Widowed9.2% DivorcedFemales 47.3% Never married43.0% Now married0.0% Separated2.1% Widowed7.5% DivorcedWomen who gave birth in the past 12 months Now married:
100.0% (30)Unmarried:
0.0% (0)
Women who did not give birth in the past 12 months Now married:
42.2% (231)Unmarried:
57.8% (317)
Marital status - Other race population 15 years and over
Males 13.6% Never married86.4% Now married0.0% Separated0.0% Widowed0.0% DivorcedFemales 18.5% Never married81.5% Now married0.0% Separated0.0% Widowed0.0% DivorcedWomen who did not give birth in the past 12 months Now married:
52.4% (16)Unmarried:
47.6% (15)
Marital status - Two or more races population 15 years and over
Males 52.9% Never married47.1% Now married0.0% Separated0.0% Widowed0.0% DivorcedFemales 18.9% Never married71.3% Now married1.7% Separated2.2% Widowed5.9% DivorcedWomen who did not give birth in the past 12 months Now married:
79.1% (290)Unmarried:
20.9% (77)
Marital status - White alone, not Hispanic / Latino population 15 years and over
Males 35.8% Never married52.1% Now married0.8% Separated1.9% Widowed9.4% DivorcedFemales 31.6% Never married45.7% Now married0.7% Separated10.5% Widowed11.6% DivorcedWomen who gave birth in the past 12 months Now married:
100.0% (112)Unmarried:
0.0% (0)
Women who did not give birth in the past 12 months Now married:
48.0% (1,236)Unmarried:
52.0% (1,340)
Marital status - Hispanic or Latino population 15 years and over
Males 35.3% Never married64.7% Now married0.0% Separated0.0% Widowed0.0% DivorcedFemales 28.2% Never married66.2% Now married0.0% Separated2.6% Widowed2.9% DivorcedWomen who gave birth in the past 12 months Now married:
100.0% (7)Unmarried:
0.0% (0)
Women who did not give birth in the past 12 months Now married:
67.7% (180)Unmarried:
32.3% (86)
Ancestries in North Decatur
1,003 11.7% English410 4.8% Irish380 4.4% European366 4.3% American350 4.1% German249 2.9% Scottish165 1.9% Scotch-Irish163 1.9% Italian157 1.8% Brazilian133 1.6% West Indian112 1.3% Nigerian94 1.1% Greek85 1.0% Eastern European84 1.0% Dutch73 0.9% Polish66 0.8% Egyptian62 0.7% Jamaican47 0.5% French40 0.5% Sierra Leonean40 0.5% Iranian39 0.5% Ethiopian33 0.4% Welsh33 0.4% African29 0.3% British29 0.3% French Canadian28 0.3% Guyanese25 0.3% Moroccan25 0.3% Serbian22 0.3% Russian22 0.3% Israeli20 0.2% Armenian17 0.2% Barbadian14 0.2% Ukrainian13 0.2% Swedish13 0.2% Hungarian12 0.1% Bermudan11 0.1% Finnish11 0.1% Cajun10 0.1% Romanian9 0.1% Cape Verdean9 0.1% Latvian9 0.1% Czech8 0.09% Swiss8 0.09% Austrian5 0.06% Lithuanian
Geographical mobility in North Decatur Same house 1 year ago 8,633 82.1% White (Caucasian)1,905 77.3% Black or African American22 87.7% American Indian / Alaska Native1,122 63.8% Asian35 100.0% Native Hawaiian / Pacific Islander217 84.0% Other race1,076 72.6% Two or more races8,799 81.8% White alone, not Hispanic / Latino833 83.6% Hispanic or LatinoMoved within same county 635 6.0% White / Caucasian287 11.6% Black or African American116 6.6% Asian3 1.2% Other race23 1.6% Two or more races672 6.2% White alone, not Hispanic / Latino24 2.4% Hispanic or LatinoMoved within same state 480 4.6% White / Caucasian208 8.4% Black or African American156 8.9% Asian23 8.7% Other race99 6.7% Two or more races486 4.5% White alone, not Hispanic / Latino159 16.0% Hispanic or LatinoMoved from different state 814 7.7% White / Caucasian11 0.4% Black or African American126 7.2% Asian119 8.1% Two or more races832 7.7% White alone, not Hispanic / Latino5 0.5% Hispanic or LatinoMoved from abroad 12 0.1% White77 3.1% Black or African American215 12.2% Asian16 0.2% White alone, not Hispanic / Latino
Children Nativity (place of birth) in North Decatur
Children under 6 years - Living with two parents Both parents native 846 100.0% NativeBoth parents foreign-born 125 73.7% Native45 26.3% Foreign-bornOne native, one foreign-born parent 61 100.0% NativeChildren under 6 years - Living with one parent Native parent 54 100.0% NativeForeign-born parent 11 100.0% NativeChildren 6 to 17 years - Living with two parents Both parents native 906 98.3% Native15 1.7% Foreign-bornBoth parents foreign-born 155 66.4% Native79 33.6% Foreign-bornOne native, one foreign-born parent 121 90.3% Native13 9.7% Foreign-bornChildren 6 to 17 years - Living with one parent Native parent 486 100.0% NativeForeign-born parent 47 58.5% Native34 41.5% Foreign-born
Grandparents responsible for own grandchildren in North Decatur
Grandparents (30 to 59 years) White / Caucasian 1 76.5% Responsible for grandchildrenBlack or African American 24 100.0% Not responsible for grandchildrenWhite alone, not Hispanic / Latino 1 78.3% Responsible for grandchildrenGrandparents (60 years and over) White / Caucasian 1 5.7% Responsible for grandchildren19 94.3% Not responsible for grandchildrenWhite alone, not Hispanic / Latino 1 5.5% Responsible for grandchildren20 94.5% Not responsible for grandchildren