Races in Northbrook, Illinois (IL) Detailed Stats
Data:
Races - White alone (%)
Races - White alone (% change since 2000)
Races - Black alone (%)
Races - Black alone (% change since 2000)
Races - American Indian alone (%)
Races - American Indian alone (% change since 2000)
Races - Asian alone (%)
Races - Asian alone (% change since 2000)
Races - Hispanic (%)
Races - Hispanic (% change since 2000)
Races - Native Hawaiian and Other Pacific Islander alone (%)
Races - Native Hawaiian and Other Pacific Islander alone (% change since 2000)
Races - Two or more races(%)
Races - Two or more races(% change since 2000)
Races - Other race alone (%)
Races - Other race alone (% change since 2000)
Racial diversity
Place of birth - Born in state of residence (%)
Place of birth - Born in state of residence (%) - White
Place of birth - Born in state of residence (%) - Black or African American
Place of birth - Born in state of residence (%) - Asian
Place of birth - Born in state of residence (%) - Hispanic or Latino
Place of birth - Born in state of residence (%) - American Indian and Alaska Native
Place of birth - Born in state of residence (%) - Multirace
Place of birth - Born in state of residence (%) - Other Race
Place of birth - Born in other state (%)
Place of birth - Born in other state (%) - White
Place of birth - Born in other state (%) - Black or African American
Place of birth - Born in other state (%) - Asian
Place of birth - Born in other state (%) - Hispanic or Latino
Place of birth - Born in other state (%) - American Indian and Alaska Native
Place of birth - Born in other state (%) - Multirace
Place of birth - Born in other state (%) - Other Race
Place of birth - Native, outside of US (%)
Place of birth - Native, outside of US (%) - White
Place of birth - Native, outside of US (%) - Black or African American
Place of birth - Native, outside of US (%) - Asian
Place of birth - Native, outside of US (%) - Hispanic or Latino
Place of birth - Native, outside of US (%) - American Indian and Alaska Native
Place of birth - Native, outside of US (%) - Multirace
Place of birth - Native, outside of US (%) - Other Race
Place of birth - Foreign born (%)
Place of birth - Foreign born (%) - White
Place of birth - Foreign born (%) - Black or African American
Place of birth - Foreign born (%) - Asian
Place of birth - Foreign born (%) - Hispanic or Latino
Place of birth - Foreign born (%) - American Indian and Alaska Native
Place of birth - Foreign born (%) - Multirace
Place of birth - Foreign born (%) - Other Race
Residents speaking English at home (%)
Residents speaking English at home - Born in the United States (%)
Residents speaking English at home - Native, born elsewhere (%)
Residents speaking English at home - Foreign born (%)
Residents speaking Spanish at home (%)
Residents speaking Spanish at home - Born in the United States (%)
Residents speaking Spanish at home - Native, born elsewhere (%)
Residents speaking Spanish at home - Foreign born (%)
Residents speaking other language at home (%)
Residents speaking other language at home - Born in the United States (%)
Residents speaking other language at home - Native, born elsewhere (%)
Residents speaking other language at home - Foreign born (%)
Marital status - Never married (%)
Marital status - Now married (%)
Marital status - Separated (%)
Marital status - Widowed (%)
Marital status - Divorced (%)
Ancestries Reported - Arab (%)
Ancestries Reported - Czech (%)
Ancestries Reported - Danish (%)
Ancestries Reported - Dutch (%)
Ancestries Reported - English (%)
Ancestries Reported - French (%)
Ancestries Reported - French Canadian (%)
Ancestries Reported - German (%)
Ancestries Reported - Greek (%)
Ancestries Reported - Hungarian (%)
Ancestries Reported - Irish (%)
Ancestries Reported - Italian (%)
Ancestries Reported - Lithuanian (%)
Ancestries Reported - Norwegian (%)
Ancestries Reported - Polish (%)
Ancestries Reported - Portuguese (%)
Ancestries Reported - Russian (%)
Ancestries Reported - Scotch-Irish (%)
Ancestries Reported - Scottish (%)
Ancestries Reported - Slovak (%)
Ancestries Reported - Subsaharan African (%)
Ancestries Reported - Swedish (%)
Ancestries Reported - Swiss (%)
Ancestries Reported - Ukrainian (%)
Ancestries Reported - United States (%)
Ancestries Reported - Welsh (%)
Ancestries Reported - West Indian (%)
Ancestries Reported - Other (%)
Geographical mobility - Same house 1 year ago (%)
Geographical mobility - Same house 1 year ago (%) - White
Geographical mobility - Same house 1 year ago (%) - Black or African American
Geographical mobility - Same house 1 year ago (%) - Asian
Geographical mobility - Same house 1 year ago (%) - Hispanic or Latino
Geographical mobility - Same house 1 year ago (%) - American Indian and Alaska Native
Geographical mobility - Same house 1 year ago (%) - Multirace
Geographical mobility - Same house 1 year ago (%) - Other Race
Geographical mobility - Moved within same county (%)
Geographical mobility - Moved within same county (%) - White
Geographical mobility - Moved within same county (%) - Black or African American
Geographical mobility - Moved within same county (%) - Asian
Geographical mobility - Moved within same county (%) - Hispanic or Latino
Geographical mobility - Moved within same county (%) - American Indian and Alaska Native
Geographical mobility - Moved within same county (%) - Multirace
Geographical mobility - Moved within same county (%) - Other Race
Geographical mobility - Moved from different county within same state (%)
Geographical mobility - Moved from different county within same state (%) - White
Geographical mobility - Moved from different county within same state (%) - Black or African American
Geographical mobility - Moved from different county within same state (%) - Asian
Geographical mobility - Moved from different county within same state (%) - Hispanic or Latino
Geographical mobility - Moved from different county within same state (%) - American Indian and Alaska Native
Geographical mobility - Moved from different county within same state (%) - Multirace
Geographical mobility - Moved from different county within same state (%) - Other Race
Geographical mobility - Moved from different state (%)
Geographical mobility - Moved from different state (%) - White
Geographical mobility - Moved from different state (%) - Black or African American
Geographical mobility - Moved from different state (%) - Asian
Geographical mobility - Moved from different state (%) - Hispanic or Latino
Geographical mobility - Moved from different state (%) - American Indian and Alaska Native
Geographical mobility - Moved from different state (%) - Multirace
Geographical mobility - Moved from different state (%) - Other Race
Geographical mobility - Moved from abroad (%)
Geographical mobility - Moved from abroad (%) - White
Geographical mobility - Moved from abroad (%) - Black or African American
Geographical mobility - Moved from abroad (%) - Asian
Geographical mobility - Moved from abroad (%) - Hispanic or Latino
Geographical mobility - Moved from abroad (%) - American Indian and Alaska Native
Geographical mobility - Moved from abroad (%) - Multirace
Geographical mobility - Moved from abroad (%) - Other Race
Place of birth for the foreign-born population - Ireland (%)
Place of birth for the foreign-born population - Denmark (%)
Place of birth for the foreign-born population - Norway (%)
Place of birth for the foreign-born population - Sweden (%)
Place of birth for the foreign-born population - United Kingdom (%)
Place of birth for the foreign-born population - England (%)
Place of birth for the foreign-born population - Scotland (%)
Place of birth for the foreign-born population - Other Northern Europe (%)
Place of birth for the foreign-born population - Austria (%)
Place of birth for the foreign-born population - Belgium (%)
Place of birth for the foreign-born population - France (%)
Place of birth for the foreign-born population - Germany (%)
Place of birth for the foreign-born population - Netherlands (%)
Place of birth for the foreign-born population - Switzerland (%)
Place of birth for the foreign-born population - Other Western Europe (%)
Place of birth for the foreign-born population - Greece (%)
Place of birth for the foreign-born population - Italy (%)
Place of birth for the foreign-born population - Portugal (%)
Place of birth for the foreign-born population - Spain (%)
Place of birth for the foreign-born population - Other Southern Europe (%)
Place of birth for the foreign-born population - Albania (%)
Place of birth for the foreign-born population - Belarus (%)
Place of birth for the foreign-born population - Bosnia and Herzegovina (%)
Place of birth for the foreign-born population - Bulgaria (%)
Place of birth for the foreign-born population - Croatia (%)
Place of birth for the foreign-born population - Czechoslovakia (%)
Place of birth for the foreign-born population - Hungary (%)
Place of birth for the foreign-born population - Latvia (%)
Place of birth for the foreign-born population - Lithuania (%)
Place of birth for the foreign-born population - North Macedonia (Macedonia) (%)
Place of birth for the foreign-born population - Moldova (%)
Place of birth for the foreign-born population - Poland (%)
Place of birth for the foreign-born population - Romania (%)
Place of birth for the foreign-born population - Russia (%)
Place of birth for the foreign-born population - Serbia (%)
Place of birth for the foreign-born population - Ukraine (%)
Place of birth for the foreign-born population - Other Eastern Europe (%)
Place of birth for the foreign-born population - China (%)
Place of birth for the foreign-born population - Hong Kong (%)
Place of birth for the foreign-born population - Taiwan (%)
Place of birth for the foreign-born population - Japan (%)
Place of birth for the foreign-born population - Korea (%)
Place of birth for the foreign-born population - Other Eastern Asia (%)
Place of birth for the foreign-born population - Afghanistan (%)
Place of birth for the foreign-born population - Bangladesh (%)
Place of birth for the foreign-born population - India (%)
Place of birth for the foreign-born population - Iran (%)
Place of birth for the foreign-born population - Kazakhstan (%)
Place of birth for the foreign-born population - Nepal (%)
Place of birth for the foreign-born population - Pakistan (%)
Place of birth for the foreign-born population - Sri Lanka (%)
Place of birth for the foreign-born population - Uzbekistan (%)
Place of birth for the foreign-born population - Other South Central Asia (%)
Place of birth for the foreign-born population - Burma (%)
Place of birth for the foreign-born population - Cambodia (%)
Place of birth for the foreign-born population - Indonesia (%)
Place of birth for the foreign-born population - Laos (%)
Place of birth for the foreign-born population - Malaysia (%)
Place of birth for the foreign-born population - Philippines (%)
Place of birth for the foreign-born population - Singapore (%)
Place of birth for the foreign-born population - Thailand (%)
Place of birth for the foreign-born population - Vietnam (%)
Place of birth for the foreign-born population - Other South Eastern Asia (%)
Place of birth for the foreign-born population - Armenia (%)
Place of birth for the foreign-born population - Iraq (%)
Place of birth for the foreign-born population - Israel (%)
Place of birth for the foreign-born population - Jordan (%)
Place of birth for the foreign-born population - Kuwait (%)
Place of birth for the foreign-born population - Lebanon (%)
Place of birth for the foreign-born population - Saudi Arabia (%)
Place of birth for the foreign-born population - Syria (%)
Place of birth for the foreign-born population - Turkey (%)
Place of birth for the foreign-born population - Yemen (%)
Place of birth for the foreign-born population - Other Western Asia (%)
Place of birth for the foreign-born population - Eritrea (%)
Place of birth for the foreign-born population - Ethiopia (%)
Place of birth for the foreign-born population - Kenya (%)
Place of birth for the foreign-born population - Somalia (%)
Place of birth for the foreign-born population - Uganda (%)
Place of birth for the foreign-born population - Zimbabwe (%)
Place of birth for the foreign-born population - Other Eastern Africa (%)
Place of birth for the foreign-born population - Cameroon (%)
Place of birth for the foreign-born population - Congo (%)
Place of birth for the foreign-born population - Democratic Republic of Congo (Zaire) (%)
Place of birth for the foreign-born population - Other Middle Africa (%)
Place of birth for the foreign-born population - Egypt (%)
Place of birth for the foreign-born population - Morocco (%)
Place of birth for the foreign-born population - Sudan (%)
Place of birth for the foreign-born population - Other Northern Africa (%)
Place of birth for the foreign-born population - South Africa (%)
Place of birth for the foreign-born population - Other Southern Africa (%)
Place of birth for the foreign-born population - Cabo Verde (%)
Place of birth for the foreign-born population - Ghana (%)
Place of birth for the foreign-born population - Liberia (%)
Place of birth for the foreign-born population - Nigeria (%)
Place of birth for the foreign-born population - Senegal (%)
Place of birth for the foreign-born population - Sierra Leone (%)
Place of birth for the foreign-born population - Other Western Africa (%)
Place of birth for the foreign-born population - Australia (%)
Place of birth for the foreign-born population - New Zealand (%)
Place of birth for the foreign-born population - Fiji (%)
Place of birth for the foreign-born population - Micronesia (%)
Place of birth for the foreign-born population - Bahamas (%)
Place of birth for the foreign-born population - Barbados (%)
Place of birth for the foreign-born population - Cuba (%)
Place of birth for the foreign-born population - Dominica (%)
Place of birth for the foreign-born population - Dominican Republic (%)
Place of birth for the foreign-born population - Grenada (%)
Place of birth for the foreign-born population - Haiti (%)
Place of birth for the foreign-born population - Jamaica (%)
Place of birth for the foreign-born population - St. Vincent and the Grenadines (%)
Place of birth for the foreign-born population - Trinidad and Tobago (%)
Place of birth for the foreign-born population - West Indies (%)
Place of birth for the foreign-born population - Other Caribbean (%)
Place of birth for the foreign-born population - Belize (%)
Place of birth for the foreign-born population - Costa Rica (%)
Place of birth for the foreign-born population - El Salvador (%)
Place of birth for the foreign-born population - Guatemala (%)
Place of birth for the foreign-born population - Honduras (%)
Place of birth for the foreign-born population - Mexico (%)
Place of birth for the foreign-born population - Nicaragua (%)
Place of birth for the foreign-born population - Panama (%)
Place of birth for the foreign-born population - Other Central America (%)
Place of birth for the foreign-born population - Argentina (%)
Place of birth for the foreign-born population - Bolivia (%)
Place of birth for the foreign-born population - Brazil (%)
Place of birth for the foreign-born population - Chile (%)
Place of birth for the foreign-born population - Colombia (%)
Place of birth for the foreign-born population - Ecuador (%)
Place of birth for the foreign-born population - Guyana (%)
Place of birth for the foreign-born population - Peru (%)
Place of birth for the foreign-born population - Uruguay (%)
Place of birth for the foreign-born population - Venezuela (%)
Place of birth for the foreign-born population - Other South America (%)
Place of birth for the foreign-born population - Canada (%)
Place of birth for the foreign-born population - Other Northern America (%)
Place of birth for the foreign-born population - Other (%)
Latest news about races in Northbrook, IL collected exclusively by city-data.com from local newspapers, TV, and radio stations
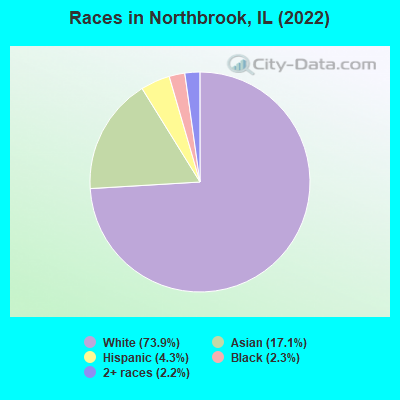
According to 2022 data, the most numerous races in Northbrook, IL are White alone (25,266 residents), Hispanic (1,464 residents), and Black alone (803 residents). 75.3% of Northbrook residents speak English at home. 20.3% of Northbrook, IL residents are foreign-born (10.8% born in Asia, 6.9% born in Europe), which is 31.0% greater than the foreign-born rate of 14.0% across the entire state of Illinois.
Race distribution in Northbrook
2000 2022
8,424,140 67.8% White alone 1,856,152 14.9% Black alone 1,530,262 12.3% Hispanic 419,916 3.4% Asian alone 153,996 1.2% Two or more races 13,479 0.1% Other race alone 18,232 0.1% American Indian alone 3,116 0.03% Native Hawaiian and Other
7,356,301 58.5% White alone 2,299,726 18.3% Hispanic 1,660,423 13.2% Black alone 747,296 5.9% Asian alone 458,599 3.6% Two or more races 45,386 0.4% Other race alone 10,405 0.08% American Indian alone 3,896 0.03% Native Hawaiian and Other
Income and house value in Northbrook Median household income in 2022 $148,406 White non-Hispanic householders$139,921 Asian householders$165,180 Two or more races householders$124,793 Hispanic or Latino race householdersMedian 2022 house value $678,724 White Non-Hispanic householders$446,581 Black or African American householders $612,062 Asian householders$496,804 Some other race householders$380,100 Two or more races householders$474,222 Hispanic or Latino householders
Median age by race in Northbrook
54.4 Median age for White residents53.8 54.8 29.8 Median age for Black or African American residents36.6 29.8 -680,473,372.1 Median age for American Indian / Alaska Native residents-736,736,736.0 -641,399,416.3 44.2 Median age for Asian residents42.9 44.2 -687,999,999.3 Median age for Native Hawaiian / Pacific Islander residents-918,721,460.3 -610,229,276.3 22.5 Median age for Other race residents42.9 10.0 16.2 Median age for Two or more races residents12.4 23.2 53.0 Median age for White alone residents52.3 53.2 21.3 Median age for Hispanic or Latino residents39.4 19.0
Owner/renter occupied households by race in Northbrook
House owners and renters - White residents 9,084 88.4% Owner occupied1,197 11.6% Renter occupiedHouse owners and renters - Black or African American residents 136 52.4% Owner occupied124 47.6% Renter occupiedHouse owners and renters - Asian residents 1,835 89.2% Owner occupied221 10.8% Renter occupiedHouse owners and renters - Other race residents 95 100.0% Owner occupiedHouse owners and renters - Two or more races residents 212 68.1% Owner occupied100 31.9% Renter occupiedHouse owners and renters - White alone residents 9,488 87.9% Owner occupied1,302 12.1% Renter occupiedHouse owners and renters - Hispanic or Latino residents 265 90.0% Owner occupied29 10.0% Renter occupied
Language usage in Northbrook
English speakers - Total 75.3% of residents of Northbrook speak English at home.
1.4% of residents speak Spanish at home 332 70.3% Speak English very well140 29.7% Speak English less than very well23.3% of residents speak other language at home 5,491 72.1% Speak English very well2,121 27.9% Speak English less than very well
English speakers - Born in the United States 89.7% of residents of Northbrook speak English at home.
1.9% of residents speak Spanish at home 118 100.0% Speak English very well9.2% of residents speak other language at home 577 100.0% Speak English very well
English speakers - Native, born elsewhere 71.1% of residents of Northbrook speak English at home.
1.5% of residents speak Spanish at home 4 100.0% Speak English very well27.5% of residents speak other language at home 75 100.0% Speak English very well
English speakers - Foreign-born 18.6% of residents of Northbrook speak English at home.
2.9% of residents speak Spanish at home 100 50.5% Speak English very well98 49.5% Speak English less than very well77.5% of residents speak other language at home 3,401 63.4% Speak English very well1,966 36.6% Speak English less than very well
White (Caucasian) - Speak only English Native:
97.5% (19,702)Foreign-born:
18.0% (449)
White (Caucasian) - Speak another language Native:
5.0% (1,008)Foreign-born:
82.3% (2,045)
Black or African American - Speak only English Native:
100.0% (773)Foreign-born:
61.2% (21)
Asian - Speak only English Native:
60.2% (1,172)Foreign-born:
20.7% (728)
Asian - Speak another language Native:
39.9% (776)Foreign-born:
77.9% (2,741)
Other race - Speak another language Native:
23.5% (39)Foreign-born:
100.0% (65)
Two or more races - Speak another language Native:
14.0% (181)Foreign-born:
100.0% (141)
White alone - Speak only English Native:
92.7% (19,643)Foreign-born:
14.5% (452)
White alone - Speak another language Native:
7.2% (1,532)Foreign-born:
85.6% (2,677)
Hispanic or Latino - Speak only English Native:
86.7% (983)Foreign-born:
17.5% (44)
Hispanic or Latino - Speak another language Native:
16.7% (189)Foreign-born:
81.0% (205)
Foreign-born residents in Northbrook 6,937 residents are foreign born (10.8% Asia , 6.9% Europe ).
This city:
20.3%Illinois:
14.1%
Marital status for residents in Northbrook Marital status - White (Caucasian) population 15 years and over
Males 25.5% Never married63.9% Now married0.2% Separated3.8% Widowed6.5% DivorcedFemales 16.5% Never married59.6% Now married0.6% Separated12.1% Widowed11.1% DivorcedWomen who gave birth in the past 12 months Now married:
92.6% (137)Unmarried:
7.4% (11)
Women who did not give birth in the past 12 months Now married:
54.0% (1,921)Unmarried:
46.0% (1,634)
Marital status - Black or African American population 15 years and over
Males 69.0% Never married19.0% Now married7.8% Separated3.5% Widowed0.8% DivorcedFemales 56.3% Never married27.9% Now married0.0% Separated0.0% Widowed15.7% DivorcedWomen who did not give birth in the past 12 months Now married:
38.1% (111)Unmarried:
61.9% (181)
Marital status - Asian population 15 years and over
Males 18.7% Never married75.4% Now married0.0% Separated2.2% Widowed3.8% DivorcedFemales 15.8% Never married70.9% Now married0.8% Separated4.8% Widowed7.7% DivorcedWomen who gave birth in the past 12 months Now married:
100.0% (114)Unmarried:
0.0% (0)
Women who did not give birth in the past 12 months Now married:
65.5% (763)Unmarried:
34.5% (402)
Marital status - Other race population 15 years and over
Males 8.5% Never married47.6% Now married0.0% Separated0.0% Widowed43.9% DivorcedFemales 52.5% Never married39.3% Now married0.0% Separated8.2% Widowed0.0% DivorcedWomen who did not give birth in the past 12 months Now married:
0.0% (0)Unmarried:
100.0% (36)
Marital status - Two or more races population 15 years and over
Males 40.1% Never married59.9% Now married0.0% Separated0.0% Widowed0.0% DivorcedFemales 49.4% Never married45.9% Now married0.0% Separated4.7% Widowed0.0% DivorcedWomen who did not give birth in the past 12 months Now married:
29.7% (92)Unmarried:
70.3% (216)
Marital status - White alone, not Hispanic / Latino population 15 years and over
Males 25.1% Never married63.9% Now married0.2% Separated3.9% Widowed6.8% DivorcedFemales 15.3% Never married60.8% Now married0.7% Separated12.1% Widowed11.2% DivorcedWomen who gave birth in the past 12 months Now married:
92.6% (154)Unmarried:
7.4% (12)
Women who did not give birth in the past 12 months Now married:
56.4% (2,145)Unmarried:
43.6% (1,655)
Marital status - Hispanic or Latino population 15 years and over
Males 35.8% Never married58.4% Now married0.0% Separated0.0% Widowed5.8% DivorcedFemales 58.4% Never married28.6% Now married0.0% Separated7.2% Widowed5.9% DivorcedWomen who did not give birth in the past 12 months Now married:
19.9% (67)Unmarried:
80.1% (269)
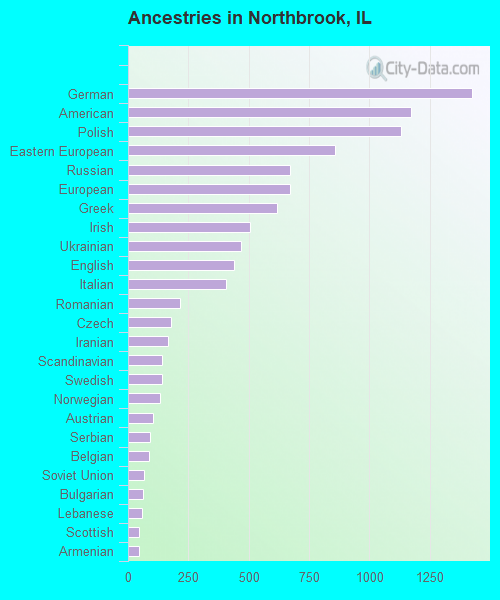
Ancestries in Northbrook
1,425 8.3% German1,173 6.9% American1,132 6.6% Polish858 5.0% Eastern European672 3.9% Russian672 3.9% European618 3.6% Greek504 3.0% Irish468 2.7% Ukrainian441 2.6% English407 2.4% Italian214 1.3% Romanian177 1.0% Czech164 1.0% Iranian142 0.8% Scandinavian141 0.8% Swedish133 0.8% Norwegian102 0.6% Austrian93 0.5% Serbian88 0.5% Belgian68 0.4% Soviet Union62 0.4% Bulgarian60 0.4% Lebanese47 0.3% Scottish46 0.3% Armenian46 0.3% French Canadian46 0.3% Czechoslovakian43 0.3% Croatian42 0.2% African39 0.2% Dutch38 0.2% Egyptian33 0.2% Guyanese32 0.2% Lithuanian32 0.2% Hungarian28 0.2% British25 0.1% Luxembourger22 0.1% Portuguese20 0.1% Jamaican16 0.09% Danish15 0.09% French15 0.09% Welsh14 0.08% Scotch-Irish12 0.07% Israeli10 0.06% Latvian10 0.06% Finnish8 0.05% Albanian8 0.05% Haitian7 0.04% New Zealander5 0.03% Slovak5 0.03% Kenyan3 0.02% Turkish
Geographical mobility in Northbrook Same house 1 year ago 21,154 91.3% White (Caucasian)617 76.7% Black or African American4,991 86.9% Asian216 78.9% Other race1,471 93.5% Two or more races23,006 91.5% White alone, not Hispanic / Latino1,350 93.6% Hispanic or LatinoMoved within same county 1,288 5.6% White / Caucasian52 6.5% Black or African American424 7.4% Asian13 4.6% Other race86 5.4% Two or more races1,405 5.6% White alone, not Hispanic / Latino34 2.4% Hispanic or LatinoMoved within same state 266 1.1% White / Caucasian46 0.8% Asian12 4.3% Other race280 1.1% White alone, not Hispanic / Latino8 0.6% Hispanic or LatinoMoved from different state 282 1.2% White / Caucasian8 1.0% Black or African American152 2.6% Asian279 1.1% White alone, not Hispanic / Latino13 0.9% Hispanic or LatinoMoved from abroad 59 0.3% White188 23.4% Black or African American120 2.1% Asian43 15.6% Other race58 0.2% White alone, not Hispanic / Latino59 4.1% Hispanic or Latino
Children Nativity (place of birth) in Northbrook
Children under 6 years - Living with two parents Both parents native 1,059 100.0% NativeBoth parents foreign-born 264 97.5% Native7 2.5% Foreign-bornOne native, one foreign-born parent 267 100.0% NativeChildren under 6 years - Living with one parent Native parent 67 100.0% NativeForeign-born parent 62 100.0% NativeChildren 6 to 17 years - Living with two parents Both parents native 2,700 98.3% Native47 1.7% Foreign-bornBoth parents foreign-born 936 93.0% Native71 7.0% Foreign-bornOne native, one foreign-born parent 566 100.0% NativeChildren 6 to 17 years - Living with one parent Native parent 394 100.0% NativeForeign-born parent 142 50.1% Native141 49.9% Foreign-born
Grandparents responsible for own grandchildren in Northbrook
Grandparents (30 to 59 years) White / Caucasian 10 59.3% Responsible for grandchildren7 40.7% Not responsible for grandchildrenAsian 98 100.0% Not responsible for grandchildrenWhite alone, not Hispanic / Latino 13 69.4% Responsible for grandchildren6 30.6% Not responsible for grandchildrenGrandparents (60 years and over) White / Caucasian 8 13.4% Responsible for grandchildren53 86.6% Not responsible for grandchildrenAsian 16 31.0% Responsible for grandchildren36 69.0% Not responsible for grandchildrenWhite alone, not Hispanic / Latino 10 12.8% Responsible for grandchildren69 87.2% Not responsible for grandchildren