Races in Northeast Comanche, Oklahoma (OK) Detailed Stats
Ancestries, Foreign-born residents, place of birth
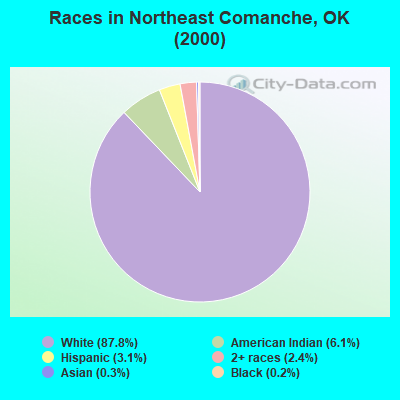
Race distribution in Northeast Comanche

- 4,88087.8%White alone
- 3416.1%American Indian alone
- 1703.1%Hispanic
- 1312.4%Two or more races
- 190.3%Asian alone
- 120.2%Black alone
- 10.02%Other race alone
- 10.02%Native Hawaiian and Other
Pacific Islander alone
2000
2022
-
- 2,556,36874.1%White alone
- 266,1587.7%American Indian alone
- 257,9817.5%Black alone
- 179,3045.2%Hispanic
- 140,2494.1%Two or more races
- 46,1721.3%Asian alone
- 2,3220.07%Other race alone
- 2,1000.06%Native Hawaiian and Other
Pacific Islander alone

-
- 2,517,40362.6%White alone
- 486,69212.1%Hispanic
- 364,4539.1%Two or more races
- 273,6506.8%American Indian alone
- 268,5436.7%Black alone
- 92,6722.3%Asian alone
- 10,7860.3%Other race alone
- 5,6010.1%Native Hawaiian and Other
Pacific Islander alone

Income and house value in Northeast Comanche
- Median household income in 2022
- $58,120White non-Hispanic householders
- $58,026American Indian and Alaska Native householders
- $62,084Some other race householders
- $87,220Two or more races householders
- $61,717Hispanic or Latino race householders
- Median 2022 house value
- $131,516White Non-Hispanic householders
- $115,256American Indian or Alaska Native householders
- $126,988Some other race householders
- $108,053Two or more races householders
- $109,699Hispanic or Latino householders
Household income for White non-Hispanic householders

Household income for American Indian and Alaska Native householders

Household income for Two or more races householders

Household income for Hispanic or Latino race householders

Zip code: 73538