Races in Northfield, Minnesota (MN) Detailed Stats
Data:
Races - White alone (%)
Races - White alone (% change since 2000)
Races - Black alone (%)
Races - Black alone (% change since 2000)
Races - American Indian alone (%)
Races - American Indian alone (% change since 2000)
Races - Asian alone (%)
Races - Asian alone (% change since 2000)
Races - Hispanic (%)
Races - Hispanic (% change since 2000)
Races - Native Hawaiian and Other Pacific Islander alone (%)
Races - Native Hawaiian and Other Pacific Islander alone (% change since 2000)
Races - Two or more races(%)
Races - Two or more races(% change since 2000)
Races - Other race alone (%)
Races - Other race alone (% change since 2000)
Racial diversity
Place of birth - Born in state of residence (%)
Place of birth - Born in state of residence (%) - White
Place of birth - Born in state of residence (%) - Black or African American
Place of birth - Born in state of residence (%) - Asian
Place of birth - Born in state of residence (%) - Hispanic or Latino
Place of birth - Born in state of residence (%) - American Indian and Alaska Native
Place of birth - Born in state of residence (%) - Multirace
Place of birth - Born in state of residence (%) - Other Race
Place of birth - Born in other state (%)
Place of birth - Born in other state (%) - White
Place of birth - Born in other state (%) - Black or African American
Place of birth - Born in other state (%) - Asian
Place of birth - Born in other state (%) - Hispanic or Latino
Place of birth - Born in other state (%) - American Indian and Alaska Native
Place of birth - Born in other state (%) - Multirace
Place of birth - Born in other state (%) - Other Race
Place of birth - Native, outside of US (%)
Place of birth - Native, outside of US (%) - White
Place of birth - Native, outside of US (%) - Black or African American
Place of birth - Native, outside of US (%) - Asian
Place of birth - Native, outside of US (%) - Hispanic or Latino
Place of birth - Native, outside of US (%) - American Indian and Alaska Native
Place of birth - Native, outside of US (%) - Multirace
Place of birth - Native, outside of US (%) - Other Race
Place of birth - Foreign born (%)
Place of birth - Foreign born (%) - White
Place of birth - Foreign born (%) - Black or African American
Place of birth - Foreign born (%) - Asian
Place of birth - Foreign born (%) - Hispanic or Latino
Place of birth - Foreign born (%) - American Indian and Alaska Native
Place of birth - Foreign born (%) - Multirace
Place of birth - Foreign born (%) - Other Race
Residents speaking English at home (%)
Residents speaking English at home - Born in the United States (%)
Residents speaking English at home - Native, born elsewhere (%)
Residents speaking English at home - Foreign born (%)
Residents speaking Spanish at home (%)
Residents speaking Spanish at home - Born in the United States (%)
Residents speaking Spanish at home - Native, born elsewhere (%)
Residents speaking Spanish at home - Foreign born (%)
Residents speaking other language at home (%)
Residents speaking other language at home - Born in the United States (%)
Residents speaking other language at home - Native, born elsewhere (%)
Residents speaking other language at home - Foreign born (%)
Marital status - Never married (%)
Marital status - Now married (%)
Marital status - Separated (%)
Marital status - Widowed (%)
Marital status - Divorced (%)
Ancestries Reported - Arab (%)
Ancestries Reported - Czech (%)
Ancestries Reported - Danish (%)
Ancestries Reported - Dutch (%)
Ancestries Reported - English (%)
Ancestries Reported - French (%)
Ancestries Reported - French Canadian (%)
Ancestries Reported - German (%)
Ancestries Reported - Greek (%)
Ancestries Reported - Hungarian (%)
Ancestries Reported - Irish (%)
Ancestries Reported - Italian (%)
Ancestries Reported - Lithuanian (%)
Ancestries Reported - Norwegian (%)
Ancestries Reported - Polish (%)
Ancestries Reported - Portuguese (%)
Ancestries Reported - Russian (%)
Ancestries Reported - Scotch-Irish (%)
Ancestries Reported - Scottish (%)
Ancestries Reported - Slovak (%)
Ancestries Reported - Subsaharan African (%)
Ancestries Reported - Swedish (%)
Ancestries Reported - Swiss (%)
Ancestries Reported - Ukrainian (%)
Ancestries Reported - United States (%)
Ancestries Reported - Welsh (%)
Ancestries Reported - West Indian (%)
Ancestries Reported - Other (%)
Geographical mobility - Same house 1 year ago (%)
Geographical mobility - Same house 1 year ago (%) - White
Geographical mobility - Same house 1 year ago (%) - Black or African American
Geographical mobility - Same house 1 year ago (%) - Asian
Geographical mobility - Same house 1 year ago (%) - Hispanic or Latino
Geographical mobility - Same house 1 year ago (%) - American Indian and Alaska Native
Geographical mobility - Same house 1 year ago (%) - Multirace
Geographical mobility - Same house 1 year ago (%) - Other Race
Geographical mobility - Moved within same county (%)
Geographical mobility - Moved within same county (%) - White
Geographical mobility - Moved within same county (%) - Black or African American
Geographical mobility - Moved within same county (%) - Asian
Geographical mobility - Moved within same county (%) - Hispanic or Latino
Geographical mobility - Moved within same county (%) - American Indian and Alaska Native
Geographical mobility - Moved within same county (%) - Multirace
Geographical mobility - Moved within same county (%) - Other Race
Geographical mobility - Moved from different county within same state (%)
Geographical mobility - Moved from different county within same state (%) - White
Geographical mobility - Moved from different county within same state (%) - Black or African American
Geographical mobility - Moved from different county within same state (%) - Asian
Geographical mobility - Moved from different county within same state (%) - Hispanic or Latino
Geographical mobility - Moved from different county within same state (%) - American Indian and Alaska Native
Geographical mobility - Moved from different county within same state (%) - Multirace
Geographical mobility - Moved from different county within same state (%) - Other Race
Geographical mobility - Moved from different state (%)
Geographical mobility - Moved from different state (%) - White
Geographical mobility - Moved from different state (%) - Black or African American
Geographical mobility - Moved from different state (%) - Asian
Geographical mobility - Moved from different state (%) - Hispanic or Latino
Geographical mobility - Moved from different state (%) - American Indian and Alaska Native
Geographical mobility - Moved from different state (%) - Multirace
Geographical mobility - Moved from different state (%) - Other Race
Geographical mobility - Moved from abroad (%)
Geographical mobility - Moved from abroad (%) - White
Geographical mobility - Moved from abroad (%) - Black or African American
Geographical mobility - Moved from abroad (%) - Asian
Geographical mobility - Moved from abroad (%) - Hispanic or Latino
Geographical mobility - Moved from abroad (%) - American Indian and Alaska Native
Geographical mobility - Moved from abroad (%) - Multirace
Geographical mobility - Moved from abroad (%) - Other Race
Place of birth for the foreign-born population - Ireland (%)
Place of birth for the foreign-born population - Denmark (%)
Place of birth for the foreign-born population - Norway (%)
Place of birth for the foreign-born population - Sweden (%)
Place of birth for the foreign-born population - United Kingdom (%)
Place of birth for the foreign-born population - England (%)
Place of birth for the foreign-born population - Scotland (%)
Place of birth for the foreign-born population - Other Northern Europe (%)
Place of birth for the foreign-born population - Austria (%)
Place of birth for the foreign-born population - Belgium (%)
Place of birth for the foreign-born population - France (%)
Place of birth for the foreign-born population - Germany (%)
Place of birth for the foreign-born population - Netherlands (%)
Place of birth for the foreign-born population - Switzerland (%)
Place of birth for the foreign-born population - Other Western Europe (%)
Place of birth for the foreign-born population - Greece (%)
Place of birth for the foreign-born population - Italy (%)
Place of birth for the foreign-born population - Portugal (%)
Place of birth for the foreign-born population - Spain (%)
Place of birth for the foreign-born population - Other Southern Europe (%)
Place of birth for the foreign-born population - Albania (%)
Place of birth for the foreign-born population - Belarus (%)
Place of birth for the foreign-born population - Bosnia and Herzegovina (%)
Place of birth for the foreign-born population - Bulgaria (%)
Place of birth for the foreign-born population - Croatia (%)
Place of birth for the foreign-born population - Czechoslovakia (%)
Place of birth for the foreign-born population - Hungary (%)
Place of birth for the foreign-born population - Latvia (%)
Place of birth for the foreign-born population - Lithuania (%)
Place of birth for the foreign-born population - North Macedonia (Macedonia) (%)
Place of birth for the foreign-born population - Moldova (%)
Place of birth for the foreign-born population - Poland (%)
Place of birth for the foreign-born population - Romania (%)
Place of birth for the foreign-born population - Russia (%)
Place of birth for the foreign-born population - Serbia (%)
Place of birth for the foreign-born population - Ukraine (%)
Place of birth for the foreign-born population - Other Eastern Europe (%)
Place of birth for the foreign-born population - China (%)
Place of birth for the foreign-born population - Hong Kong (%)
Place of birth for the foreign-born population - Taiwan (%)
Place of birth for the foreign-born population - Japan (%)
Place of birth for the foreign-born population - Korea (%)
Place of birth for the foreign-born population - Other Eastern Asia (%)
Place of birth for the foreign-born population - Afghanistan (%)
Place of birth for the foreign-born population - Bangladesh (%)
Place of birth for the foreign-born population - India (%)
Place of birth for the foreign-born population - Iran (%)
Place of birth for the foreign-born population - Kazakhstan (%)
Place of birth for the foreign-born population - Nepal (%)
Place of birth for the foreign-born population - Pakistan (%)
Place of birth for the foreign-born population - Sri Lanka (%)
Place of birth for the foreign-born population - Uzbekistan (%)
Place of birth for the foreign-born population - Other South Central Asia (%)
Place of birth for the foreign-born population - Burma (%)
Place of birth for the foreign-born population - Cambodia (%)
Place of birth for the foreign-born population - Indonesia (%)
Place of birth for the foreign-born population - Laos (%)
Place of birth for the foreign-born population - Malaysia (%)
Place of birth for the foreign-born population - Philippines (%)
Place of birth for the foreign-born population - Singapore (%)
Place of birth for the foreign-born population - Thailand (%)
Place of birth for the foreign-born population - Vietnam (%)
Place of birth for the foreign-born population - Other South Eastern Asia (%)
Place of birth for the foreign-born population - Armenia (%)
Place of birth for the foreign-born population - Iraq (%)
Place of birth for the foreign-born population - Israel (%)
Place of birth for the foreign-born population - Jordan (%)
Place of birth for the foreign-born population - Kuwait (%)
Place of birth for the foreign-born population - Lebanon (%)
Place of birth for the foreign-born population - Saudi Arabia (%)
Place of birth for the foreign-born population - Syria (%)
Place of birth for the foreign-born population - Turkey (%)
Place of birth for the foreign-born population - Yemen (%)
Place of birth for the foreign-born population - Other Western Asia (%)
Place of birth for the foreign-born population - Eritrea (%)
Place of birth for the foreign-born population - Ethiopia (%)
Place of birth for the foreign-born population - Kenya (%)
Place of birth for the foreign-born population - Somalia (%)
Place of birth for the foreign-born population - Uganda (%)
Place of birth for the foreign-born population - Zimbabwe (%)
Place of birth for the foreign-born population - Other Eastern Africa (%)
Place of birth for the foreign-born population - Cameroon (%)
Place of birth for the foreign-born population - Congo (%)
Place of birth for the foreign-born population - Democratic Republic of Congo (Zaire) (%)
Place of birth for the foreign-born population - Other Middle Africa (%)
Place of birth for the foreign-born population - Egypt (%)
Place of birth for the foreign-born population - Morocco (%)
Place of birth for the foreign-born population - Sudan (%)
Place of birth for the foreign-born population - Other Northern Africa (%)
Place of birth for the foreign-born population - South Africa (%)
Place of birth for the foreign-born population - Other Southern Africa (%)
Place of birth for the foreign-born population - Cabo Verde (%)
Place of birth for the foreign-born population - Ghana (%)
Place of birth for the foreign-born population - Liberia (%)
Place of birth for the foreign-born population - Nigeria (%)
Place of birth for the foreign-born population - Senegal (%)
Place of birth for the foreign-born population - Sierra Leone (%)
Place of birth for the foreign-born population - Other Western Africa (%)
Place of birth for the foreign-born population - Australia (%)
Place of birth for the foreign-born population - New Zealand (%)
Place of birth for the foreign-born population - Fiji (%)
Place of birth for the foreign-born population - Micronesia (%)
Place of birth for the foreign-born population - Bahamas (%)
Place of birth for the foreign-born population - Barbados (%)
Place of birth for the foreign-born population - Cuba (%)
Place of birth for the foreign-born population - Dominica (%)
Place of birth for the foreign-born population - Dominican Republic (%)
Place of birth for the foreign-born population - Grenada (%)
Place of birth for the foreign-born population - Haiti (%)
Place of birth for the foreign-born population - Jamaica (%)
Place of birth for the foreign-born population - St. Vincent and the Grenadines (%)
Place of birth for the foreign-born population - Trinidad and Tobago (%)
Place of birth for the foreign-born population - West Indies (%)
Place of birth for the foreign-born population - Other Caribbean (%)
Place of birth for the foreign-born population - Belize (%)
Place of birth for the foreign-born population - Costa Rica (%)
Place of birth for the foreign-born population - El Salvador (%)
Place of birth for the foreign-born population - Guatemala (%)
Place of birth for the foreign-born population - Honduras (%)
Place of birth for the foreign-born population - Mexico (%)
Place of birth for the foreign-born population - Nicaragua (%)
Place of birth for the foreign-born population - Panama (%)
Place of birth for the foreign-born population - Other Central America (%)
Place of birth for the foreign-born population - Argentina (%)
Place of birth for the foreign-born population - Bolivia (%)
Place of birth for the foreign-born population - Brazil (%)
Place of birth for the foreign-born population - Chile (%)
Place of birth for the foreign-born population - Colombia (%)
Place of birth for the foreign-born population - Ecuador (%)
Place of birth for the foreign-born population - Guyana (%)
Place of birth for the foreign-born population - Peru (%)
Place of birth for the foreign-born population - Uruguay (%)
Place of birth for the foreign-born population - Venezuela (%)
Place of birth for the foreign-born population - Other South America (%)
Place of birth for the foreign-born population - Canada (%)
Place of birth for the foreign-born population - Other Northern America (%)
Place of birth for the foreign-born population - Other (%)
Latest news about races in Northfield, MN collected exclusively by city-data.com from local newspapers, TV, and radio stations
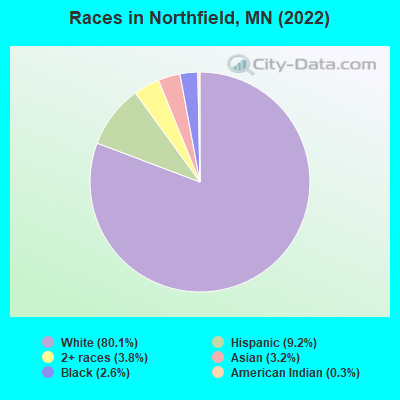
According to 2022 data, the most numerous races in Northfield, MN are White alone (16,567 residents), Black alone (537 residents), and Hispanic (1,901 residents). 89.1% of Northfield residents speak English at home. 7.6% of Northfield, MN residents are foreign-born (3.2% born in Latin America, 2.3% born in Asia, 0.9% born in Africa, 0.9% born in Europe), which is 5.7% less than the foreign-born rate of 8.0% across the entire state of Minnesota.
Race distribution in Northfield
2000 2022
4,337,143 88.2% White alone 168,813 3.4% Black alone 143,382 2.9% Hispanic 141,083 2.9% Asian alone 70,304 1.4% Two or more races 52,009 1.1% American Indian alone 5,031 0.1% Other race alone 1,714 0.03% Native Hawaiian and Other
4,356,347 76.2% White alone 395,179 6.9% Black alone 333,830 5.8% Hispanic 294,800 5.2% Asian alone 259,649 4.5% Two or more races 42,125 0.7% American Indian alone 32,976 0.6% Other race alone 2,278 0.04% Native Hawaiian and Other
Income and house value in Northfield Median household income in 2022 $91,280 White non-Hispanic householders$118,838 Black householders$82,636 American Indian and Alaska Native householders$32,207 Some other race householders$53,891 Two or more races householders$63,515 Hispanic or Latino race householdersMedian 2022 house value $331,963 White Non-Hispanic householders$286,127 Black or African American householders$260,431 American Indian or Alaska Native householders $243,069 Asian householders$253,255 Some other race householders$318,305 Two or more races householders$406,968 Hispanic or Latino householders
Median age by race in Northfield
33.5 Median age for White residents34.2 32.7 20.5 Median age for Black or African American residents23.2 28.0 18.9 Median age for American Indian / Alaska Native residents30.3 18.7 19.6 Median age for Asian residents21.8 19.0 -657,355,679.0 Median age for Native Hawaiian / Pacific Islander residents-662,942,271.2 -534,959,349.1 27.5 Median age for Other race residents18.8 22.1 24.3 Median age for Two or more races residents31.4 22.6 33.5 Median age for White alone residents34.6 33.0 27.7 Median age for Hispanic or Latino residents33.9 24.1
Owner/renter occupied households by race in Northfield
House owners and renters - White residents 3,948 74.8% Owner occupied1,331 25.2% Renter occupiedHouse owners and renters - Black or African American residents 35 48.1% Owner occupied38 51.9% Renter occupiedHouse owners and renters - American Indian / Alaska Native residents 10 75.1% Owner occupied3 24.9% Renter occupiedHouse owners and renters - Asian residents 70 59.7% Owner occupied47 40.3% Renter occupiedHouse owners and renters - Other race residents 90 37.7% Owner occupied148 62.3% Renter occupiedHouse owners and renters - Two or more races residents 320 53.5% Owner occupied279 46.5% Renter occupiedHouse owners and renters - White alone residents 3,956 75.5% Owner occupied1,285 24.5% Renter occupiedHouse owners and renters - Hispanic or Latino residents 270 39.1% Owner occupied420 60.9% Renter occupied
Language usage in Northfield
English speakers - Total 89.1% of residents of Northfield speak English at home.
4.9% of residents speak Spanish at home 537 54.9% Speak English very well442 45.1% Speak English less than very well5.5% of residents speak other language at home 743 67.9% Speak English very well351 32.1% Speak English less than very well
English speakers - Born in the United States 88.8% of residents of Northfield speak English at home.
3.8% of residents speak Spanish at home 171 69.5% Speak English very well75 30.5% Speak English less than very well6.6% of residents speak other language at home 265 62.1% Speak English very well162 37.9% Speak English less than very well
All residents speak only English at home
English speakers - Foreign-born 10.8% of residents of Northfield speak English at home.
26.1% of residents speak Spanish at home 145 34.0% Speak English very well281 66.0% Speak English less than very well38.4% of residents speak other language at home 479 76.4% Speak English very well148 23.6% Speak English less than very well
White (Caucasian) - Speak only English Native:
97.3% (15,451)Foreign-born:
24.6% (54)
White (Caucasian) - Speak another language Native:
2.6% (410)Foreign-born:
71.8% (157)
Black or African American - Speak only English Native:
95.5% (278)Foreign-born:
2.1% (4)
Black or African American - Speak another language Native:
2.0% (6)Foreign-born:
99.7% (192)
American Indian / Alaska Native - Speak only English Native:
99.4% (108)Foreign-born:
62.1% (5)
Asian - Speak only English Native:
56.2% (155)Foreign-born:
18.7% (68)
Asian - Speak another language Native:
43.5% (120)Foreign-born:
81.5% (295)
Other race - Speak another language Native:
74.3% (287)Foreign-born:
97.5% (346)
Two or more races - Speak only English Native:
81.8% (1,159)Foreign-born:
3.4% (17)
Two or more races - Speak another language Native:
16.5% (234)Foreign-born:
54.6% (270)
White alone - Speak only English Native:
96.9% (15,262)Foreign-born:
27.2% (61)
White alone - Speak another language Native:
3.2% (511)Foreign-born:
72.0% (161)
Hispanic or Latino - Speak only English Native:
75.5% (855)Foreign-born:
1.3% (8)
Hispanic or Latino - Speak another language Native:
33.4% (378)Foreign-born:
64.9% (404)
Foreign-born residents in Northfield 1,565 residents are foreign born (3.2% Latin America , 2.3% Asia , 0.9% Africa , 0.9% Europe ).
This city:
7.6%Minnesota:
8.5%
Marital status for residents in Northfield Marital status - White (Caucasian) population 15 years and over
Males 45.6% Never married41.5% Now married0.7% Separated3.1% Widowed9.2% DivorcedFemales 45.2% Never married36.6% Now married0.5% Separated7.8% Widowed9.9% DivorcedWomen who gave birth in the past 12 months Now married:
83.9% (116)Unmarried:
16.1% (22)
Women who did not give birth in the past 12 months Now married:
25.0% (1,201)Unmarried:
75.0% (3,600)
Marital status - Black or African American population 15 years and over
Males 57.0% Never married43.0% Now married0.0% Separated0.0% Widowed0.0% DivorcedFemales 53.9% Never married33.3% Now married0.0% Separated12.8% Widowed0.0% DivorcedWomen who gave birth in the past 12 months Now married:
100.0% (7)Unmarried:
0.0% (0)
Women who did not give birth in the past 12 months Now married:
0.0% (0)Unmarried:
100.0% (76)
Marital status - American Indian / Alaska Native population 15 years and over
Males 53.7% Never married40.7% Now married0.0% Separated0.0% Widowed5.6% DivorcedFemales 76.0% Never married0.0% Now married2.0% Separated12.0% Widowed10.0% DivorcedWomen who did not give birth in the past 12 months Now married:
2.4% (1)Unmarried:
97.6% (43)
Marital status - Asian population 15 years and over
Males 77.2% Never married12.5% Now married0.0% Separated0.0% Widowed10.3% DivorcedFemales 73.1% Never married25.1% Now married0.0% Separated0.0% Widowed1.8% DivorcedWomen who did not give birth in the past 12 months Now married:
11.5% (44)Unmarried:
88.5% (342)
Marital status - Other race population 15 years and over
Males 29.3% Never married39.1% Now married10.2% Separated0.0% Widowed21.4% DivorcedFemales 44.0% Never married16.5% Now married11.0% Separated0.0% Widowed28.6% DivorcedWomen who did not give birth in the past 12 months Now married:
32.1% (65)Unmarried:
67.9% (139)
Marital status - Two or more races population 15 years and over
Males 48.8% Never married39.9% Now married10.7% Separated0.0% Widowed0.7% DivorcedFemales 67.3% Never married26.4% Now married0.0% Separated0.0% Widowed6.3% DivorcedWomen who gave birth in the past 12 months Now married:
87.0% (26)Unmarried:
13.0% (4)
Women who did not give birth in the past 12 months Now married:
22.1% (143)Unmarried:
77.9% (505)
Marital status - White alone, not Hispanic / Latino population 15 years and over
Males 45.2% Never married42.0% Now married0.2% Separated3.2% Widowed9.5% DivorcedFemales 45.1% Never married36.3% Now married0.5% Separated8.0% Widowed10.1% DivorcedWomen who gave birth in the past 12 months Now married:
83.9% (119)Unmarried:
16.1% (23)
Women who did not give birth in the past 12 months Now married:
24.4% (1,162)Unmarried:
75.6% (3,599)
Marital status - Hispanic or Latino population 15 years and over
Males 36.8% Never married45.3% Now married9.1% Separated0.0% Widowed8.8% DivorcedFemales 49.6% Never married35.6% Now married3.1% Separated0.0% Widowed11.6% DivorcedWomen who gave birth in the past 12 months Now married:
100.0% (26)Unmarried:
0.0% (0)
Women who did not give birth in the past 12 months Now married:
39.0% (278)Unmarried:
61.0% (435)
Ancestries in Northfield
1,747 20.6% German1,553 18.3% Norwegian566 6.7% English402 4.7% Irish216 2.5% Scandinavian207 2.4% American180 2.1% European157 1.8% Swedish136 1.6% Polish104 1.2% Italian91 1.1% Czech66 0.8% Dutch49 0.6% Kenyan43 0.5% Swiss34 0.4% Finnish28 0.3% French27 0.3% Scotch-Irish23 0.3% Danish23 0.3% Eastern European23 0.3% Scottish21 0.2% British20 0.2% Australian17 0.2% Albanian16 0.2% Russian15 0.2% Greek14 0.2% Northern European14 0.2% Ukrainian13 0.2% Czechoslovakian13 0.2% Iranian12 0.1% French Canadian10 0.1% Croatian9 0.1% Luxembourger8 0.09% African8 0.09% Hungarian7 0.08% Somali5 0.06% Estonian5 0.06% Welsh4 0.05% Brazilian3 0.04% Austrian2 0.02% Pennsylvania German
Geographical mobility in Northfield Same house 1 year ago 12,384 75.0% White (Caucasian)334 66.0% Black or African American49 42.6% American Indian / Alaska Native529 63.5% Asian748 94.1% Other race1,228 71.5% Two or more races12,258 74.9% White alone, not Hispanic / Latino1,514 84.7% Hispanic or LatinoMoved within same county 1,489 9.0% White / Caucasian1 0.2% Black or African American15 1.8% Asian97 5.7% Two or more races1,503 9.2% White alone, not Hispanic / Latino76 4.3% Hispanic or LatinoMoved within same state 1,392 8.4% White / Caucasian128 25.2% Black or African American15 12.6% American Indian / Alaska Native57 6.8% Asian3 0.3% Other race206 12.0% Two or more races1,380 8.4% White alone, not Hispanic / Latino36 2.0% Hispanic or LatinoMoved from different state 1,393 8.4% White / Caucasian27 5.4% Black or African American46 39.4% American Indian / Alaska Native90 10.7% Asian3 99.3% Native Hawaiian / Pacific Islander5 0.6% Other race193 11.2% Two or more races1,386 8.5% White alone, not Hispanic / Latino97 5.4% Hispanic or LatinoMoved from abroad 132 0.8% White18 3.5% Black or African American162 19.4% Asian68 8.5% Other race132 0.8% White alone, not Hispanic / Latino68 3.8% Hispanic or Latino
Children Nativity (place of birth) in Northfield
Children under 6 years - Living with two parents Both parents native 604 100.0% Native0 0.0% Foreign-bornBoth parents foreign-born 58 93.4% Native4 6.6% Foreign-bornOne native, one foreign-born parent 57 100.0% NativeChildren under 6 years - Living with one parent Native parent 150 100.0% NativeChildren 6 to 17 years - Living with two parents Both parents native 1,398 99.6% Native6 0.4% Foreign-bornBoth parents foreign-born 152 90.0% Native17 10.0% Foreign-bornOne native, one foreign-born parent 76 100.0% NativeChildren 6 to 17 years - Living with one parent Native parent 575 100.0% NativeForeign-born parent 122 50.4% Native119 49.6% Foreign-born
Grandparents responsible for own grandchildren in Northfield
Grandparents (30 to 59 years) White / Caucasian 17 20.0% Responsible for grandchildren66 80.0% Not responsible for grandchildrenBlack or African American 7 100.0% Not responsible for grandchildrenAsian 5 100.0% Responsible for grandchildrenWhite alone, not Hispanic / Latino 17 20.0% Responsible for grandchildren68 80.0% Not responsible for grandchildrenGrandparents (60 years and over) White / Caucasian 10 30.7% Responsible for grandchildren22 69.3% Not responsible for grandchildrenAsian 13 100.0% Not responsible for grandchildrenWhite alone, not Hispanic / Latino 10 30.9% Responsible for grandchildren23 69.1% Not responsible for grandchildren