Races in Northwest Jackson, Oregon (OR) Detailed Stats
Ancestries, Foreign-born residents, place of birth
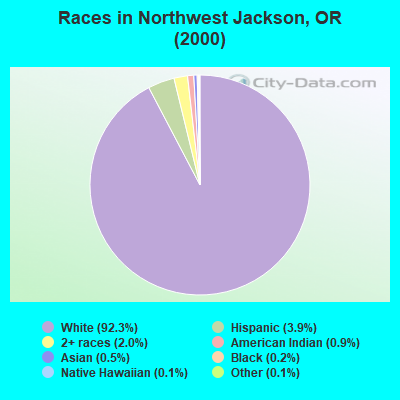
Race distribution in Northwest Jackson

- 6,53392.3%White alone
- 2743.9%Hispanic
- 1402.0%Two or more races
- 660.9%American Indian alone
- 360.5%Asian alone
- 110.2%Black alone
- 80.1%Other race alone
- 100.1%Native Hawaiian and Other
Pacific Islander alone
2000
2022
-
- 2,857,61683.5%White alone
- 275,3148.0%Hispanic
- 100,3332.9%Asian alone
- 82,7332.4%Two or more races
- 53,3251.6%Black alone
- 40,1301.2%American Indian alone
- 7,3980.2%Native Hawaiian and Other
Pacific Islander alone - 4,5500.1%Other race alone

-
- 3,037,57171.6%White alone
- 609,53814.4%Hispanic
- 252,7446.0%Two or more races
- 191,2834.5%Asian alone
- 78,2281.8%Black alone
- 29,3990.7%American Indian alone
- 25,7310.6%Other race alone
- 15,6430.4%Native Hawaiian and Other
Pacific Islander alone

Income and house value in Northwest Jackson
- Median household income in 2022
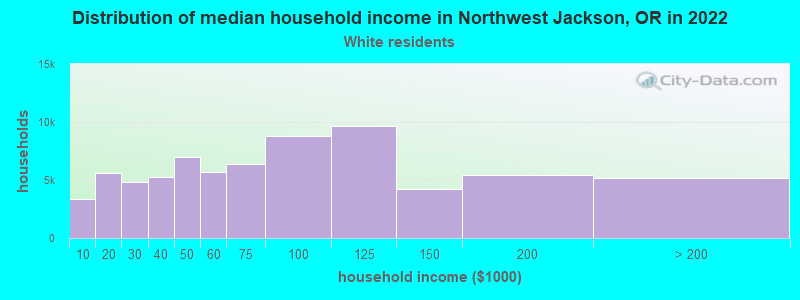
- $63,854White non-Hispanic householders
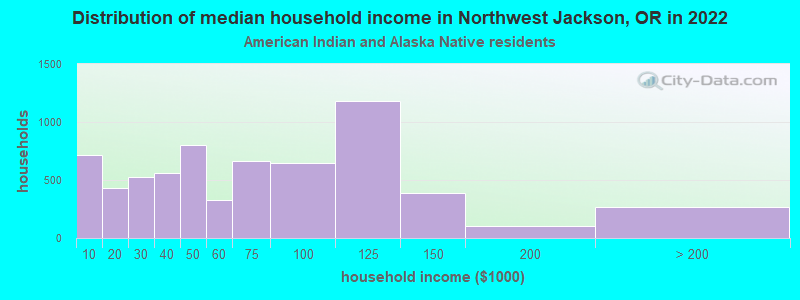
- $37,350American Indian and Alaska Native householders
- $62,515Some other race householders
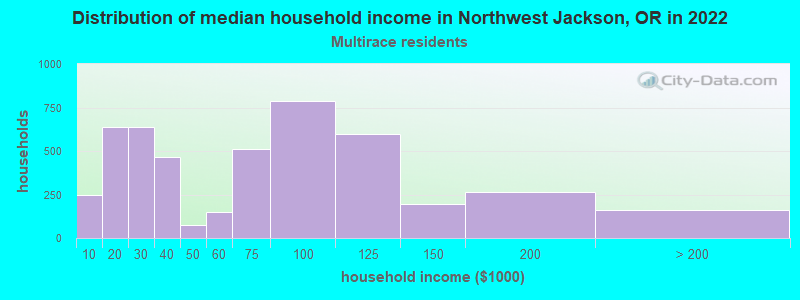
- $37,204Two or more races householders
- $51,320Hispanic or Latino race householders
- Median 2022 house value
- $475,971White Non-Hispanic householders
- $273,917American Indian or Alaska Native householders
- $286,163Some other race householders
- $653,534Two or more races householders
- $408,620Hispanic or Latino householders
Household income for White non-Hispanic householders
Household income for American Indian and Alaska Native householders
Household income for Native Hawaiian and other Pacific Islander householders

Household income for Two or more races householders
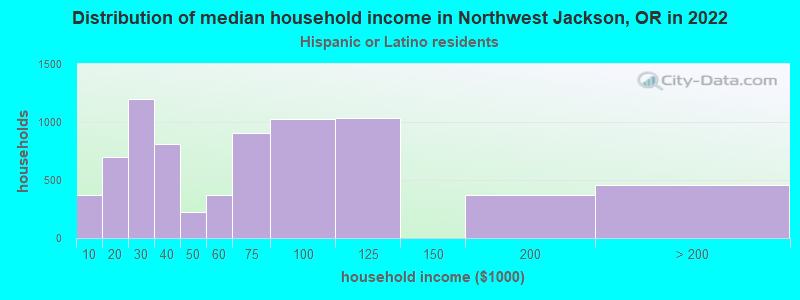
Household income for Hispanic or Latino race householders
Zip code: 97537