Races in Nurillo, Texas (TX) Detailed Stats
Ancestries, Foreign-born residents, place of birth

Discuss Nurillo, Texas races on our local forum with over 2,400,000 registered users
33.9% of Nurillo, TX residents are foreign-born (33.9% born in Latin America), which is 49.9% greater than the foreign-born rate of 17.0% across the entire state of Texas.
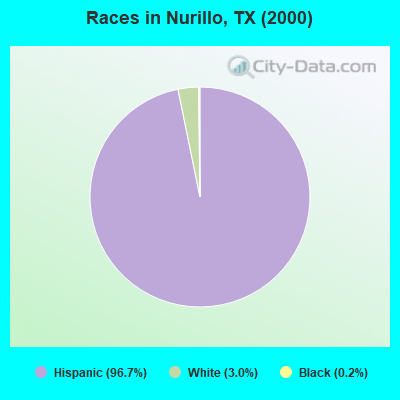
Race distribution in Nurillo

- 4,88996.7%Hispanic
- 1513.0%White alone
- 110.2%Black alone
- 40.08%Two or more races
- 10.02%Other race alone
2000
2022
-
- 10,933,31352.4%White alone
- 6,669,66632.0%Hispanic
- 2,364,25511.3%Black alone
- 554,4452.7%Asian alone
- 230,5671.1%Two or more races
- 68,8590.3%American Indian alone
- 19,9580.10%Other race alone
- 10,7570.05%Native Hawaiian and Other
Pacific Islander alone

-
- 12,070,64240.2%Hispanic
- 11,683,43038.9%White alone
- 3,508,70611.7%Black alone
- 1,608,1735.4%Asian alone
- 956,5603.2%Two or more races
- 125,7630.4%Other race alone
- 47,0230.2%American Indian alone
- 29,2750.10%Native Hawaiian and Other
Pacific Islander alone

Income and house value in Nurillo
- Median household income in 2022
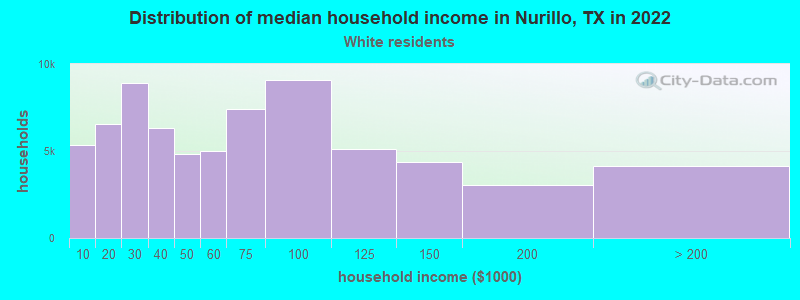
- $90,722White non-Hispanic householders
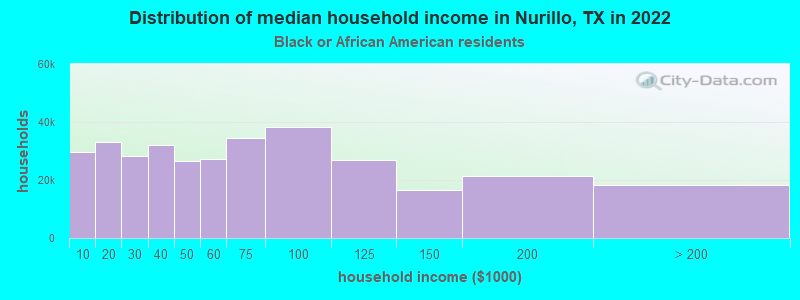
- $18,650Black householders
- $37,991Some other race householders
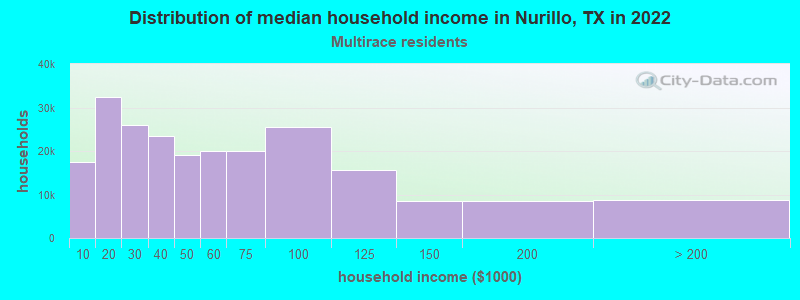
- $62,606Two or more races householders
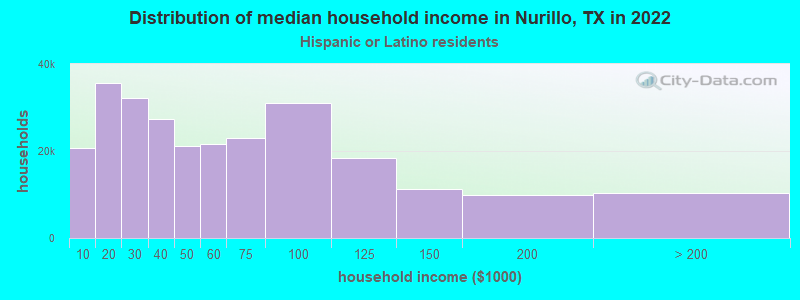
- $51,716Hispanic or Latino race householders
- Median 2022 house value
- $153,280White Non-Hispanic householders
- $117,783Some other race householders
- $26,888Two or more races householders
- $118,052Hispanic or Latino householders
Household income for White non-Hispanic householders
Household income for Black householders
Household income for Two or more races householders
Household income for Hispanic or Latino race householders
Foreign-born residents in Nurillo
1,716 residents are foreign born (33.9% Latin America).
| This city: | 33.9% |
| Texas: | 13.9% |
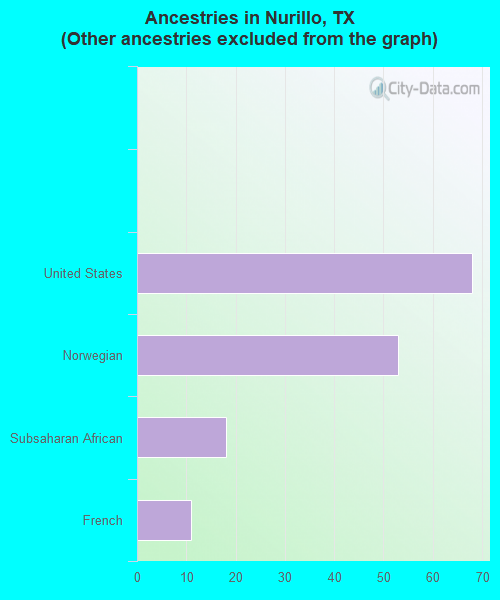
Ancestries in Nurillo

- 4,94997.1%Other
- 681.3%United States
- 531.0%Norwegian
- 180.4%Subsaharan African
- 110.2%French
Zip codes: 78539.