Races in Ocean Acres, New Jersey (NJ) Detailed Stats
Ancestries, Foreign-born residents, place of birth
Settings
X


Recent posts about races in Ocean Acres, New Jersey on our local forum with over 2,400,000 registered users:
 | Southern Ocean County info (9 replies) |
| Brick Township (6 replies) |
| Possibly Moving to Barnegat - Seeking Information (9 replies) |
| Ocean Acres in Barnaget, NJ (0 replies) |
| Barnegat or Little Egg Harbor? (3 replies) |
| Ryan Homes in Barnegat. (94 replies) |
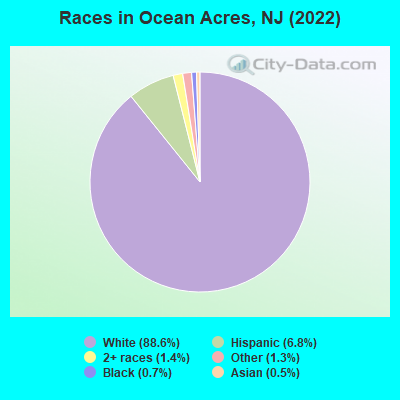
According to 2022 data, the most numerous races in Ocean Acres, NJ are White alone (16,586 residents), Hispanic (1,275 residents), and Black alone (135 residents). 92.9% of Ocean Acres residents speak English at home. 4.5% of Ocean Acres, NJ residents are foreign-born (2.2% born in Latin America, 1.7% born in Europe, 0.6% born in Asia), which is 408.2% less than the foreign-born rate of 23.0% across the entire state of New Jersey.
Race distribution in Ocean Acres
2000
2022

- 12,40694.3%White alone
- 3652.8%Hispanic
- 1230.9%Black alone
- 1220.9%Asian alone
- 1100.8%Two or more races
- 140.1%American Indian alone
- 120.09%Other race alone
- 30.02%Native Hawaiian and Other
Pacific Islander alone

-
- 16,58688.6%White alone
- 1,2756.8%Hispanic
- 2611.4%Two or more races
- 2521.3%Other race alone
- 1350.7%Black alone
- 1010.5%Asian alone
2000
2022
-
- 5,557,20966.0%White alone
- 1,117,19113.3%Hispanic
- 1,096,17113.0%Black alone
- 477,0125.7%Asian alone
- 133,6891.6%Two or more races
- 19,5650.2%Other race alone
- 11,3380.1%American Indian alone
- 2,1750.03%Native Hawaiian and Other
Pacific Islander alone

-
- 4,766,47651.5%White alone
- 2,028,47021.9%Hispanic
- 1,111,63212.0%Black alone
- 923,54610.0%Asian alone
- 332,2373.6%Two or more races
- 89,8471.0%Other race alone
- 8,5570.09%American Indian alone
- 9340.01%Native Hawaiian and Other
Pacific Islander alone

Income and house value in Ocean Acres
- Median household income in 2022
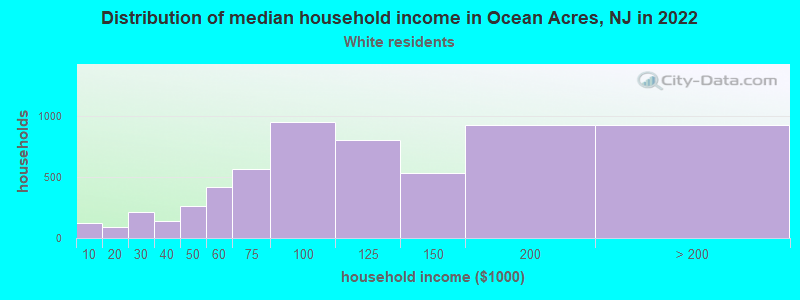
- $102,863White non-Hispanic householders
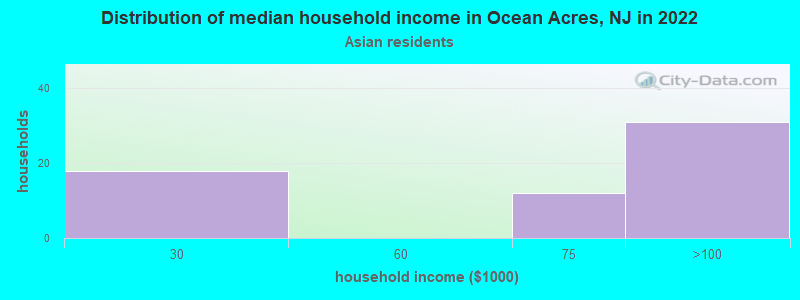
- $82,506Asian householders
- $46,020Some other race householders
- $163,605Two or more races householders
- $125,570Hispanic or Latino race householders
- Median 2022 house value
- $359,793White Non-Hispanic householders
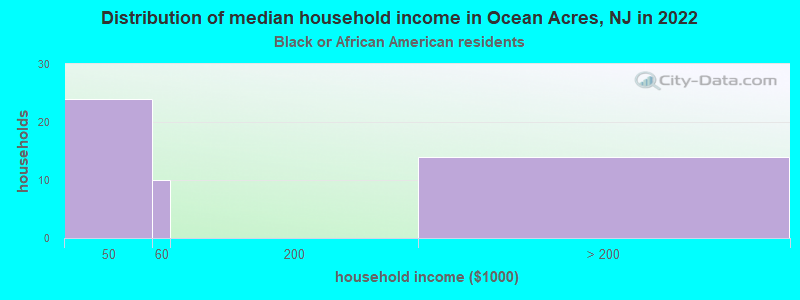
- $592,079Black or African American householders
- $306,018Asian householders
- $450,435Some other race householders
- $454,870Two or more races householders
- $410,242Hispanic or Latino householders
Household income for White non-Hispanic householders
Household income for Black householders
Household income for Asian householders
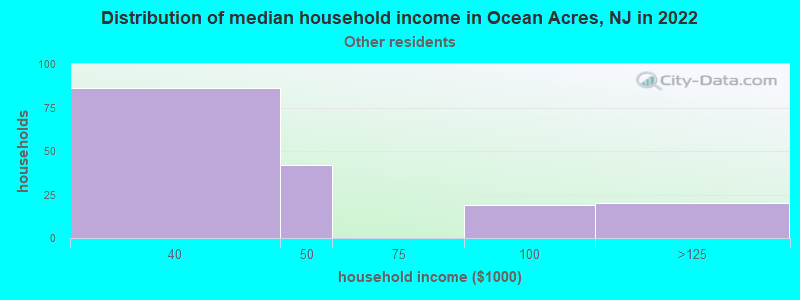
Household income for Some other race householders
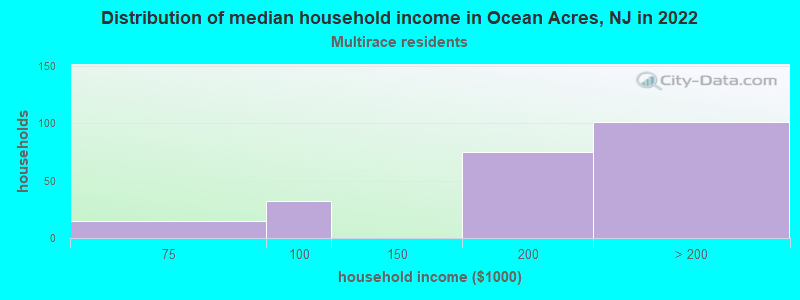
Household income for Two or more races householders
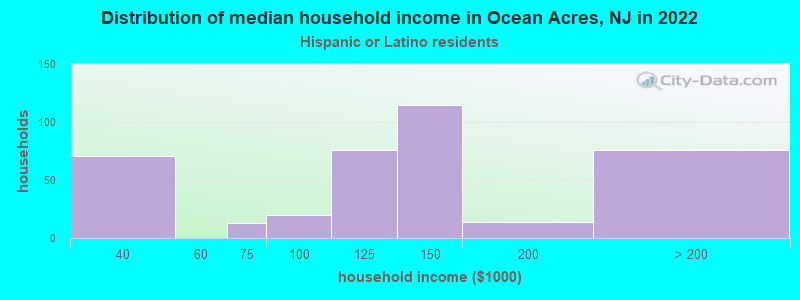
Household income for Hispanic or Latino race householders
Median age by race in Ocean Acres
- 42.4Median age for White residents
- 41.7Males
- 42.9Females
- 37.4Median age for Black or African American residents
- -657,060,518.1Males
- 16.7Females
- -669,774,669.1Median age for American Indian / Alaska Native residents
- -531,446,540.3Males
- -678,185,744.5Females
- 48.0Median age for Asian residents
- 43.1Males
- 44.2Females
- -804,177,544.9Median age for Native Hawaiian / Pacific Islander residents
- -860,335,194.7Males
- -713,070,378.3Females
- 29.9Median age for Other race residents
- 15.3Males
- 40.8Females
- 33.4Median age for Two or more races residents
- 30.9Males
- 33.5Females
- 42.3Median age for White alone residents
- 41.8Males
- 43.2Females
- 30.5Median age for Hispanic or Latino residents
- 33.4Males
- 27.2Females
Owner/renter occupied households by race in Ocean Acres
- House owners and renters - White residents
- 5,67593.9%Owner occupied
- 3676.1%Renter occupied
- House owners and renters - Black or African American residents
- 31100.0%Owner occupied
- House owners and renters - Asian residents
- 52100.0%Owner occupied
- House owners and renters - Other race residents
- 13867.6%Owner occupied
- 6632.4%Renter occupied
- House owners and renters - Two or more races residents
- 265100.0%Owner occupied
- House owners and renters - White alone residents
- 5,53593.5%Owner occupied
- 3886.5%Renter occupied
- House owners and renters - Hispanic or Latino residents
- 33387.8%Owner occupied
- 4612.2%Renter occupied
Language usage in Ocean Acres
- English speakers - Total
- 92.9% of residents of Ocean Acres speak English at home.
- 4.2% of residents speak Spanish at home
- 54972.0%Speak English very well
- 21428.0%Speak English less than very well
- 2.9% of residents speak other language at home
- 29256.6%Speak English very well
- 22443.4%Speak English less than very well
- English speakers - Born in the United States
- 98.1% of residents of Ocean Acres speak English at home.
- 1.5% of residents speak Spanish at home
- 59100.0%Speak English less than very well
- 0.5% of residents speak other language at home
- 20100.0%Speak English very well
- English speakers - Native, born elsewhere
- 43.9% of residents of Ocean Acres speak English at home.
- 68.4% of residents speak Spanish at home
- 67100.0%Speak English very well
- English speakers - Foreign-born
- 16.3% of residents of Ocean Acres speak English at home.
- 32.8% of residents speak Spanish at home
- 14151.1%Speak English very well
- 13548.9%Speak English less than very well
- 49.5% of residents speak other language at home
- 18845.1%Speak English very well
- 22954.9%Speak English less than very well
White (Caucasian) - Speak only English
| Native: | 98.4% (15,594) |
| Foreign-born: | 22.1% (79) |
White (Caucasian) - Speak another language
| Native: | 2.1% (330) |
| Foreign-born: | 73.3% (264) |
Black or African American - Speak only English
| Native: | 100.0% (87) |
| Foreign-born: | 100.0% (35) |
Asian - Speak another language
| Native: | 80.6% (8) |
| Foreign-born: | 100.0% (98) |
Other race - Speak only English
| Native: | 21.9% (54) |
| Foreign-born: | 11.9% (31) |
Other race - Speak another language
| Native: | 65.8% (162) |
| Foreign-born: | 88.9% (229) |
White alone - Speak only English
| Native: | 98.2% (15,445) |
| Foreign-born: | 25.7% (83) |
White alone - Speak another language
| Native: | 1.9% (292) |
| Foreign-born: | 73.1% (237) |
Hispanic or Latino - Speak only English
| Native: | 67.4% (572) |
| Foreign-born: | 7.1% (22) |
Hispanic or Latino - Speak another language
| Native: | 31.3% (265) |
| Foreign-born: | 92.4% (287) |
Foreign-born residents in Ocean Acres
847 residents are foreign born (2.2% Latin America, 1.7% Europe, 0.6% Asia).
| This city: | 4.5% |
| New Jersey: | 23.2% |


Marital status for residents in Ocean Acres
Marital status - White (Caucasian) population 15 years and over
- Males
- 32.4%Never married
- 56.0%Now married
- 0.4%Separated
- 3.6%Widowed
- 7.5%Divorced
- Females
- 29.5%Never married
- 51.8%Now married
- 0.6%Separated
- 6.1%Widowed
- 12.0%Divorced
Women who gave birth in the past 12 months
| Now married: | 79.2% (116) |
| Unmarried: | 20.8% (30) |
Women who did not give birth in the past 12 months
| Now married: | 43.4% (1,635) |
| Unmarried: | 56.6% (2,132) |
Marital status - Black or African American population 15 years and over
- Males
- 0.0%Never married
- 100.0%Now married
- 0.0%Separated
- 0.0%Widowed
- 0.0%Divorced
- Females
- 59.4%Never married
- 40.6%Now married
- 0.0%Separated
- 0.0%Widowed
- 0.0%Divorced
Women who did not give birth in the past 12 months
| Now married: | 25.5% (13) |
| Unmarried: | 74.5% (39) |
Marital status - Asian population 15 years and over
- Males
- 80.0%Never married
- 20.0%Now married
- 0.0%Separated
- 0.0%Widowed
- 0.0%Divorced
- Females
- 86.8%Never married
- 13.2%Now married
- 0.0%Separated
- 0.0%Widowed
- 0.0%Divorced
Women who did not give birth in the past 12 months
| Now married: | 0.0% (0) |
| Unmarried: | 100.0% (35) |
Marital status - Other race population 15 years and over
- Males
- 52.2%Never married
- 47.8%Now married
- 0.0%Separated
- 0.0%Widowed
- 0.0%Divorced
- Females
- 0.0%Never married
- 82.0%Now married
- 0.0%Separated
- 0.0%Widowed
- 18.0%Divorced
Women who did not give birth in the past 12 months
| Now married: | 56.1% (71) |
| Unmarried: | 43.9% (56) |
Marital status - Two or more races population 15 years and over
- Males
- 42.8%Never married
- 57.2%Now married
- 0.0%Separated
- 0.0%Widowed
- 0.0%Divorced
- Females
- 47.1%Never married
- 42.5%Now married
- 0.0%Separated
- 0.0%Widowed
- 10.4%Divorced
Women who did not give birth in the past 12 months
| Now married: | 45.9% (170) |
| Unmarried: | 54.1% (200) |
Marital status - White alone, not Hispanic / Latino population 15 years and over
- Males
- 32.1%Never married
- 56.2%Now married
- 0.4%Separated
- 3.5%Widowed
- 7.8%Divorced
- Females
- 29.8%Never married
- 51.7%Now married
- 0.4%Separated
- 5.8%Widowed
- 12.2%Divorced
Women who gave birth in the past 12 months
| Now married: | 79.2% (122) |
| Unmarried: | 20.8% (32) |
Women who did not give birth in the past 12 months
| Now married: | 42.6% (1,643) |
| Unmarried: | 57.4% (2,217) |
Marital status - Hispanic or Latino population 15 years and over
- Males
- 50.3%Never married
- 46.7%Now married
- 0.0%Separated
- 2.9%Widowed
- 0.0%Divorced
- Females
- 24.9%Never married
- 59.2%Now married
- 3.5%Separated
- 6.6%Widowed
- 5.9%Divorced
Women who did not give birth in the past 12 months
| Now married: | 58.9% (163) |
| Unmarried: | 41.1% (113) |
Ancestries in Ocean Acres

- 1,78829.9%Italian
- 94915.9%Irish
- 5599.3%American
- 4497.5%German
- 4207.0%Polish
- 1322.2%English
- 1202.0%European
- 581.0%Czech
- 450.8%Welsh
- 430.7%Croatian
- 380.6%Ukrainian
- 370.6%Slavic
- 360.6%Dutch
- 350.6%Jamaican
- 330.6%Brazilian
- 300.5%British
- 260.4%Hungarian
- 260.4%Lithuanian
- 250.4%Scotch-Irish
- 190.3%Slovak
- 150.3%Portuguese
- 140.2%Canadian
- 110.2%Swedish
- 100.2%French Canadian

Geographical mobility in Ocean Acres

- Same house 1 year ago
- 15,72994.4%White (Caucasian)
- 146100.0%Black or African American
- 122100.0%Asian
- 702100.0%Other race
- 64789.0%Two or more races
- 15,57294.3%White alone, not Hispanic / Latino
- 1,25798.4%Hispanic or Latino

-
- Moved within same county
- 6664.0%White / Caucasian
- 6483.9%White alone, not Hispanic / Latino

-
- Moved within same state
- 1520.9%White / Caucasian
- 395.4%Two or more races
- 1621.0%White alone, not Hispanic / Latino

-
- Moved from different state
- 980.6%White / Caucasian
- 689.4%Two or more races
- 1020.6%White alone, not Hispanic / Latino
- 463.6%Hispanic or Latino

-
- Moved from abroad
- 480.3%White
- 560.3%White alone, not Hispanic / Latino

Children Nativity (place of birth) in Ocean Acres
Place of birth for residents in Ocean Acres
![Place of birth for the foreign-born population - Regions]()
- 419Americas
- 406Latin America
- 319Europe
- 163Central America
- 162Eastern Europe
- 145South America
- 113Southern Europe
- 108Asia
- 108South Eastern Asia
- 97Caribbean
- 34Northern Europe
- 13Northern America
- 8Western Europe

![Place of birth for the foreign-born population - Countries]()
- 106Honduras
- 88Croatia
- 79Italy
- 72Brazil
- 59Vietnam
- 59Cuba
- 53Poland
- 48Philippines
- 40El Salvador
- 37Jamaica
- 36Ecuador
- 36Uruguay
- 34Ireland
- 20Ukraine
- 18Spain
- 16Portugal
- 16Mexico
- 13Canada
- 8Germany

Zip codes: 08050.