Races in Olequa, Washington (WA) Detailed Stats
Ancestries, Foreign-born residents, place of birth
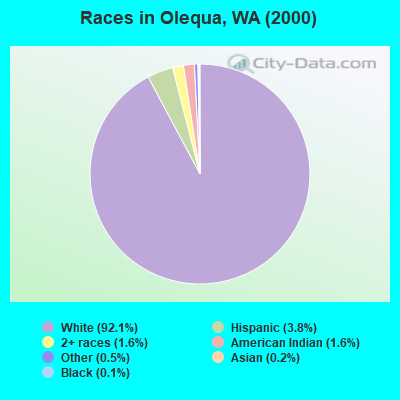
Race distribution in Olequa

- 3,26292.1%White alone
- 1353.8%Hispanic
- 581.6%Two or more races
- 561.6%American Indian alone
- 160.5%Other race alone
- 60.2%Asian alone
- 40.1%Black alone
- 30.08%Native Hawaiian and Other
Pacific Islander alone
2000
2022
-
- 4,652,49078.9%White alone
- 441,5097.5%Hispanic
- 319,4015.4%Asian alone
- 184,6313.1%Black alone
- 175,9263.0%Two or more races
- 85,3961.4%American Indian alone
- 22,7790.4%Native Hawaiian and Other
Pacific Islander alone - 11,9890.2%Other race alone

-
- 4,941,45663.5%White alone
- 1,093,31314.0%Hispanic
- 755,8329.7%Asian alone
- 523,4486.7%Two or more races
- 299,5373.8%Black alone
- 69,0240.9%American Indian alone
- 52,2310.7%Native Hawaiian and Other
Pacific Islander alone - 50,9450.7%Other race alone

Income and house value in Olequa
- Median household income in 2022
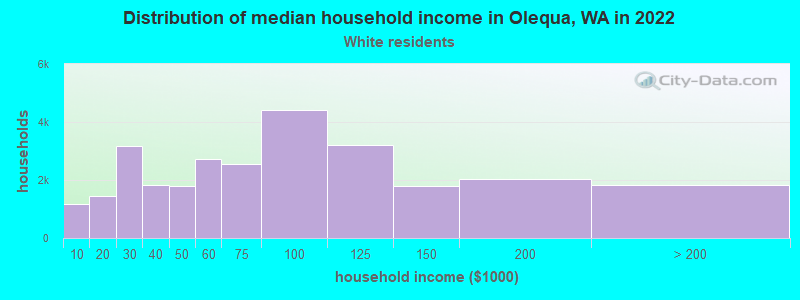
- $71,662White non-Hispanic householders
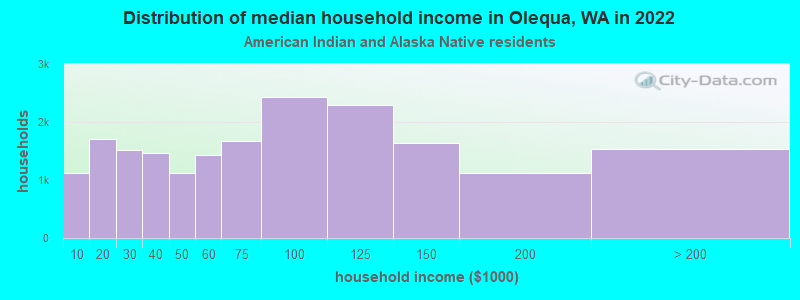
- $79,964American Indian and Alaska Native householders
- $59,806Some other race householders
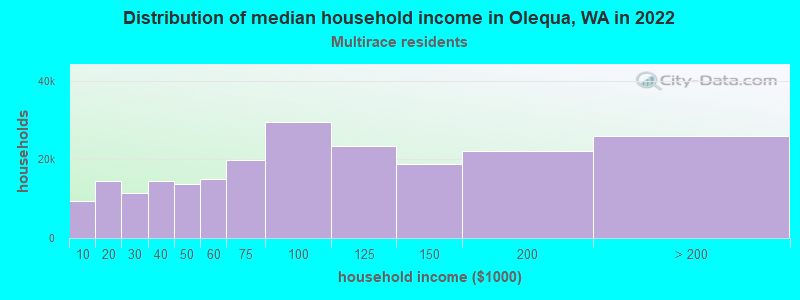
- $124,220Two or more races householders
- $40,593Hispanic or Latino race householders
- Median 2022 house value
- $340,350White Non-Hispanic householders
- $373,555Black or African American householders
- $352,968American Indian or Alaska Native householders
- $373,555Some other race householders
- $435,980Two or more races householders
- $315,446Hispanic or Latino householders
Household income for White non-Hispanic householders
Household income for Black householders

Household income for American Indian and Alaska Native householders
Household income for Asian householders

Household income for Two or more races householders
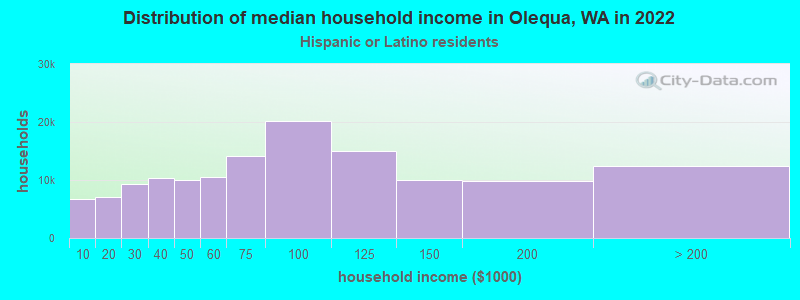
Household income for Hispanic or Latino race householders
Zip code: 98596