Races in Orange Cove, California (CA) Detailed Stats
Data:
Races - White alone (%)
Races - White alone (% change since 2000)
Races - Black alone (%)
Races - Black alone (% change since 2000)
Races - American Indian alone (%)
Races - American Indian alone (% change since 2000)
Races - Asian alone (%)
Races - Asian alone (% change since 2000)
Races - Hispanic (%)
Races - Hispanic (% change since 2000)
Races - Native Hawaiian and Other Pacific Islander alone (%)
Races - Native Hawaiian and Other Pacific Islander alone (% change since 2000)
Races - Two or more races(%)
Races - Two or more races(% change since 2000)
Races - Other race alone (%)
Races - Other race alone (% change since 2000)
Racial diversity
Place of birth - Born in state of residence (%)
Place of birth - Born in state of residence (%) - White
Place of birth - Born in state of residence (%) - Black or African American
Place of birth - Born in state of residence (%) - Asian
Place of birth - Born in state of residence (%) - Hispanic or Latino
Place of birth - Born in state of residence (%) - American Indian and Alaska Native
Place of birth - Born in state of residence (%) - Multirace
Place of birth - Born in state of residence (%) - Other Race
Place of birth - Born in other state (%)
Place of birth - Born in other state (%) - White
Place of birth - Born in other state (%) - Black or African American
Place of birth - Born in other state (%) - Asian
Place of birth - Born in other state (%) - Hispanic or Latino
Place of birth - Born in other state (%) - American Indian and Alaska Native
Place of birth - Born in other state (%) - Multirace
Place of birth - Born in other state (%) - Other Race
Place of birth - Native, outside of US (%)
Place of birth - Native, outside of US (%) - White
Place of birth - Native, outside of US (%) - Black or African American
Place of birth - Native, outside of US (%) - Asian
Place of birth - Native, outside of US (%) - Hispanic or Latino
Place of birth - Native, outside of US (%) - American Indian and Alaska Native
Place of birth - Native, outside of US (%) - Multirace
Place of birth - Native, outside of US (%) - Other Race
Place of birth - Foreign born (%)
Place of birth - Foreign born (%) - White
Place of birth - Foreign born (%) - Black or African American
Place of birth - Foreign born (%) - Asian
Place of birth - Foreign born (%) - Hispanic or Latino
Place of birth - Foreign born (%) - American Indian and Alaska Native
Place of birth - Foreign born (%) - Multirace
Place of birth - Foreign born (%) - Other Race
Residents speaking English at home (%)
Residents speaking English at home - Born in the United States (%)
Residents speaking English at home - Native, born elsewhere (%)
Residents speaking English at home - Foreign born (%)
Residents speaking Spanish at home (%)
Residents speaking Spanish at home - Born in the United States (%)
Residents speaking Spanish at home - Native, born elsewhere (%)
Residents speaking Spanish at home - Foreign born (%)
Residents speaking other language at home (%)
Residents speaking other language at home - Born in the United States (%)
Residents speaking other language at home - Native, born elsewhere (%)
Residents speaking other language at home - Foreign born (%)
Marital status - Never married (%)
Marital status - Now married (%)
Marital status - Separated (%)
Marital status - Widowed (%)
Marital status - Divorced (%)
Ancestries Reported - Arab (%)
Ancestries Reported - Czech (%)
Ancestries Reported - Danish (%)
Ancestries Reported - Dutch (%)
Ancestries Reported - English (%)
Ancestries Reported - French (%)
Ancestries Reported - French Canadian (%)
Ancestries Reported - German (%)
Ancestries Reported - Greek (%)
Ancestries Reported - Hungarian (%)
Ancestries Reported - Irish (%)
Ancestries Reported - Italian (%)
Ancestries Reported - Lithuanian (%)
Ancestries Reported - Norwegian (%)
Ancestries Reported - Polish (%)
Ancestries Reported - Portuguese (%)
Ancestries Reported - Russian (%)
Ancestries Reported - Scotch-Irish (%)
Ancestries Reported - Scottish (%)
Ancestries Reported - Slovak (%)
Ancestries Reported - Subsaharan African (%)
Ancestries Reported - Swedish (%)
Ancestries Reported - Swiss (%)
Ancestries Reported - Ukrainian (%)
Ancestries Reported - United States (%)
Ancestries Reported - Welsh (%)
Ancestries Reported - West Indian (%)
Ancestries Reported - Other (%)
Geographical mobility - Same house 1 year ago (%)
Geographical mobility - Same house 1 year ago (%) - White
Geographical mobility - Same house 1 year ago (%) - Black or African American
Geographical mobility - Same house 1 year ago (%) - Asian
Geographical mobility - Same house 1 year ago (%) - Hispanic or Latino
Geographical mobility - Same house 1 year ago (%) - American Indian and Alaska Native
Geographical mobility - Same house 1 year ago (%) - Multirace
Geographical mobility - Same house 1 year ago (%) - Other Race
Geographical mobility - Moved within same county (%)
Geographical mobility - Moved within same county (%) - White
Geographical mobility - Moved within same county (%) - Black or African American
Geographical mobility - Moved within same county (%) - Asian
Geographical mobility - Moved within same county (%) - Hispanic or Latino
Geographical mobility - Moved within same county (%) - American Indian and Alaska Native
Geographical mobility - Moved within same county (%) - Multirace
Geographical mobility - Moved within same county (%) - Other Race
Geographical mobility - Moved from different county within same state (%)
Geographical mobility - Moved from different county within same state (%) - White
Geographical mobility - Moved from different county within same state (%) - Black or African American
Geographical mobility - Moved from different county within same state (%) - Asian
Geographical mobility - Moved from different county within same state (%) - Hispanic or Latino
Geographical mobility - Moved from different county within same state (%) - American Indian and Alaska Native
Geographical mobility - Moved from different county within same state (%) - Multirace
Geographical mobility - Moved from different county within same state (%) - Other Race
Geographical mobility - Moved from different state (%)
Geographical mobility - Moved from different state (%) - White
Geographical mobility - Moved from different state (%) - Black or African American
Geographical mobility - Moved from different state (%) - Asian
Geographical mobility - Moved from different state (%) - Hispanic or Latino
Geographical mobility - Moved from different state (%) - American Indian and Alaska Native
Geographical mobility - Moved from different state (%) - Multirace
Geographical mobility - Moved from different state (%) - Other Race
Geographical mobility - Moved from abroad (%)
Geographical mobility - Moved from abroad (%) - White
Geographical mobility - Moved from abroad (%) - Black or African American
Geographical mobility - Moved from abroad (%) - Asian
Geographical mobility - Moved from abroad (%) - Hispanic or Latino
Geographical mobility - Moved from abroad (%) - American Indian and Alaska Native
Geographical mobility - Moved from abroad (%) - Multirace
Geographical mobility - Moved from abroad (%) - Other Race
Place of birth for the foreign-born population - Ireland (%)
Place of birth for the foreign-born population - Denmark (%)
Place of birth for the foreign-born population - Norway (%)
Place of birth for the foreign-born population - Sweden (%)
Place of birth for the foreign-born population - United Kingdom (%)
Place of birth for the foreign-born population - England (%)
Place of birth for the foreign-born population - Scotland (%)
Place of birth for the foreign-born population - Other Northern Europe (%)
Place of birth for the foreign-born population - Austria (%)
Place of birth for the foreign-born population - Belgium (%)
Place of birth for the foreign-born population - France (%)
Place of birth for the foreign-born population - Germany (%)
Place of birth for the foreign-born population - Netherlands (%)
Place of birth for the foreign-born population - Switzerland (%)
Place of birth for the foreign-born population - Other Western Europe (%)
Place of birth for the foreign-born population - Greece (%)
Place of birth for the foreign-born population - Italy (%)
Place of birth for the foreign-born population - Portugal (%)
Place of birth for the foreign-born population - Spain (%)
Place of birth for the foreign-born population - Other Southern Europe (%)
Place of birth for the foreign-born population - Albania (%)
Place of birth for the foreign-born population - Belarus (%)
Place of birth for the foreign-born population - Bosnia and Herzegovina (%)
Place of birth for the foreign-born population - Bulgaria (%)
Place of birth for the foreign-born population - Croatia (%)
Place of birth for the foreign-born population - Czechoslovakia (%)
Place of birth for the foreign-born population - Hungary (%)
Place of birth for the foreign-born population - Latvia (%)
Place of birth for the foreign-born population - Lithuania (%)
Place of birth for the foreign-born population - North Macedonia (Macedonia) (%)
Place of birth for the foreign-born population - Moldova (%)
Place of birth for the foreign-born population - Poland (%)
Place of birth for the foreign-born population - Romania (%)
Place of birth for the foreign-born population - Russia (%)
Place of birth for the foreign-born population - Serbia (%)
Place of birth for the foreign-born population - Ukraine (%)
Place of birth for the foreign-born population - Other Eastern Europe (%)
Place of birth for the foreign-born population - China (%)
Place of birth for the foreign-born population - Hong Kong (%)
Place of birth for the foreign-born population - Taiwan (%)
Place of birth for the foreign-born population - Japan (%)
Place of birth for the foreign-born population - Korea (%)
Place of birth for the foreign-born population - Other Eastern Asia (%)
Place of birth for the foreign-born population - Afghanistan (%)
Place of birth for the foreign-born population - Bangladesh (%)
Place of birth for the foreign-born population - India (%)
Place of birth for the foreign-born population - Iran (%)
Place of birth for the foreign-born population - Kazakhstan (%)
Place of birth for the foreign-born population - Nepal (%)
Place of birth for the foreign-born population - Pakistan (%)
Place of birth for the foreign-born population - Sri Lanka (%)
Place of birth for the foreign-born population - Uzbekistan (%)
Place of birth for the foreign-born population - Other South Central Asia (%)
Place of birth for the foreign-born population - Burma (%)
Place of birth for the foreign-born population - Cambodia (%)
Place of birth for the foreign-born population - Indonesia (%)
Place of birth for the foreign-born population - Laos (%)
Place of birth for the foreign-born population - Malaysia (%)
Place of birth for the foreign-born population - Philippines (%)
Place of birth for the foreign-born population - Singapore (%)
Place of birth for the foreign-born population - Thailand (%)
Place of birth for the foreign-born population - Vietnam (%)
Place of birth for the foreign-born population - Other South Eastern Asia (%)
Place of birth for the foreign-born population - Armenia (%)
Place of birth for the foreign-born population - Iraq (%)
Place of birth for the foreign-born population - Israel (%)
Place of birth for the foreign-born population - Jordan (%)
Place of birth for the foreign-born population - Kuwait (%)
Place of birth for the foreign-born population - Lebanon (%)
Place of birth for the foreign-born population - Saudi Arabia (%)
Place of birth for the foreign-born population - Syria (%)
Place of birth for the foreign-born population - Turkey (%)
Place of birth for the foreign-born population - Yemen (%)
Place of birth for the foreign-born population - Other Western Asia (%)
Place of birth for the foreign-born population - Eritrea (%)
Place of birth for the foreign-born population - Ethiopia (%)
Place of birth for the foreign-born population - Kenya (%)
Place of birth for the foreign-born population - Somalia (%)
Place of birth for the foreign-born population - Uganda (%)
Place of birth for the foreign-born population - Zimbabwe (%)
Place of birth for the foreign-born population - Other Eastern Africa (%)
Place of birth for the foreign-born population - Cameroon (%)
Place of birth for the foreign-born population - Congo (%)
Place of birth for the foreign-born population - Democratic Republic of Congo (Zaire) (%)
Place of birth for the foreign-born population - Other Middle Africa (%)
Place of birth for the foreign-born population - Egypt (%)
Place of birth for the foreign-born population - Morocco (%)
Place of birth for the foreign-born population - Sudan (%)
Place of birth for the foreign-born population - Other Northern Africa (%)
Place of birth for the foreign-born population - South Africa (%)
Place of birth for the foreign-born population - Other Southern Africa (%)
Place of birth for the foreign-born population - Cabo Verde (%)
Place of birth for the foreign-born population - Ghana (%)
Place of birth for the foreign-born population - Liberia (%)
Place of birth for the foreign-born population - Nigeria (%)
Place of birth for the foreign-born population - Senegal (%)
Place of birth for the foreign-born population - Sierra Leone (%)
Place of birth for the foreign-born population - Other Western Africa (%)
Place of birth for the foreign-born population - Australia (%)
Place of birth for the foreign-born population - New Zealand (%)
Place of birth for the foreign-born population - Fiji (%)
Place of birth for the foreign-born population - Micronesia (%)
Place of birth for the foreign-born population - Bahamas (%)
Place of birth for the foreign-born population - Barbados (%)
Place of birth for the foreign-born population - Cuba (%)
Place of birth for the foreign-born population - Dominica (%)
Place of birth for the foreign-born population - Dominican Republic (%)
Place of birth for the foreign-born population - Grenada (%)
Place of birth for the foreign-born population - Haiti (%)
Place of birth for the foreign-born population - Jamaica (%)
Place of birth for the foreign-born population - St. Vincent and the Grenadines (%)
Place of birth for the foreign-born population - Trinidad and Tobago (%)
Place of birth for the foreign-born population - West Indies (%)
Place of birth for the foreign-born population - Other Caribbean (%)
Place of birth for the foreign-born population - Belize (%)
Place of birth for the foreign-born population - Costa Rica (%)
Place of birth for the foreign-born population - El Salvador (%)
Place of birth for the foreign-born population - Guatemala (%)
Place of birth for the foreign-born population - Honduras (%)
Place of birth for the foreign-born population - Mexico (%)
Place of birth for the foreign-born population - Nicaragua (%)
Place of birth for the foreign-born population - Panama (%)
Place of birth for the foreign-born population - Other Central America (%)
Place of birth for the foreign-born population - Argentina (%)
Place of birth for the foreign-born population - Bolivia (%)
Place of birth for the foreign-born population - Brazil (%)
Place of birth for the foreign-born population - Chile (%)
Place of birth for the foreign-born population - Colombia (%)
Place of birth for the foreign-born population - Ecuador (%)
Place of birth for the foreign-born population - Guyana (%)
Place of birth for the foreign-born population - Peru (%)
Place of birth for the foreign-born population - Uruguay (%)
Place of birth for the foreign-born population - Venezuela (%)
Place of birth for the foreign-born population - Other South America (%)
Place of birth for the foreign-born population - Canada (%)
Place of birth for the foreign-born population - Other Northern America (%)
Place of birth for the foreign-born population - Other (%)
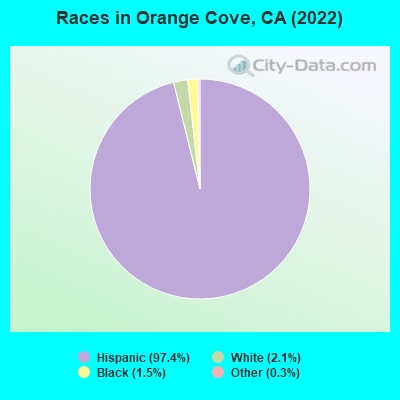
According to 2022 data, the most numerous races in Orange Cove, CA are Hispanic (10,225 residents), White alone (328 residents), and Asian alone (0 residents). 18.0% of Orange Cove residents speak English at home. 35.4% of Orange Cove, CA residents are foreign-born (35.5% born in Latin America), which is 26.5% greater than the foreign-born rate of 26.0% across the entire state of California.
Race distribution in Orange Cove
2000 2022
15,816,790 46.7% White alone 10,966,556 32.4% Hispanic 3,648,860 10.8% Asian alone 2,181,926 6.4% Black alone 903,115 2.7% Two or more races 178,984 0.5% American Indian alone 103,736 0.3% Native Hawaiian and Other 71,681 0.2% Other race alone
15,732,184 40.3% Hispanic 13,160,426 33.7% White alone 5,957,867 15.3% Asian alone 2,025,218 5.2% Black alone 1,663,222 4.3% Two or more races 251,618 0.6% Other race alone 135,777 0.3% Native Hawaiian and Other 103,030 0.3% American Indian alone
Income and house value in Orange Cove Median household income in 2022 $25,877 White non-Hispanic householders$46,720 Black householders$105,496 American Indian and Alaska Native householders$38,931 Asian householders$43,856 Some other race householders$62,546 Two or more races householders$38,143 Hispanic or Latino race householdersMedian 2022 house value $298,021 White Non-Hispanic householders$254,110 American Indian or Alaska Native householders $314,938 Asian householders$294,782 Some other race householders$261,668 Two or more races householders$285,784 Hispanic or Latino householders
Median age by race in Orange Cove
25.2 Median age for White residents22.4 27.9 12.4 Median age for Black or African American residents62.3 Median age for American Indian / Alaska Native residents56.0 Median age for Native Hawaiian / Pacific Islander residents29.1 Median age for Other race residents33.9 27.1 14.8 Median age for Two or more races residents56.0 Median age for White alone residents58.2 55.9 25.9 Median age for Hispanic or Latino residents23.4 27.3
Owner/renter occupied households by race in Orange Cove
House owners and renters - White residents 647 41.9% Owner occupied897 58.1% Renter occupiedHouse owners and renters - Black or African American residents 26 100.0% Renter occupiedHouse owners and renters - American Indian / Alaska Native residents 29 54.1% Owner occupied25 45.9% Renter occupiedHouse owners and renters - Asian residents 19 100.0% Owner occupiedHouse owners and renters - Native Hawaiian / Pacific Islander residents 33 100.0% Renter occupiedHouse owners and renters - Other race residents 330 33.9% Owner occupied644 66.1% Renter occupiedHouse owners and renters - Two or more races residents 29 100.0% Owner occupiedHouse owners and renters - White alone residents 37 30.1% Owner occupied87 69.9% Renter occupiedHouse owners and renters - Hispanic or Latino residents 1,136 41.8% Owner occupied1,581 58.2% Renter occupied
Language usage in Orange Cove
English speakers - Total 18.0% of residents of Orange Cove speak English at home.
80.2% of residents speak Spanish at home 3,675 50.1% Speak English very well3,659 49.9% Speak English less than very well
English speakers - Born in the United States 33.1% of residents of Orange Cove speak English at home.
64.9% of residents speak Spanish at home 134 45.3% Speak English very well162 54.7% Speak English less than very well
English speakers - Native, born elsewhere 0.0% of residents of Orange Cove speak English at home.
102.4% of residents speak Spanish at home 41 48.8% Speak English very well43 51.2% Speak English less than very well
English speakers - Foreign-born 2.9% of residents of Orange Cove speak English at home.
93.1% of residents speak Spanish at home 699 21.0% Speak English very well2,627 79.0% Speak English less than very well
White (Caucasian) - Speak only English Native:
30.4% (1,009)Foreign-born:
1.9% (27)
White (Caucasian) - Speak another language Native:
55.6% (1,847)Foreign-born:
94.5% (1,351)
Other race - Speak only English Native:
15.5% (291)Foreign-born:
3.5% (51)
Other race - Speak another language Native:
84.1% (1,574)Foreign-born:
95.6% (1,418)
Two or more races - Speak another language Native:
44.5% (55)Foreign-born:
100.0% (45)
White alone - Speak only English Native:
96.5% (310)Foreign-born:
82.5% (5)
Hispanic or Latino - Speak only English Native:
21.9% (1,234)Foreign-born:
2.3% (79)
Hispanic or Latino - Speak another language Native:
77.5% (4,365)Foreign-born:
97.2% (3,284)
Foreign-born residents in Orange Cove 3,697 residents are foreign born (35.5% Latin America ).
This city:
35.4%California:
100.0%
Marital status for residents in Orange Cove Marital status - White (Caucasian) population 15 years and over
Males 48.0% Never married37.8% Now married4.6% Separated2.5% Widowed7.1% DivorcedFemales 38.5% Never married38.9% Now married7.0% Separated4.8% Widowed10.8% DivorcedWomen who gave birth in the past 12 months Now married:
12.2% (11)Unmarried:
87.8% (79)
Women who did not give birth in the past 12 months Now married:
43.6% (503)Unmarried:
56.4% (651)
Marital status - American Indian / Alaska Native population 15 years and over
Males 65.4% Never married34.6% Now married0.0% Separated0.0% Widowed0.0% DivorcedFemales 0.0% Never married100.0% Now married0.0% Separated0.0% Widowed0.0% DivorcedMarital status - Other race population 15 years and over
Males 44.6% Never married50.4% Now married0.0% Separated1.7% Widowed3.4% DivorcedFemales 40.9% Never married44.0% Now married7.0% Separated8.2% Widowed0.0% DivorcedWomen who gave birth in the past 12 months Now married:
30.6% (35)Unmarried:
69.4% (80)
Women who did not give birth in the past 12 months Now married:
49.3% (432)Unmarried:
50.7% (443)
Marital status - Two or more races population 15 years and over
Males 70.6% Never married0.0% Now married0.0% Separated29.4% Widowed0.0% DivorcedFemales 0.0% Never married0.0% Now married0.0% Separated0.0% Widowed100.0% DivorcedWomen who did not give birth in the past 12 months Now married:
0.0% (0)Unmarried:
100.0% (36)
Marital status - White alone, not Hispanic / Latino population 15 years and over
Males 22.1% Never married46.1% Now married0.0% Separated0.0% Widowed31.8% DivorcedFemales 0.0% Never married68.5% Now married10.9% Separated4.8% Widowed15.8% DivorcedWomen who did not give birth in the past 12 months Now married:
100.0% (46)Unmarried:
0.0% (0)
Marital status - Hispanic or Latino population 15 years and over
Males 48.3% Never married41.2% Now married3.3% Separated2.6% Widowed4.6% DivorcedFemales 40.8% Never married39.1% Now married6.7% Separated6.4% Widowed7.0% DivorcedWomen who gave birth in the past 12 months Now married:
20.7% (46)Unmarried:
79.3% (176)
Women who did not give birth in the past 12 months Now married:
44.0% (994)Unmarried:
56.0% (1,267)
Ancestries in Orange Cove
33 0.4% Irish26 0.3% American10 0.1% Scandinavian8 0.10% Portuguese5 0.06% German
Children Nativity (place of birth) in Orange Cove
Children under 6 years - Living with two parents Both parents native 34 100.0% NativeBoth parents foreign-born 193 100.0% NativeOne native, one foreign-born parent 220 100.0% NativeChildren under 6 years - Living with one parent Native parent 347 99.9% Native0 0.1% Foreign-bornForeign-born parent 292 87.3% Native42 12.7% Foreign-bornChildren 6 to 17 years - Living with two parents Both parents native 171 99.9% Native0 0.1% Foreign-bornBoth parents foreign-born 665 92.2% Native56 7.8% Foreign-bornOne native, one foreign-born parent 342 100.0% NativeChildren 6 to 17 years - Living with one parent Native parent 523 100.0% NativeForeign-born parent 802 51.2% Native763 48.8% Foreign-born
Place of birth for residents in Orange Cove 3,690 Americas3,690 Latin America3,690 Central America7 Europe7 Western Europe
Grandparents responsible for own grandchildren in Orange Cove
Grandparents (30 to 59 years) White / Caucasian 8 13.4% Responsible for grandchildren53 86.6% Not responsible for grandchildrenOther race 135 100.0% Not responsible for grandchildrenWhite alone, not Hispanic / Latino 16 100.0% Not responsible for grandchildrenHispanic or Latino 14 8.8% Responsible for grandchildren149 91.2% Not responsible for grandchildrenGrandparents (60 years and over) White / Caucasian 6 4.5% Responsible for grandchildren122 95.5% Not responsible for grandchildrenOther race 173 100.0% Not responsible for grandchildrenWhite alone, not Hispanic / Latino 8 100.0% Responsible for grandchildrenHispanic or Latino 26 8.2% Responsible for grandchildren290 91.8% Not responsible for grandchildren