Races in Orchard, Idaho (ID) Detailed Stats
Ancestries, Foreign-born residents, place of birth
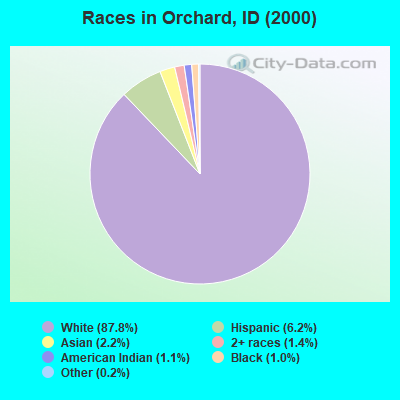
Race distribution in Orchard

- 12,95687.8%White alone
- 9156.2%Hispanic
- 3192.2%Asian alone
- 2131.4%Two or more races
- 1591.1%American Indian alone
- 1491.0%Black alone
- 270.2%Other race alone
- 110.07%Native Hawaiian and Other
Pacific Islander alone
2000
2022
-
- 1,139,29188.0%White alone
- 101,6907.9%Hispanic
- 18,2611.4%Two or more races
- 15,7891.2%American Indian alone
- 11,6410.9%Asian alone
- 4,8890.4%Black alone
- 1,1920.09%Other race alone
- 1,2000.09%Native Hawaiian and Other
Pacific Islander alone

-
- 1,531,21979.0%White alone
- 261,92113.5%Hispanic
- 81,1124.2%Two or more races
- 25,1741.3%Asian alone
- 15,8250.8%American Indian alone
- 11,8680.6%Black alone
- 8,7520.5%Other race alone
- 3,1620.2%Native Hawaiian and Other
Pacific Islander alone

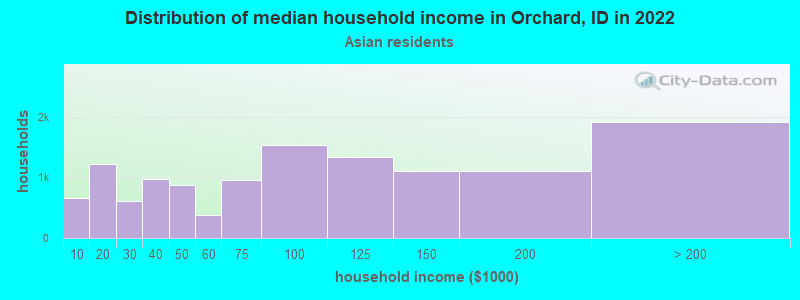
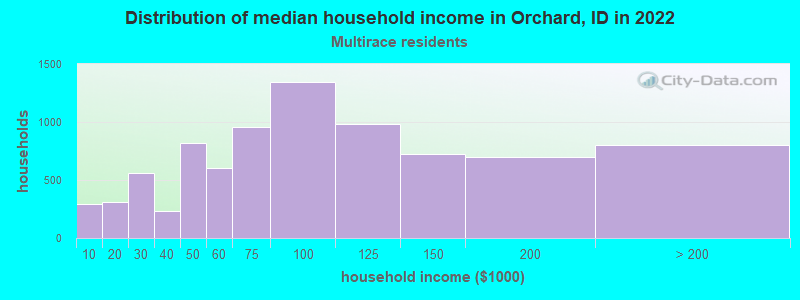
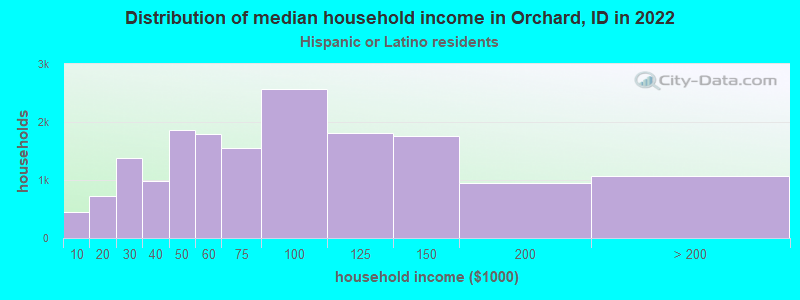
Income and house value in Orchard
- Median household income in 2022
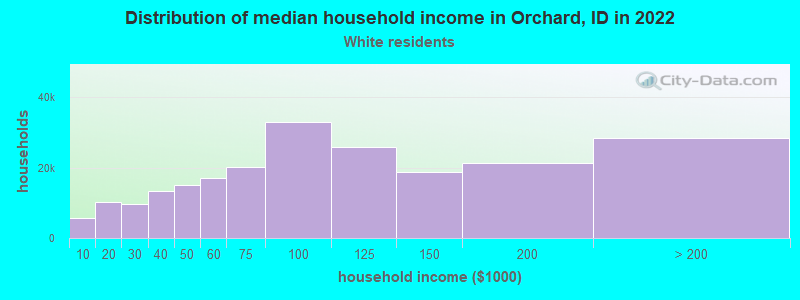
- $110,199White non-Hispanic householders
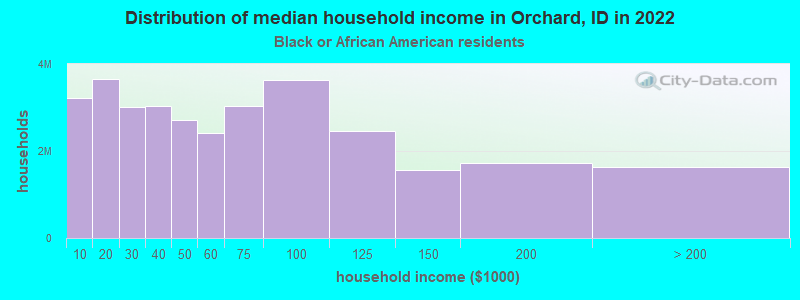
- $76,992Black householders
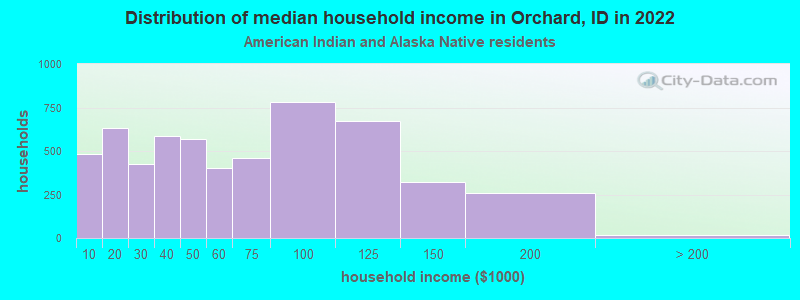
- $49,301American Indian and Alaska Native householders
- $151,590Asian householders
- $72,234Some other race householders
- $52,304Two or more races householders
- $95,768Hispanic or Latino race householders
- Median 2022 house value
- $551,147White Non-Hispanic householders
- $441,546Black or African American householders
- $519,255American Indian or Alaska Native householders
- $515,212Asian householders
- $456,369Some other race householders
- $540,367Two or more races householders
- $527,340Hispanic or Latino householders
Household income for White non-Hispanic householders
Household income for Black householders
Household income for American Indian and Alaska Native householders
Household income for Asian householders
Household income for Two or more races householders
Household income for Hispanic or Latino race householders
Zip code: 83650