Races in Oskaloosa, Iowa (IA) Detailed Stats
Ancestries, Foreign-born residents, place of birth
Settings
X


Recent posts about races in Oskaloosa, Iowa on our local forum with over 2,400,000 registered users:
 | What do you love and hate about living in Iowa? (200 replies) |
| Oskaloosa, anyone? Debating on moving from Portland. Maybe Des Moines? (14 replies) |
| Please tell me that Iowa is not ALL bad! (190 replies) |
| So You Are Thinking of Moving to Iowa (64 replies) |
| Should I move to Iowa? (36 replies) |
| Tell me all you know about Ottumwa, IA (7 replies) |
Latest news about races in Oskaloosa, IA collected exclusively by city-data.com from local newspapers, TV, and radio stations
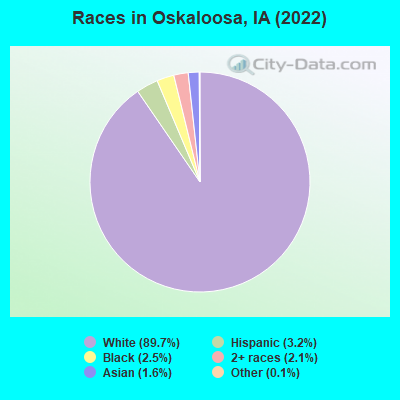
According to 2022 data, the most numerous races in Oskaloosa, IA are White alone (10,351 residents), Hispanic (374 residents), and Black alone (286 residents). 96.8% of Oskaloosa residents speak English at home. 2.3% of Oskaloosa, IA residents are foreign-born (1.5% born in Asia, 0.5% born in Europe), which is 119.3% less than the foreign-born rate of 5.0% across the entire state of Iowa.
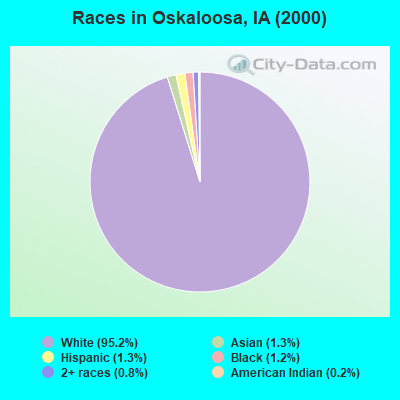
Race distribution in Oskaloosa
2000
2022

- 10,40895.2%White alone
- 1381.3%Hispanic
- 1441.3%Asian alone
- 1261.2%Black alone
- 910.8%Two or more races
- 250.2%American Indian alone
- 30.03%Other race alone
- 30.03%Native Hawaiian and Other
Pacific Islander alone
-
- 10,35189.7%White alone
- 3743.2%Hispanic
- 2862.5%Black alone
- 2392.1%Two or more races
- 1881.6%Asian alone
- 160.1%Other race alone
- 40.03%American Indian alone
2000
2022
-
- 2,710,34492.6%White alone
- 82,4732.8%Hispanic
- 60,7442.1%Black alone
- 36,3451.2%Asian alone
- 25,4720.9%Two or more races
- 7,9550.3%American Indian alone
- 2,1030.07%Other race alone
- 8880.03%Native Hawaiian and Other
Pacific Islander alone

-
- 2,650,11082.8%White alone
- 218,0246.8%Hispanic
- 119,0043.7%Black alone
- 115,2863.6%Two or more races
- 74,8922.3%Asian alone
- 9,2600.3%Other race alone
- 8,5950.3%Native Hawaiian and Other
Pacific Islander alone - 5,3460.2%American Indian alone

Income and house value in Oskaloosa
- Median household income in 2022
- $57,701White non-Hispanic householders
- $52,116Black householders
- $96,218Some other race householders
- $30,964Two or more races householders
- $102,170Hispanic or Latino race householders
- Median 2022 house value
- $134,504White Non-Hispanic householders
- $35,827Black or African American householders
- $153,544Asian householders
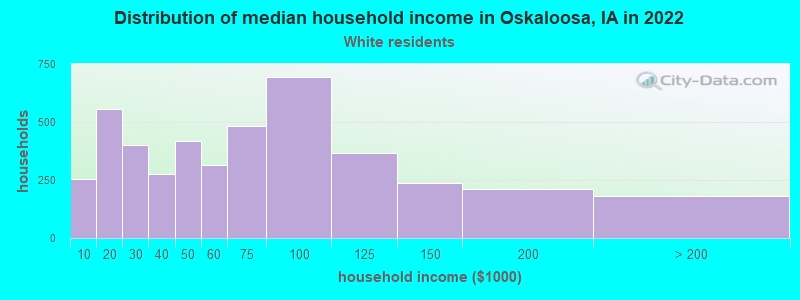
Household income for White non-Hispanic householders
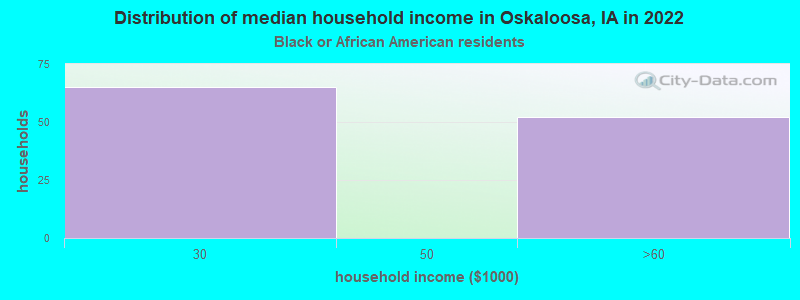
Household income for Black householders
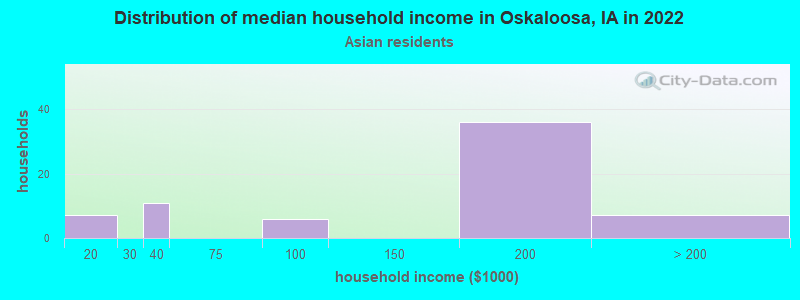
Household income for Asian householders
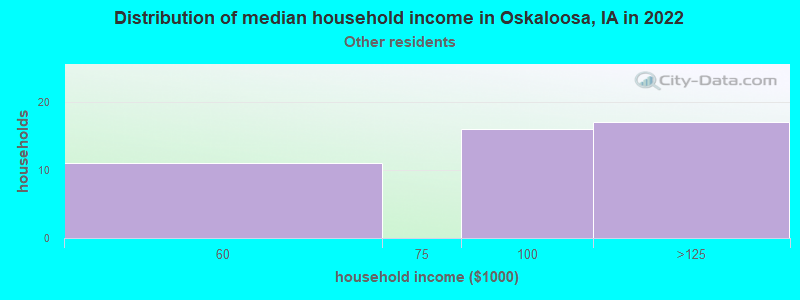
Household income for Some other race householders
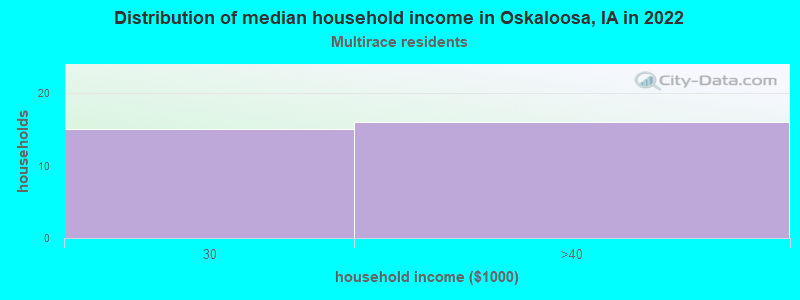
Household income for Two or more races householders
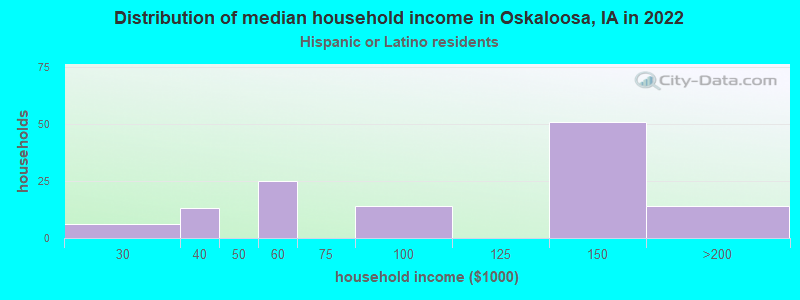
Household income for Hispanic or Latino race householders
Median age by race in Oskaloosa
- 37.4Median age for White residents
- 36.0Males
- 40.4Females
- 47.1Median age for Black or African American residents
- 45.6Males
- 48.7Females
- -660,397,073.5Median age for American Indian / Alaska Native residents
- -654,282,765.1Males
- -670,912,950.5Females
- 43.8Median age for Asian residents
- 43.0Males
- 52.4Females
- -580,729,166.1Median age for Native Hawaiian / Pacific Islander residents
- -776,978,416.5Males
- -504,347,825.6Females
- 21.0Median age for Other race residents
- 44.2Males
- 20.7Females
- 13.9Median age for Two or more races residents
- 8.2Males
- 40.9Females
- 37.5Median age for White alone residents
- 35.8Males
- 40.5Females
- 22.0Median age for Hispanic or Latino residents
- 21.4Males
- 22.8Females
Owner/renter occupied households by race in Oskaloosa
- House owners and renters - White residents
- 2,68061.4%Owner occupied
- 1,68538.6%Renter occupied
- House owners and renters - Black or African American residents
- 101100.0%Renter occupied
- House owners and renters - American Indian / Alaska Native residents
- 7100.0%Renter occupied
- House owners and renters - Asian residents
- 2440.3%Owner occupied
- 3659.7%Renter occupied
- House owners and renters - Other race residents
- 3265.0%Owner occupied
- 1735.0%Renter occupied
- House owners and renters - Two or more races residents
- 38100.0%Renter occupied
- House owners and renters - White alone residents
- 2,67761.5%Owner occupied
- 1,67938.5%Renter occupied
- House owners and renters - Hispanic or Latino residents
- 4846.2%Owner occupied
- 5653.8%Renter occupied
Language usage in Oskaloosa
- English speakers - Total
- 96.8% of residents of Oskaloosa speak English at home.
- 1.3% of residents speak Spanish at home
- 11281.2%Speak English very well
- 2618.8%Speak English less than very well
- 1.7% of residents speak other language at home
- 4322.9%Speak English very well
- 14577.1%Speak English less than very well
- English speakers - Born in the United States
- 97.9% of residents of Oskaloosa speak English at home.
- 2.2% of residents speak Spanish at home
- 5596.5%Speak English very well
- 23.5%Speak English less than very well
- English speakers - Native, born elsewhere
- 95.0% of residents of Oskaloosa speak English at home.
- 10.9% of residents speak Spanish at home
- 13100.0%Speak English very well
- English speakers - Foreign-born
- 40.0% of residents of Oskaloosa speak English at home.
- 9.2% of residents speak Spanish at home
- 1145.8%Speak English very well
- 1354.2%Speak English less than very well
- 46.2% of residents speak other language at home
- 2319.2%Speak English very well
- 9780.8%Speak English less than very well
White (Caucasian) - Speak only English
| Native: | 100.0% (9,778) |
| Foreign-born: | 100.0% (56) |
Black or African American - Speak only English
| Native: | 98.7% (285) |
| Foreign-born: | 70.0% (4) |
Asian - Speak only English
| Native: | 31.4% (13) |
| Foreign-born: | 13.3% (18) |
Asian - Speak another language
| Native: | 67.5% (29) |
| Foreign-born: | 86.1% (118) |
Other race - Speak another language
| Native: | 85.2% (86) |
| Foreign-born: | 100.0% (32) |
White alone - Speak only English
| Native: | 99.5% (9,626) |
| Foreign-born: | 99.1% (80) |
Hispanic or Latino - Speak another language
| Native: | 24.6% (78) |
| Foreign-born: | 100.0% (24) |
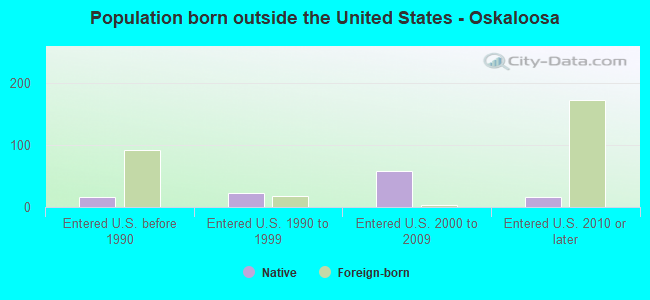
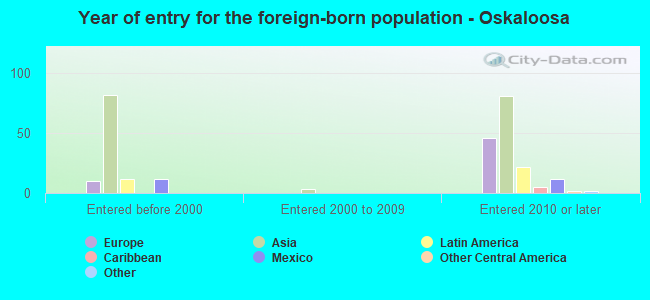
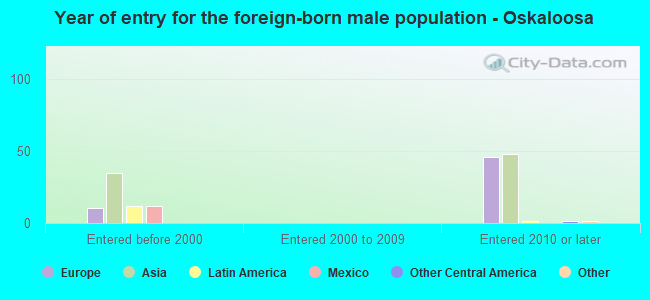
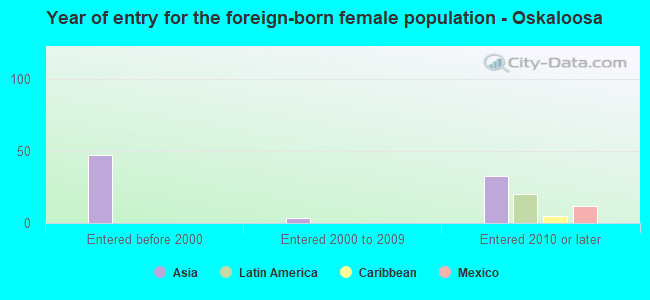
Foreign-born residents in Oskaloosa
263 residents are foreign born (1.5% Asia, 0.5% Europe).
| This city: | 2.3% |
| Iowa: | 5.6% |

Marital status for residents in Oskaloosa
Marital status - White (Caucasian) population 15 years and over
- Males
- 35.8%Never married
- 48.7%Now married
- 1.3%Separated
- 1.8%Widowed
- 12.4%Divorced
- Females
- 27.9%Never married
- 44.1%Now married
- 1.1%Separated
- 13.8%Widowed
- 13.1%Divorced
Women who gave birth in the past 12 months
| Now married: | 70.0% (89) |
| Unmarried: | 30.0% (38) |
Women who did not give birth in the past 12 months
| Now married: | 36.8% (770) |
| Unmarried: | 63.2% (1,322) |
Marital status - Black or African American population 15 years and over
- Males
- 71.3%Never married
- 28.7%Now married
- 0.0%Separated
- 0.0%Widowed
- 0.0%Divorced
- Females
- 14.9%Never married
- 41.6%Now married
- 0.0%Separated
- 0.0%Widowed
- 43.6%Divorced
Women who did not give birth in the past 12 months
| Now married: | 73.7% (41) |
| Unmarried: | 26.3% (15) |
Marital status - American Indian / Alaska Native population 15 years and over
- Males
- 100.0%Never married
- 0.0%Now married
- 0.0%Separated
- 0.0%Widowed
- 0.0%Divorced
- Females
- 0.0%Never married
- 0.0%Now married
- 0.0%Separated
- 0.0%Widowed
- 100.0%Divorced
Marital status - Asian population 15 years and over
- Males
- 42.5%Never married
- 57.5%Now married
- 0.0%Separated
- 0.0%Widowed
- 0.0%Divorced
- Females
- 17.1%Never married
- 82.9%Now married
- 0.0%Separated
- 0.0%Widowed
- 0.0%Divorced
Women who did not give birth in the past 12 months
| Now married: | 65.0% (25) |
| Unmarried: | 35.0% (13) |
Marital status - Other race population 15 years and over
- Males
- 38.2%Never married
- 61.8%Now married
- 0.0%Separated
- 0.0%Widowed
- 0.0%Divorced
- Females
- 84.4%Never married
- 15.6%Now married
- 0.0%Separated
- 0.0%Widowed
- 0.0%Divorced
Women who did not give birth in the past 12 months
| Now married: | 0.0% (0) |
| Unmarried: | 100.0% (70) |
Marital status - Two or more races population 15 years and over
- Males
- 83.3%Never married
- 16.7%Now married
- 0.0%Separated
- 0.0%Widowed
- 0.0%Divorced
- Females
- 11.3%Never married
- 53.5%Now married
- 0.0%Separated
- 0.0%Widowed
- 35.2%Divorced
Women who did not give birth in the past 12 months
| Now married: | 73.3% (49) |
| Unmarried: | 26.7% (18) |
Marital status - White alone, not Hispanic / Latino population 15 years and over
- Males
- 35.7%Never married
- 48.8%Now married
- 1.3%Separated
- 1.8%Widowed
- 12.4%Divorced
- Females
- 26.7%Never married
- 45.4%Now married
- 1.2%Separated
- 14.2%Widowed
- 12.4%Divorced
Women who gave birth in the past 12 months
| Now married: | 70.0% (90) |
| Unmarried: | 30.0% (39) |
Women who did not give birth in the past 12 months
| Now married: | 38.6% (783) |
| Unmarried: | 61.4% (1,247) |
Marital status - Hispanic or Latino population 15 years and over
- Males
- 61.9%Never married
- 38.1%Now married
- 0.0%Separated
- 0.0%Widowed
- 0.0%Divorced
- Females
- 65.1%Never married
- 5.2%Now married
- 0.0%Separated
- 0.0%Widowed
- 29.7%Divorced
Women who did not give birth in the past 12 months
| Now married: | 0.0% (0) |
| Unmarried: | 100.0% (154) |
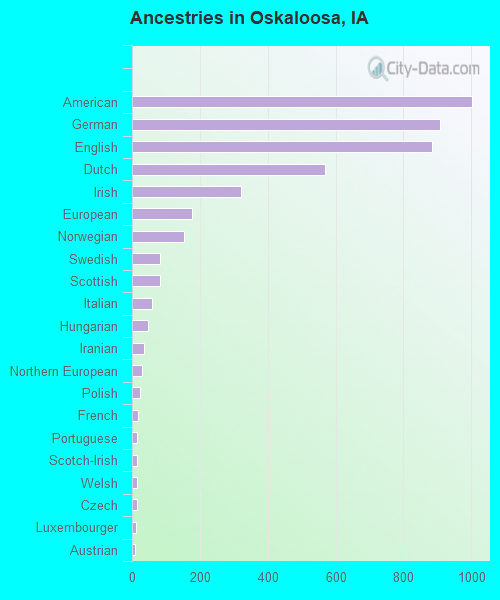
Ancestries in Oskaloosa

- 1,00218.4%American
- 90916.7%German
- 88416.2%English
- 56910.4%Dutch
- 3215.9%Irish
- 1763.2%European
- 1532.8%Norwegian
- 831.5%Swedish
- 821.5%Scottish
- 581.1%Italian
- 460.8%Hungarian
- 350.6%Iranian
- 300.5%Northern European
- 240.4%Polish
- 180.3%French
- 160.3%Portuguese
- 150.3%Scotch-Irish
- 150.3%Welsh
- 140.3%Czech
- 130.2%Luxembourger
- 100.2%Austrian
- 80.1%British West Indian
- 60.1%Scandinavian
- 60.1%Swiss
- 40.07%Canadian
- 10.02%Nigerian
- 10.02%Somali
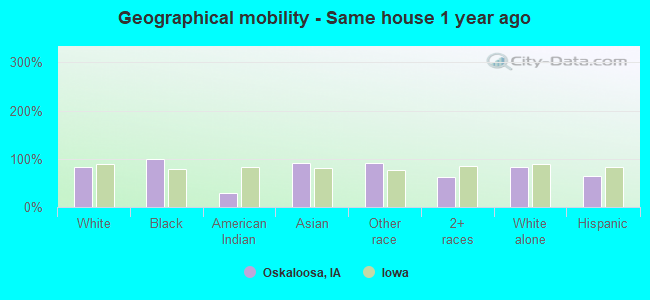
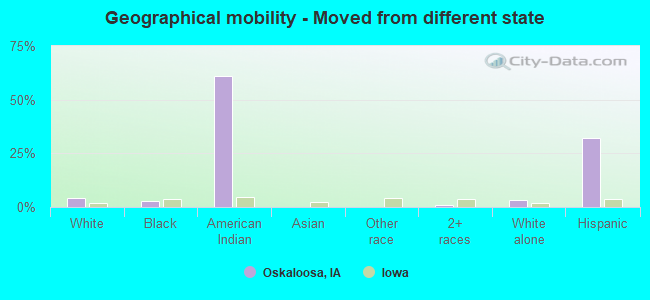
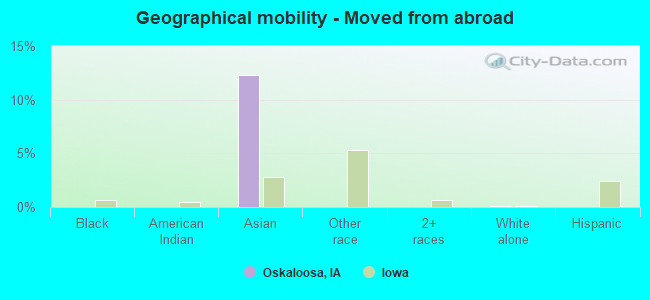
Geographical mobility in Oskaloosa

- Same house 1 year ago
- 8,56183.4%White (Caucasian)
- 29399.0%Black or African American
- 728.3%American Indian / Alaska Native
- 17290.6%Asian
- 12391.5%Other race
- 19861.8%Two or more races
- 8,56683.8%White alone, not Hispanic / Latino
- 24465.2%Hispanic or Latino
-
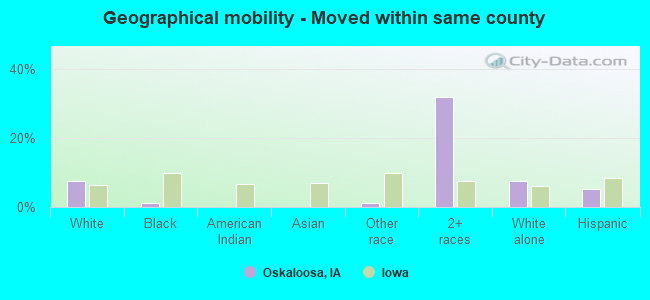
- Moved within same county
- 7617.4%White / Caucasian
- 31.0%Black or African American
- 21.2%Other race
- 10231.8%Two or more races
- 7777.6%White alone, not Hispanic / Latino
- 195.1%Hispanic or Latino
-
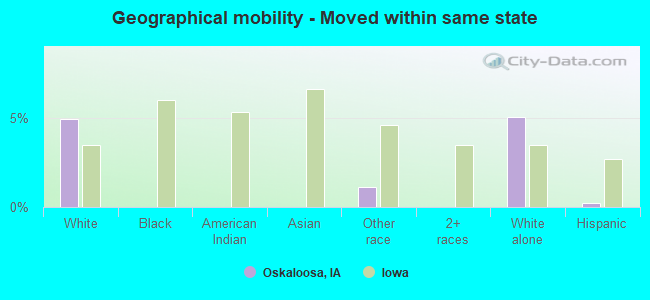
- Moved within same state
- 5034.9%White / Caucasian
- 21.1%Other race
- 5135.0%White alone, not Hispanic / Latino
- 10.2%Hispanic or Latino
-
- Moved from different state
- 4074.0%White / Caucasian
- 82.6%Black or African American
- 1561.1%American Indian / Alaska Native
- 30.9%Two or more races
- 3313.2%White alone, not Hispanic / Latino
- 12032.1%Hispanic or Latino
-
- Moved from abroad
- 70.1%White
- 2312.3%Asian
- 80.1%White alone, not Hispanic / Latino
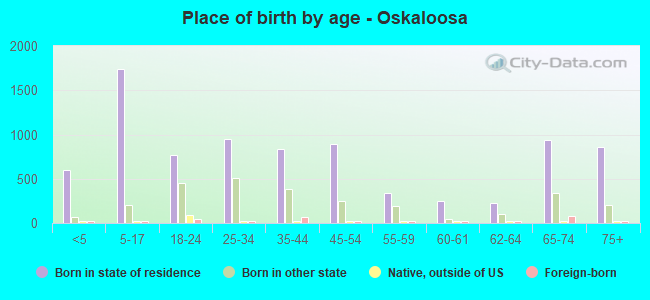
Children Nativity (place of birth) in Oskaloosa
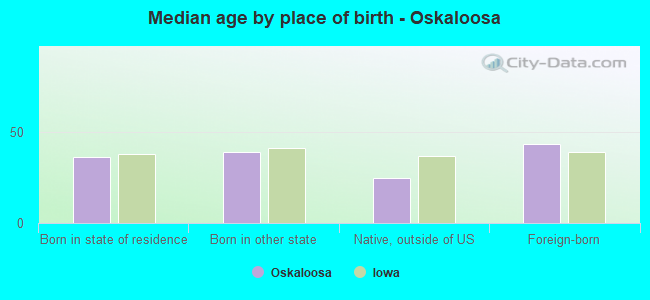
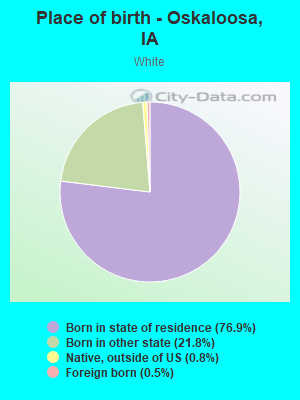
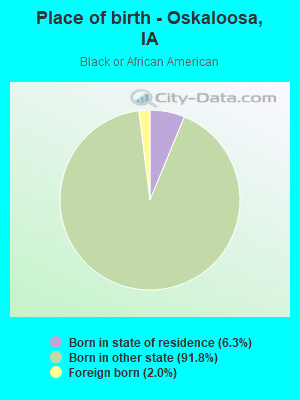
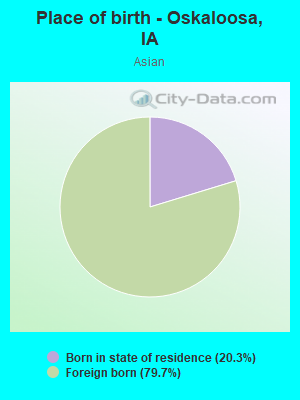
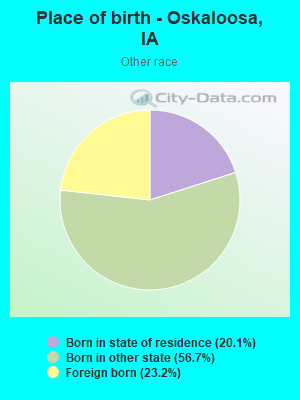
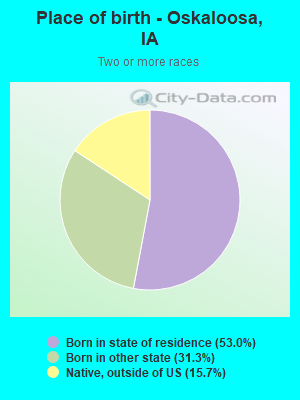
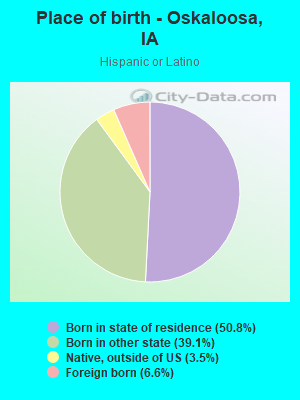
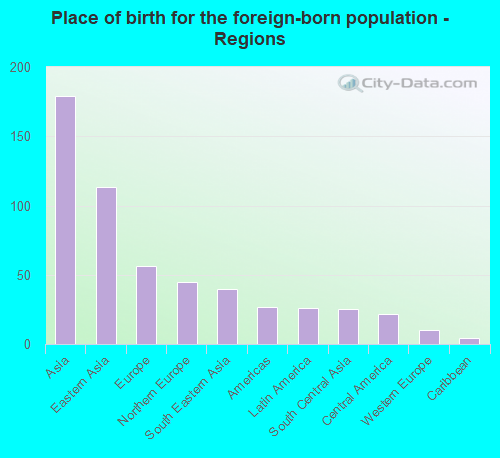
Place of birth for residents in Oskaloosa
![Place of birth for the foreign-born population - Regions]()
- 179Asia
- 113Eastern Asia
- 56Europe
- 45Northern Europe
- 40South Eastern Asia
- 27Americas
- 26Latin America
- 25South Central Asia
- 22Central America
- 10Western Europe
- 4Caribbean
- 1Northern America
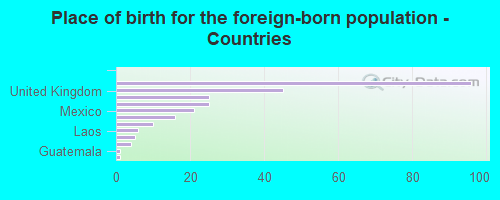
![Place of birth for the foreign-born population - Countries]()
- 96Japan
- 45United Kingdom
- 25Iran
- 25Philippines
- 21Mexico
- 16Korea
- 10Germany
- 6Laos
- 5Indonesia
- 4Burma (Myanmar)
- 1Guatemala
- 1Canada
Zip codes: 52577.