Races in Ottawa, Kansas (KS) Detailed Stats
Data:
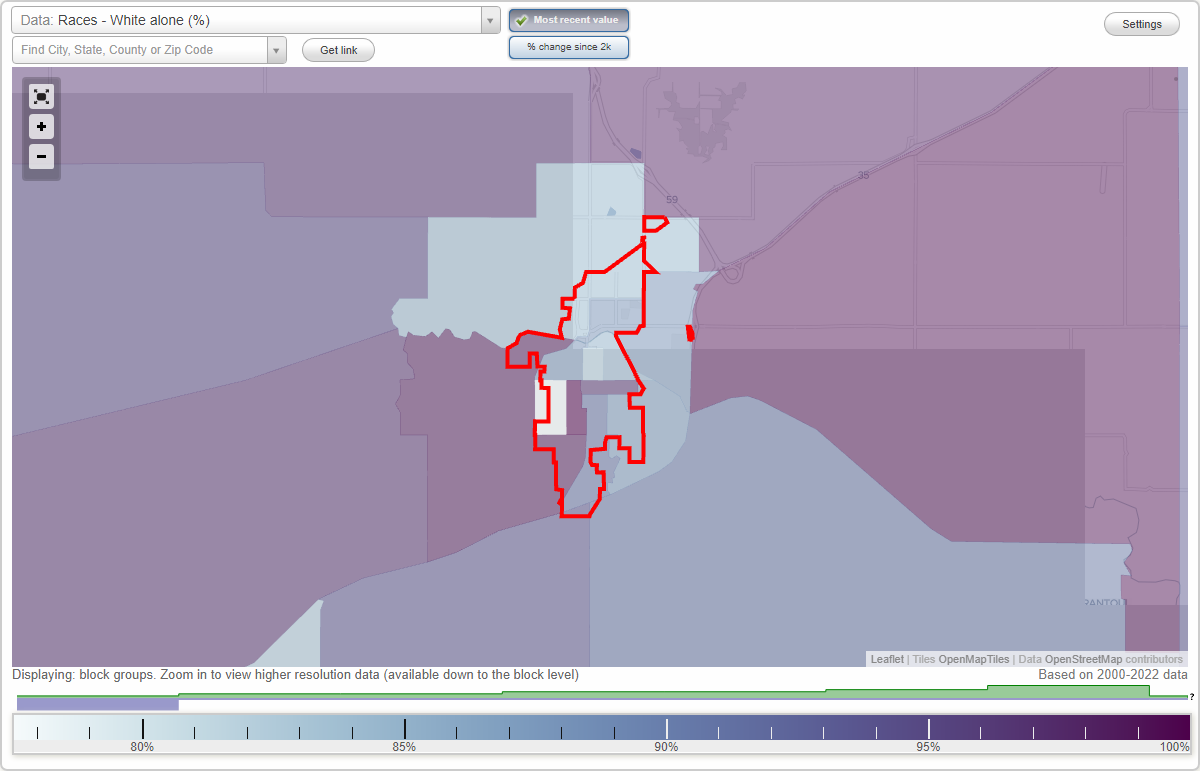
Races - White alone (%)
Races - White alone (% change since 2000)
Races - Black alone (%)
Races - Black alone (% change since 2000)
Races - American Indian alone (%)
Races - American Indian alone (% change since 2000)
Races - Asian alone (%)
Races - Asian alone (% change since 2000)
Races - Hispanic (%)
Races - Hispanic (% change since 2000)
Races - Native Hawaiian and Other Pacific Islander alone (%)
Races - Native Hawaiian and Other Pacific Islander alone (% change since 2000)
Races - Two or more races(%)
Races - Two or more races(% change since 2000)
Races - Other race alone (%)
Races - Other race alone (% change since 2000)
Racial diversity
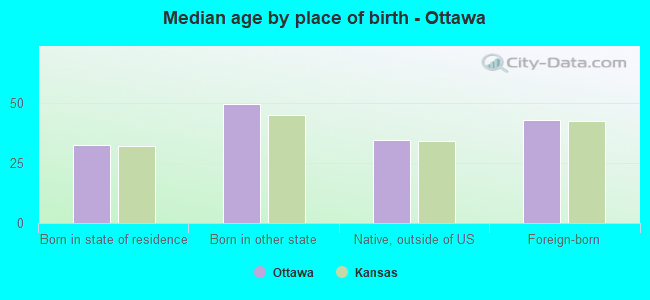
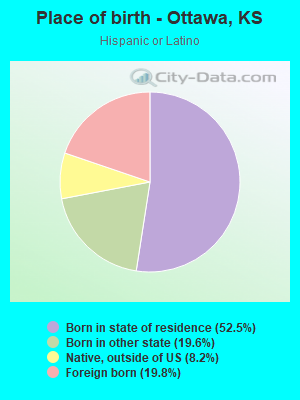
Place of birth - Born in state of residence (%)
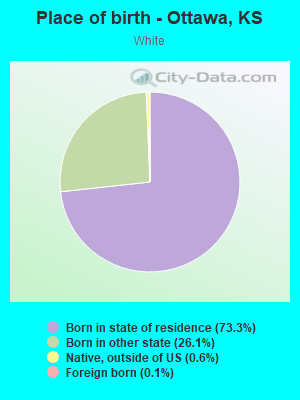
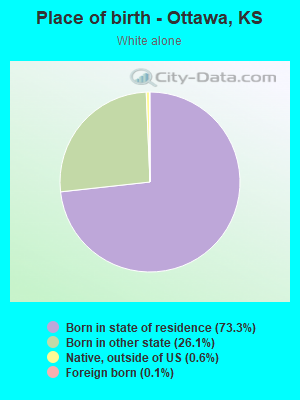
Place of birth - Born in state of residence (%) - White
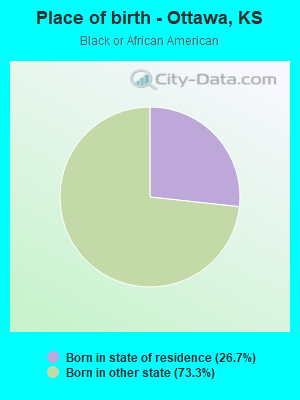
Place of birth - Born in state of residence (%) - Black or African American
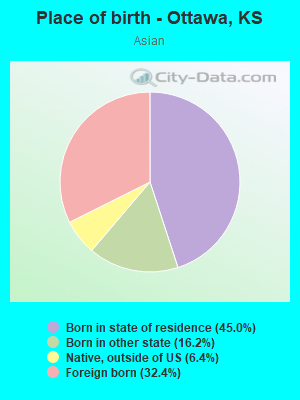
Place of birth - Born in state of residence (%) - Asian
Place of birth - Born in state of residence (%) - Hispanic or Latino
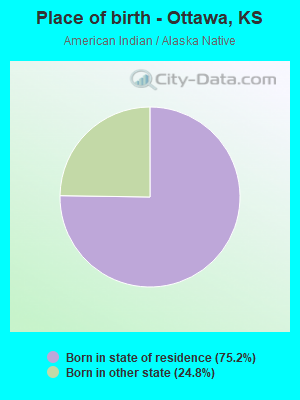
Place of birth - Born in state of residence (%) - American Indian and Alaska Native
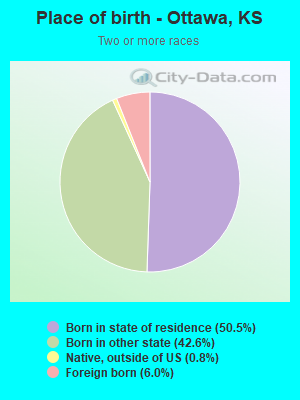
Place of birth - Born in state of residence (%) - Multirace
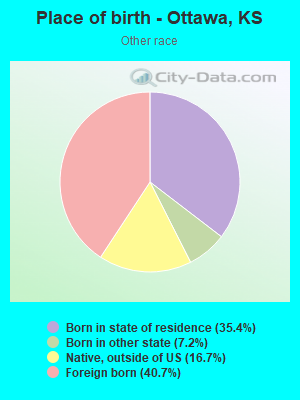
Place of birth - Born in state of residence (%) - Other Race
Place of birth - Born in other state (%)
Place of birth - Born in other state (%) - White
Place of birth - Born in other state (%) - Black or African American
Place of birth - Born in other state (%) - Asian
Place of birth - Born in other state (%) - Hispanic or Latino
Place of birth - Born in other state (%) - American Indian and Alaska Native
Place of birth - Born in other state (%) - Multirace
Place of birth - Born in other state (%) - Other Race
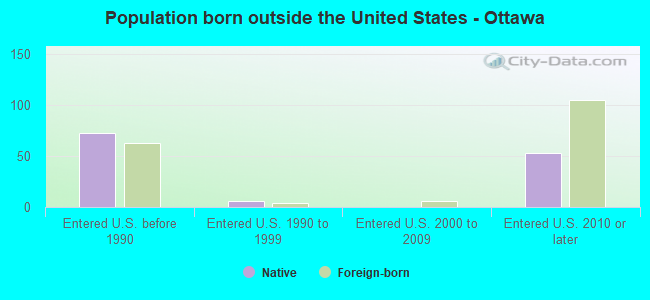
Place of birth - Native, outside of US (%)
Place of birth - Native, outside of US (%) - White
Place of birth - Native, outside of US (%) - Black or African American
Place of birth - Native, outside of US (%) - Asian
Place of birth - Native, outside of US (%) - Hispanic or Latino
Place of birth - Native, outside of US (%) - American Indian and Alaska Native
Place of birth - Native, outside of US (%) - Multirace
Place of birth - Native, outside of US (%) - Other Race
Place of birth - Foreign born (%)
Place of birth - Foreign born (%) - White
Place of birth - Foreign born (%) - Black or African American
Place of birth - Foreign born (%) - Asian
Place of birth - Foreign born (%) - Hispanic or Latino
Place of birth - Foreign born (%) - American Indian and Alaska Native
Place of birth - Foreign born (%) - Multirace
Place of birth - Foreign born (%) - Other Race
Residents speaking English at home (%)
Residents speaking English at home - Born in the United States (%)
Residents speaking English at home - Native, born elsewhere (%)
Residents speaking English at home - Foreign born (%)
Residents speaking Spanish at home (%)
Residents speaking Spanish at home - Born in the United States (%)
Residents speaking Spanish at home - Native, born elsewhere (%)
Residents speaking Spanish at home - Foreign born (%)
Residents speaking other language at home (%)
Residents speaking other language at home - Born in the United States (%)
Residents speaking other language at home - Native, born elsewhere (%)
Residents speaking other language at home - Foreign born (%)
Marital status - Never married (%)
Marital status - Now married (%)
Marital status - Separated (%)
Marital status - Widowed (%)
Marital status - Divorced (%)
Ancestries Reported - Arab (%)
Ancestries Reported - Czech (%)
Ancestries Reported - Danish (%)
Ancestries Reported - Dutch (%)
Ancestries Reported - English (%)
Ancestries Reported - French (%)
Ancestries Reported - French Canadian (%)
Ancestries Reported - German (%)
Ancestries Reported - Greek (%)
Ancestries Reported - Hungarian (%)
Ancestries Reported - Irish (%)
Ancestries Reported - Italian (%)
Ancestries Reported - Lithuanian (%)
Ancestries Reported - Norwegian (%)
Ancestries Reported - Polish (%)
Ancestries Reported - Portuguese (%)
Ancestries Reported - Russian (%)
Ancestries Reported - Scotch-Irish (%)
Ancestries Reported - Scottish (%)
Ancestries Reported - Slovak (%)
Ancestries Reported - Subsaharan African (%)
Ancestries Reported - Swedish (%)
Ancestries Reported - Swiss (%)
Ancestries Reported - Ukrainian (%)
Ancestries Reported - United States (%)
Ancestries Reported - Welsh (%)
Ancestries Reported - West Indian (%)
Ancestries Reported - Other (%)
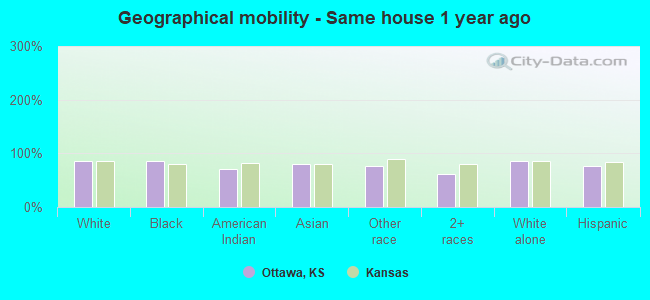
Geographical mobility - Same house 1 year ago (%)
Geographical mobility - Same house 1 year ago (%) - White
Geographical mobility - Same house 1 year ago (%) - Black or African American
Geographical mobility - Same house 1 year ago (%) - Asian
Geographical mobility - Same house 1 year ago (%) - Hispanic or Latino
Geographical mobility - Same house 1 year ago (%) - American Indian and Alaska Native
Geographical mobility - Same house 1 year ago (%) - Multirace
Geographical mobility - Same house 1 year ago (%) - Other Race
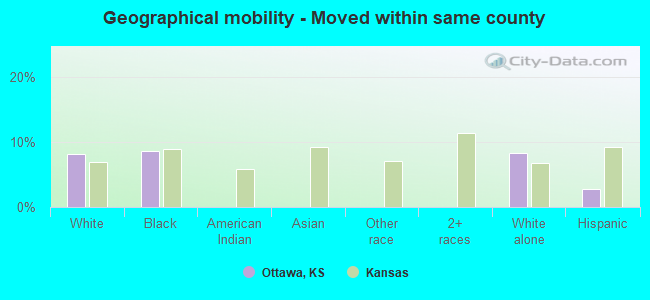
Geographical mobility - Moved within same county (%)
Geographical mobility - Moved within same county (%) - White
Geographical mobility - Moved within same county (%) - Black or African American
Geographical mobility - Moved within same county (%) - Asian
Geographical mobility - Moved within same county (%) - Hispanic or Latino
Geographical mobility - Moved within same county (%) - American Indian and Alaska Native
Geographical mobility - Moved within same county (%) - Multirace
Geographical mobility - Moved within same county (%) - Other Race
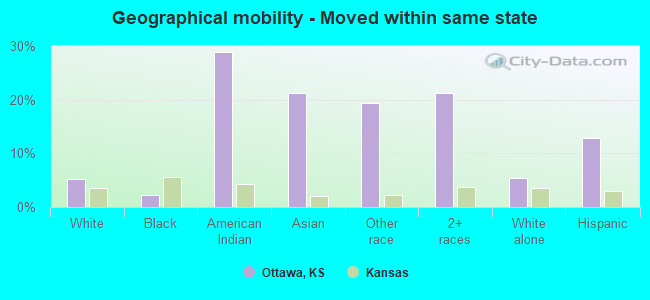
Geographical mobility - Moved from different county within same state (%)
Geographical mobility - Moved from different county within same state (%) - White
Geographical mobility - Moved from different county within same state (%) - Black or African American
Geographical mobility - Moved from different county within same state (%) - Asian
Geographical mobility - Moved from different county within same state (%) - Hispanic or Latino
Geographical mobility - Moved from different county within same state (%) - American Indian and Alaska Native
Geographical mobility - Moved from different county within same state (%) - Multirace
Geographical mobility - Moved from different county within same state (%) - Other Race
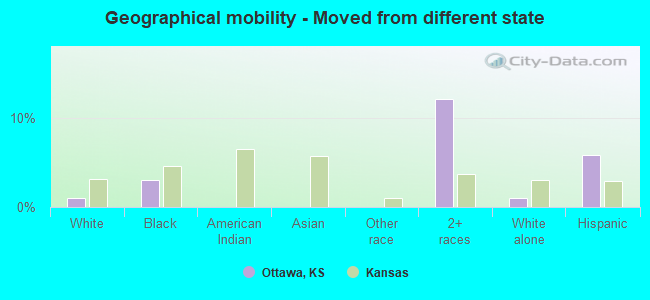
Geographical mobility - Moved from different state (%)
Geographical mobility - Moved from different state (%) - White
Geographical mobility - Moved from different state (%) - Black or African American
Geographical mobility - Moved from different state (%) - Asian
Geographical mobility - Moved from different state (%) - Hispanic or Latino
Geographical mobility - Moved from different state (%) - American Indian and Alaska Native
Geographical mobility - Moved from different state (%) - Multirace
Geographical mobility - Moved from different state (%) - Other Race
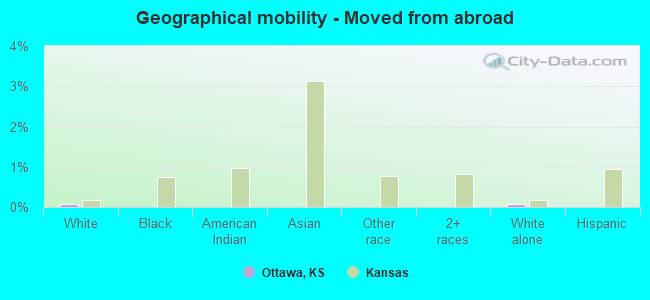
Geographical mobility - Moved from abroad (%)
Geographical mobility - Moved from abroad (%) - White
Geographical mobility - Moved from abroad (%) - Black or African American
Geographical mobility - Moved from abroad (%) - Asian
Geographical mobility - Moved from abroad (%) - Hispanic or Latino
Geographical mobility - Moved from abroad (%) - American Indian and Alaska Native
Geographical mobility - Moved from abroad (%) - Multirace
Geographical mobility - Moved from abroad (%) - Other Race
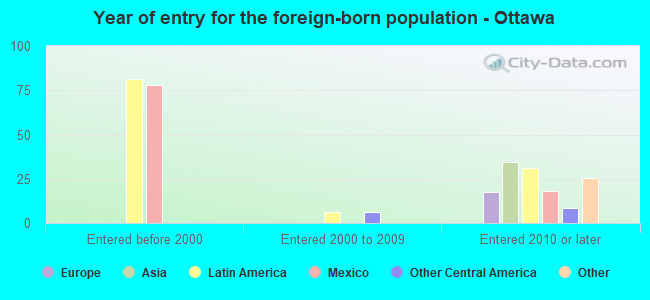
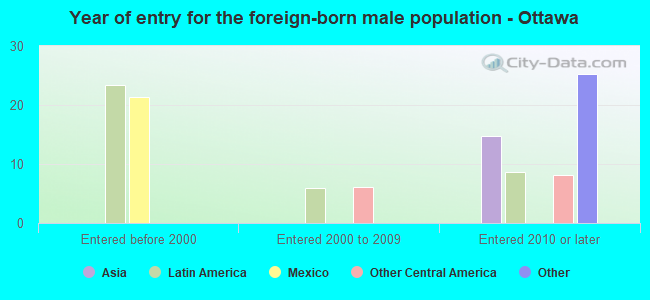
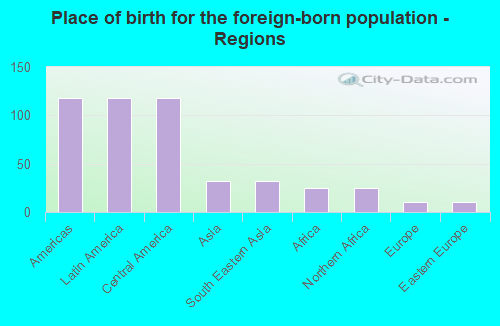
Place of birth for the foreign-born population - Ireland (%)
Place of birth for the foreign-born population - Denmark (%)
Place of birth for the foreign-born population - Norway (%)
Place of birth for the foreign-born population - Sweden (%)
Place of birth for the foreign-born population - United Kingdom (%)
Place of birth for the foreign-born population - England (%)
Place of birth for the foreign-born population - Scotland (%)
Place of birth for the foreign-born population - Other Northern Europe (%)
Place of birth for the foreign-born population - Austria (%)
Place of birth for the foreign-born population - Belgium (%)
Place of birth for the foreign-born population - France (%)
Place of birth for the foreign-born population - Germany (%)
Place of birth for the foreign-born population - Netherlands (%)
Place of birth for the foreign-born population - Switzerland (%)
Place of birth for the foreign-born population - Other Western Europe (%)
Place of birth for the foreign-born population - Greece (%)
Place of birth for the foreign-born population - Italy (%)
Place of birth for the foreign-born population - Portugal (%)
Place of birth for the foreign-born population - Spain (%)
Place of birth for the foreign-born population - Other Southern Europe (%)
Place of birth for the foreign-born population - Albania (%)
Place of birth for the foreign-born population - Belarus (%)
Place of birth for the foreign-born population - Bosnia and Herzegovina (%)
Place of birth for the foreign-born population - Bulgaria (%)
Place of birth for the foreign-born population - Croatia (%)
Place of birth for the foreign-born population - Czechoslovakia (%)
Place of birth for the foreign-born population - Hungary (%)
Place of birth for the foreign-born population - Latvia (%)
Place of birth for the foreign-born population - Lithuania (%)
Place of birth for the foreign-born population - North Macedonia (Macedonia) (%)
Place of birth for the foreign-born population - Moldova (%)
Place of birth for the foreign-born population - Poland (%)
Place of birth for the foreign-born population - Romania (%)
Place of birth for the foreign-born population - Russia (%)
Place of birth for the foreign-born population - Serbia (%)
Place of birth for the foreign-born population - Ukraine (%)
Place of birth for the foreign-born population - Other Eastern Europe (%)
Place of birth for the foreign-born population - China (%)
Place of birth for the foreign-born population - Hong Kong (%)
Place of birth for the foreign-born population - Taiwan (%)
Place of birth for the foreign-born population - Japan (%)
Place of birth for the foreign-born population - Korea (%)
Place of birth for the foreign-born population - Other Eastern Asia (%)
Place of birth for the foreign-born population - Afghanistan (%)
Place of birth for the foreign-born population - Bangladesh (%)
Place of birth for the foreign-born population - India (%)
Place of birth for the foreign-born population - Iran (%)
Place of birth for the foreign-born population - Kazakhstan (%)
Place of birth for the foreign-born population - Nepal (%)
Place of birth for the foreign-born population - Pakistan (%)
Place of birth for the foreign-born population - Sri Lanka (%)
Place of birth for the foreign-born population - Uzbekistan (%)
Place of birth for the foreign-born population - Other South Central Asia (%)
Place of birth for the foreign-born population - Burma (%)
Place of birth for the foreign-born population - Cambodia (%)
Place of birth for the foreign-born population - Indonesia (%)
Place of birth for the foreign-born population - Laos (%)
Place of birth for the foreign-born population - Malaysia (%)
Place of birth for the foreign-born population - Philippines (%)
Place of birth for the foreign-born population - Singapore (%)
Place of birth for the foreign-born population - Thailand (%)
Place of birth for the foreign-born population - Vietnam (%)
Place of birth for the foreign-born population - Other South Eastern Asia (%)
Place of birth for the foreign-born population - Armenia (%)
Place of birth for the foreign-born population - Iraq (%)
Place of birth for the foreign-born population - Israel (%)
Place of birth for the foreign-born population - Jordan (%)
Place of birth for the foreign-born population - Kuwait (%)
Place of birth for the foreign-born population - Lebanon (%)
Place of birth for the foreign-born population - Saudi Arabia (%)
Place of birth for the foreign-born population - Syria (%)
Place of birth for the foreign-born population - Turkey (%)
Place of birth for the foreign-born population - Yemen (%)
Place of birth for the foreign-born population - Other Western Asia (%)
Place of birth for the foreign-born population - Eritrea (%)
Place of birth for the foreign-born population - Ethiopia (%)
Place of birth for the foreign-born population - Kenya (%)
Place of birth for the foreign-born population - Somalia (%)
Place of birth for the foreign-born population - Uganda (%)
Place of birth for the foreign-born population - Zimbabwe (%)
Place of birth for the foreign-born population - Other Eastern Africa (%)
Place of birth for the foreign-born population - Cameroon (%)
Place of birth for the foreign-born population - Congo (%)
Place of birth for the foreign-born population - Democratic Republic of Congo (Zaire) (%)
Place of birth for the foreign-born population - Other Middle Africa (%)
Place of birth for the foreign-born population - Egypt (%)
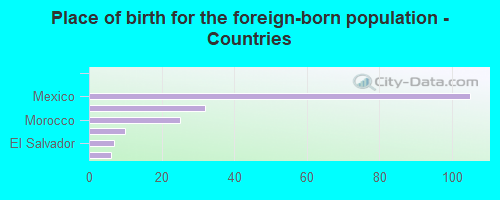
Place of birth for the foreign-born population - Morocco (%)
Place of birth for the foreign-born population - Sudan (%)
Place of birth for the foreign-born population - Other Northern Africa (%)
Place of birth for the foreign-born population - South Africa (%)
Place of birth for the foreign-born population - Other Southern Africa (%)
Place of birth for the foreign-born population - Cabo Verde (%)
Place of birth for the foreign-born population - Ghana (%)
Place of birth for the foreign-born population - Liberia (%)
Place of birth for the foreign-born population - Nigeria (%)
Place of birth for the foreign-born population - Senegal (%)
Place of birth for the foreign-born population - Sierra Leone (%)
Place of birth for the foreign-born population - Other Western Africa (%)
Place of birth for the foreign-born population - Australia (%)
Place of birth for the foreign-born population - New Zealand (%)
Place of birth for the foreign-born population - Fiji (%)
Place of birth for the foreign-born population - Micronesia (%)
Place of birth for the foreign-born population - Bahamas (%)
Place of birth for the foreign-born population - Barbados (%)
Place of birth for the foreign-born population - Cuba (%)
Place of birth for the foreign-born population - Dominica (%)
Place of birth for the foreign-born population - Dominican Republic (%)
Place of birth for the foreign-born population - Grenada (%)
Place of birth for the foreign-born population - Haiti (%)
Place of birth for the foreign-born population - Jamaica (%)
Place of birth for the foreign-born population - St. Vincent and the Grenadines (%)
Place of birth for the foreign-born population - Trinidad and Tobago (%)
Place of birth for the foreign-born population - West Indies (%)
Place of birth for the foreign-born population - Other Caribbean (%)
Place of birth for the foreign-born population - Belize (%)
Place of birth for the foreign-born population - Costa Rica (%)
Place of birth for the foreign-born population - El Salvador (%)
Place of birth for the foreign-born population - Guatemala (%)
Place of birth for the foreign-born population - Honduras (%)
Place of birth for the foreign-born population - Mexico (%)
Place of birth for the foreign-born population - Nicaragua (%)
Place of birth for the foreign-born population - Panama (%)
Place of birth for the foreign-born population - Other Central America (%)
Place of birth for the foreign-born population - Argentina (%)
Place of birth for the foreign-born population - Bolivia (%)
Place of birth for the foreign-born population - Brazil (%)
Place of birth for the foreign-born population - Chile (%)
Place of birth for the foreign-born population - Colombia (%)
Place of birth for the foreign-born population - Ecuador (%)
Place of birth for the foreign-born population - Guyana (%)
Place of birth for the foreign-born population - Peru (%)
Place of birth for the foreign-born population - Uruguay (%)
Place of birth for the foreign-born population - Venezuela (%)
Place of birth for the foreign-born population - Other South America (%)
Place of birth for the foreign-born population - Canada (%)
Place of birth for the foreign-born population - Other Northern America (%)
Place of birth for the foreign-born population - Other (%)
Latest news about races in Ottawa, KS collected exclusively by city-data.com from local newspapers, TV, and radio stations
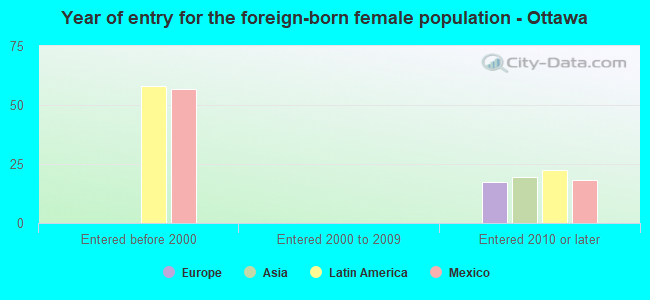
According to 2022 data, the most numerous races in Ottawa, KS are White alone (10,925 residents), Hispanic (604 residents), and Black alone (92 residents). 96.7% of Ottawa residents speak English at home. 1.5% of Ottawa, KS residents are foreign-born , which is 374.9% less than the foreign-born rate of 7.0% across the entire state of Kansas.
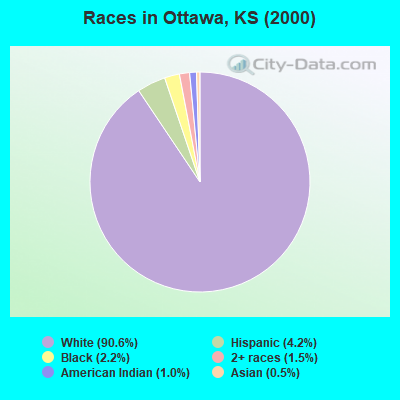
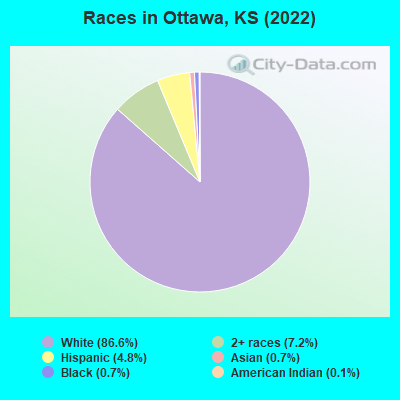
Race distribution in Ottawa
2000 2022
2,233,997 83.1% White alone 188,252 7.0% Hispanic 151,407 5.6% Black alone 46,301 1.7% Asian alone 42,508 1.6% Two or more races 22,322 0.8% American Indian alone 2,477 0.09% Other race alone 1,154 0.04% Native Hawaiian and Other
2,147,943 73.1% White alone 381,746 13.0% Hispanic 147,666 5.0% Black alone 145,362 4.9% Two or more races 85,085 2.9% Asian alone 13,263 0.5% Other race alone 12,065 0.4% American Indian alone 4,020 0.1% Native Hawaiian and Other
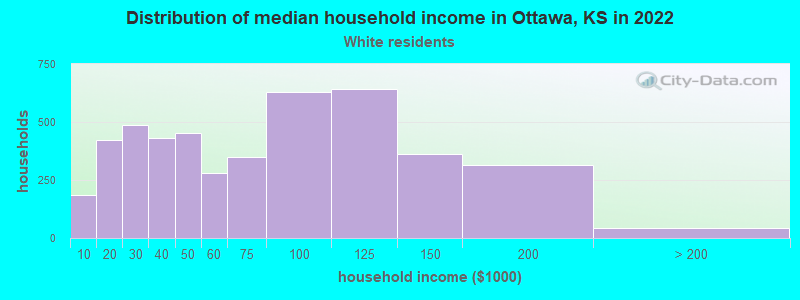
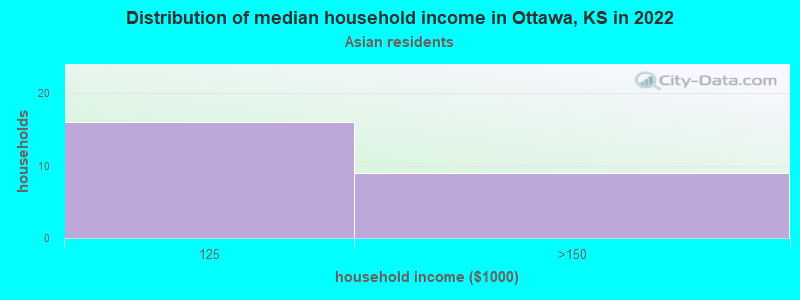
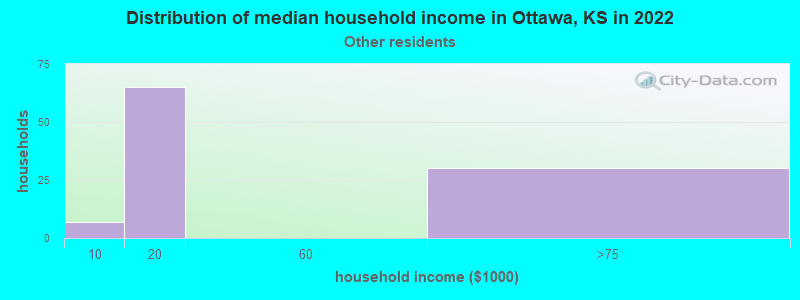
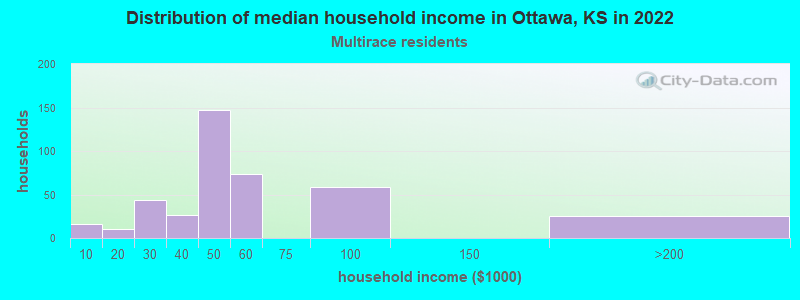
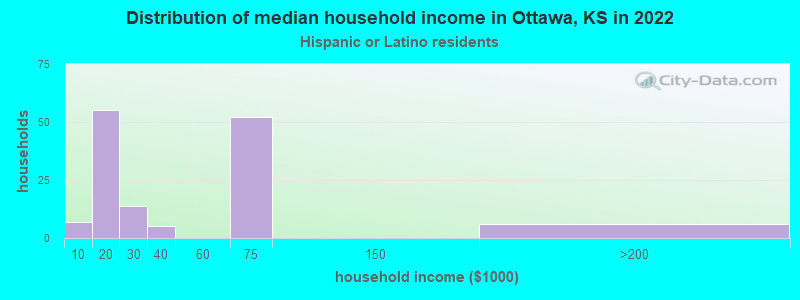
Income and house value in Ottawa Median household income in 2022 $64,379 White non-Hispanic householders$48,932 Two or more races householdersMedian 2022 house value $179,729 White Non-Hispanic householders$148,559 Black or African American householders$132,974 American Indian or Alaska Native householders $345,633 Asian householders$188,527 Some other race householders$94,263 Two or more races householders$174,953 Hispanic or Latino householders
Median age by race in Ottawa
37.1 Median age for White residents36.3 37.5 71.0 Median age for Black or African American residents71.1 70.4 75.5 Median age for American Indian / Alaska Native residents-781,078,107.0 -654,797,229.8 29.7 Median age for Asian residents34.1 28.3 -627,039,626.4 Median age for Native Hawaiian / Pacific Islander residents-669,240,668.6 -641,269,840.6 31.2 Median age for Other race residents31.2 30.2 30.4 Median age for Two or more races residents31.1 20.9 37.2 Median age for White alone residents36.4 38.1 21.0 Median age for Hispanic or Latino residents30.8 17.5
Owner/renter occupied households by race in Ottawa
House owners and renters - White residents 2,947 64.5% Owner occupied1,621 35.5% Renter occupiedHouse owners and renters - Black or African American residents 31 72.2% Owner occupied12 27.8% Renter occupiedHouse owners and renters - American Indian / Alaska Native residents 9 100.0% Renter occupiedHouse owners and renters - Asian residents 26 100.0% Renter occupiedHouse owners and renters - Other race residents 41 42.4% Owner occupied55 57.6% Renter occupiedHouse owners and renters - Two or more races residents 322 74.4% Owner occupied111 25.6% Renter occupiedHouse owners and renters - White alone residents 2,985 64.6% Owner occupied1,638 35.4% Renter occupiedHouse owners and renters - Hispanic or Latino residents 46 34.6% Owner occupied87 65.4% Renter occupied
Language usage in Ottawa
English speakers - Total 96.7% of residents of Ottawa speak English at home.
2.6% of residents speak Spanish at home 91 28.8% Speak English very well225 71.2% Speak English less than very well0.8% of residents speak other language at home 86 85.1% Speak English very well15 14.9% Speak English less than very well
English speakers - Born in the United States 98.1% of residents of Ottawa speak English at home.
1.3% of residents speak Spanish at home 28 62.2% Speak English very well17 37.8% Speak English less than very well0.4% of residents speak other language at home 15 100.0% Speak English very well
English speakers - Native, born elsewhere 60.3% of residents of Ottawa speak English at home.
43.5% of residents speak Spanish at home 5 8.8% Speak English very well52 91.2% Speak English less than very well
English speakers - Foreign-born 8.7% of residents of Ottawa speak English at home.
60.1% of residents speak Spanish at home 21 19.1% Speak English very well89 80.9% Speak English less than very well30.1% of residents speak other language at home 39 70.9% Speak English very well16 29.1% Speak English less than very well
White (Caucasian) - Speak only English Native:
100.0% (10,511)Foreign-born:
85.9% (8)
White (Caucasian) - Speak another language Native:
0.4% (39)Foreign-born:
36.0% (4)
Asian - Speak another language Native:
22.5% (15)Foreign-born:
100.0% (30)
Other race - Speak another language Native:
80.8% (149)Foreign-born:
96.6% (113)
Two or more races - Speak only English Native:
89.2% (806)Foreign-born:
15.1% (9)
Two or more races - Speak another language Native:
8.1% (74)Foreign-born:
83.8% (53)
White alone - Speak only English Native:
99.9% (10,404)Foreign-born:
92.6% (9)
Hispanic or Latino - Speak only English Native:
63.0% (306)Foreign-born:
6.5% (8)
Hispanic or Latino - Speak another language Native:
37.1% (180)Foreign-born:
93.3% (112)
Foreign-born residents in Ottawa 186 residents are foreign born
This city:
1.5%Kansas:
7.1%
Marital status for residents in Ottawa Marital status - White (Caucasian) population 15 years and over
Males 32.5% Never married53.5% Now married0.1% Separated2.1% Widowed11.8% DivorcedFemales 28.1% Never married48.6% Now married0.1% Separated10.3% Widowed12.9% DivorcedWomen who gave birth in the past 12 months Now married:
61.8% (102)Unmarried:
38.2% (63)
Women who did not give birth in the past 12 months Now married:
47.8% (1,140)Unmarried:
52.2% (1,247)
Marital status - Black or African American population 15 years and over
Males 43.6% Never married56.4% Now married0.0% Separated0.0% Widowed0.0% DivorcedFemales 26.7% Never married73.3% Now married0.0% Separated0.0% Widowed0.0% DivorcedWomen who did not give birth in the past 12 months Now married:
44.8% (13)Unmarried:
55.2% (16)
Marital status - American Indian / Alaska Native population 15 years and over
Males 55.6% Never married0.0% Now married0.0% Separated0.0% Widowed44.4% DivorcedFemales 0.0% Never married0.0% Now married0.0% Separated0.0% Widowed100.0% DivorcedMarital status - Asian population 15 years and over
Males 34.8% Never married65.2% Now married0.0% Separated0.0% Widowed0.0% DivorcedFemales 35.4% Never married35.4% Now married0.0% Separated0.0% Widowed29.2% DivorcedWomen who did not give birth in the past 12 months Now married:
35.4% (17)Unmarried:
64.6% (31)
Marital status - Other race population 15 years and over
Males 10.1% Never married89.9% Now married0.0% Separated0.0% Widowed0.0% DivorcedFemales 38.2% Never married57.3% Now married0.0% Separated4.5% Widowed0.0% DivorcedWomen who did not give birth in the past 12 months Now married:
55.2% (93)Unmarried:
44.8% (76)
Marital status - Two or more races population 15 years and over
Males 46.6% Never married49.2% Now married0.0% Separated0.0% Widowed4.1% DivorcedFemales 51.6% Never married25.3% Now married0.0% Separated11.0% Widowed12.1% DivorcedWomen who did not give birth in the past 12 months Now married:
27.6% (56)Unmarried:
72.4% (145)
Marital status - White alone, not Hispanic / Latino population 15 years and over
Males 32.1% Never married53.9% Now married0.1% Separated2.0% Widowed11.9% DivorcedFemales 27.8% Never married49.0% Now married0.1% Separated10.5% Widowed12.6% DivorcedWomen who gave birth in the past 12 months Now married:
61.8% (105)Unmarried:
38.2% (65)
Women who did not give birth in the past 12 months Now married:
48.0% (1,158)Unmarried:
52.0% (1,253)
Marital status - Hispanic or Latino population 15 years and over
Males 41.5% Never married50.0% Now married0.0% Separated4.2% Widowed4.2% DivorcedFemales 44.7% Never married40.8% Now married0.0% Separated2.5% Widowed12.1% DivorcedWomen who did not give birth in the past 12 months Now married:
43.0% (100)Unmarried:
57.0% (133)
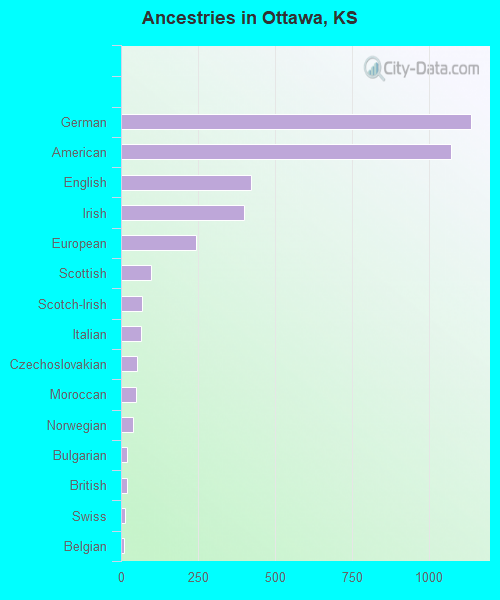
Ancestries in Ottawa
1,139 21.2% German1,074 20.0% American422 7.9% English400 7.4% Irish245 4.6% European98 1.8% Scottish67 1.2% Scotch-Irish64 1.2% Italian52 1.0% Czechoslovakian49 0.9% Moroccan39 0.7% Norwegian20 0.4% Bulgarian18 0.3% British14 0.3% Swiss11 0.2% Belgian10 0.2% Pennsylvania German10 0.2% Scandinavian9 0.2% Russian8 0.1% French Canadian8 0.1% German Russian8 0.1% Welsh7 0.1% Czech5 0.09% Polish
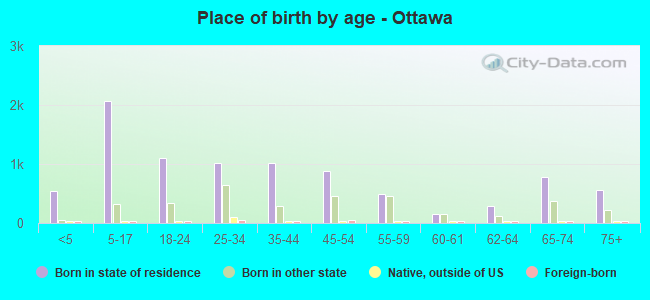
Children Nativity (place of birth) in Ottawa
Children under 6 years - Living with two parents Both parents native 433 100.0% NativeBoth parents foreign-born 12 100.0% NativeOne native, one foreign-born parent 7 100.0% NativeChildren under 6 years - Living with one parent Native parent 365 100.0% Native
Children 6 to 17 years - Living with two parents Both parents native 1,372 100.0% NativeBoth parents foreign-born 13 100.0% NativeOne native, one foreign-born parent 65 100.0% NativeChildren 6 to 17 years - Living with one parent Native parent 535 100.0% Native
Grandparents responsible for own grandchildren in Ottawa
Grandparents (30 to 59 years) White / Caucasian 13 23.2% Responsible for grandchildren43 76.8% Not responsible for grandchildrenOther race 66 100.0% Responsible for grandchildrenWhite alone, not Hispanic / Latino 14 22.8% Responsible for grandchildren46 77.2% Not responsible for grandchildrenHispanic or Latino 40 100.0% Responsible for grandchildren
Grandparents (60 years and over) White / Caucasian 19 100.0% Responsible for grandchildrenWhite alone, not Hispanic / Latino 20 100.0% Responsible for grandchildrenHispanic or Latino 9 100.0% Not responsible for grandchildren