Races in Palm Springs, Florida (FL) Detailed Stats
Data:
Races - White alone (%)
Races - White alone (% change since 2000)
Races - Black alone (%)
Races - Black alone (% change since 2000)
Races - American Indian alone (%)
Races - American Indian alone (% change since 2000)
Races - Asian alone (%)
Races - Asian alone (% change since 2000)
Races - Hispanic (%)
Races - Hispanic (% change since 2000)
Races - Native Hawaiian and Other Pacific Islander alone (%)
Races - Native Hawaiian and Other Pacific Islander alone (% change since 2000)
Races - Two or more races(%)
Races - Two or more races(% change since 2000)
Races - Other race alone (%)
Races - Other race alone (% change since 2000)
Racial diversity
Place of birth - Born in state of residence (%)
Place of birth - Born in state of residence (%) - White
Place of birth - Born in state of residence (%) - Black or African American
Place of birth - Born in state of residence (%) - Asian
Place of birth - Born in state of residence (%) - Hispanic or Latino
Place of birth - Born in state of residence (%) - American Indian and Alaska Native
Place of birth - Born in state of residence (%) - Multirace
Place of birth - Born in state of residence (%) - Other Race
Place of birth - Born in other state (%)
Place of birth - Born in other state (%) - White
Place of birth - Born in other state (%) - Black or African American
Place of birth - Born in other state (%) - Asian
Place of birth - Born in other state (%) - Hispanic or Latino
Place of birth - Born in other state (%) - American Indian and Alaska Native
Place of birth - Born in other state (%) - Multirace
Place of birth - Born in other state (%) - Other Race
Place of birth - Native, outside of US (%)
Place of birth - Native, outside of US (%) - White
Place of birth - Native, outside of US (%) - Black or African American
Place of birth - Native, outside of US (%) - Asian
Place of birth - Native, outside of US (%) - Hispanic or Latino
Place of birth - Native, outside of US (%) - American Indian and Alaska Native
Place of birth - Native, outside of US (%) - Multirace
Place of birth - Native, outside of US (%) - Other Race
Place of birth - Foreign born (%)
Place of birth - Foreign born (%) - White
Place of birth - Foreign born (%) - Black or African American
Place of birth - Foreign born (%) - Asian
Place of birth - Foreign born (%) - Hispanic or Latino
Place of birth - Foreign born (%) - American Indian and Alaska Native
Place of birth - Foreign born (%) - Multirace
Place of birth - Foreign born (%) - Other Race
Residents speaking English at home (%)
Residents speaking English at home - Born in the United States (%)
Residents speaking English at home - Native, born elsewhere (%)
Residents speaking English at home - Foreign born (%)
Residents speaking Spanish at home (%)
Residents speaking Spanish at home - Born in the United States (%)
Residents speaking Spanish at home - Native, born elsewhere (%)
Residents speaking Spanish at home - Foreign born (%)
Residents speaking other language at home (%)
Residents speaking other language at home - Born in the United States (%)
Residents speaking other language at home - Native, born elsewhere (%)
Residents speaking other language at home - Foreign born (%)
Marital status - Never married (%)
Marital status - Now married (%)
Marital status - Separated (%)
Marital status - Widowed (%)
Marital status - Divorced (%)
Ancestries Reported - Arab (%)
Ancestries Reported - Czech (%)
Ancestries Reported - Danish (%)
Ancestries Reported - Dutch (%)
Ancestries Reported - English (%)
Ancestries Reported - French (%)
Ancestries Reported - French Canadian (%)
Ancestries Reported - German (%)
Ancestries Reported - Greek (%)
Ancestries Reported - Hungarian (%)
Ancestries Reported - Irish (%)
Ancestries Reported - Italian (%)
Ancestries Reported - Lithuanian (%)
Ancestries Reported - Norwegian (%)
Ancestries Reported - Polish (%)
Ancestries Reported - Portuguese (%)
Ancestries Reported - Russian (%)
Ancestries Reported - Scotch-Irish (%)
Ancestries Reported - Scottish (%)
Ancestries Reported - Slovak (%)
Ancestries Reported - Subsaharan African (%)
Ancestries Reported - Swedish (%)
Ancestries Reported - Swiss (%)
Ancestries Reported - Ukrainian (%)
Ancestries Reported - United States (%)
Ancestries Reported - Welsh (%)
Ancestries Reported - West Indian (%)
Ancestries Reported - Other (%)
Geographical mobility - Same house 1 year ago (%)
Geographical mobility - Same house 1 year ago (%) - White
Geographical mobility - Same house 1 year ago (%) - Black or African American
Geographical mobility - Same house 1 year ago (%) - Asian
Geographical mobility - Same house 1 year ago (%) - Hispanic or Latino
Geographical mobility - Same house 1 year ago (%) - American Indian and Alaska Native
Geographical mobility - Same house 1 year ago (%) - Multirace
Geographical mobility - Same house 1 year ago (%) - Other Race
Geographical mobility - Moved within same county (%)
Geographical mobility - Moved within same county (%) - White
Geographical mobility - Moved within same county (%) - Black or African American
Geographical mobility - Moved within same county (%) - Asian
Geographical mobility - Moved within same county (%) - Hispanic or Latino
Geographical mobility - Moved within same county (%) - American Indian and Alaska Native
Geographical mobility - Moved within same county (%) - Multirace
Geographical mobility - Moved within same county (%) - Other Race
Geographical mobility - Moved from different county within same state (%)
Geographical mobility - Moved from different county within same state (%) - White
Geographical mobility - Moved from different county within same state (%) - Black or African American
Geographical mobility - Moved from different county within same state (%) - Asian
Geographical mobility - Moved from different county within same state (%) - Hispanic or Latino
Geographical mobility - Moved from different county within same state (%) - American Indian and Alaska Native
Geographical mobility - Moved from different county within same state (%) - Multirace
Geographical mobility - Moved from different county within same state (%) - Other Race
Geographical mobility - Moved from different state (%)
Geographical mobility - Moved from different state (%) - White
Geographical mobility - Moved from different state (%) - Black or African American
Geographical mobility - Moved from different state (%) - Asian
Geographical mobility - Moved from different state (%) - Hispanic or Latino
Geographical mobility - Moved from different state (%) - American Indian and Alaska Native
Geographical mobility - Moved from different state (%) - Multirace
Geographical mobility - Moved from different state (%) - Other Race
Geographical mobility - Moved from abroad (%)
Geographical mobility - Moved from abroad (%) - White
Geographical mobility - Moved from abroad (%) - Black or African American
Geographical mobility - Moved from abroad (%) - Asian
Geographical mobility - Moved from abroad (%) - Hispanic or Latino
Geographical mobility - Moved from abroad (%) - American Indian and Alaska Native
Geographical mobility - Moved from abroad (%) - Multirace
Geographical mobility - Moved from abroad (%) - Other Race
Place of birth for the foreign-born population - Ireland (%)
Place of birth for the foreign-born population - Denmark (%)
Place of birth for the foreign-born population - Norway (%)
Place of birth for the foreign-born population - Sweden (%)
Place of birth for the foreign-born population - United Kingdom (%)
Place of birth for the foreign-born population - England (%)
Place of birth for the foreign-born population - Scotland (%)
Place of birth for the foreign-born population - Other Northern Europe (%)
Place of birth for the foreign-born population - Austria (%)
Place of birth for the foreign-born population - Belgium (%)
Place of birth for the foreign-born population - France (%)
Place of birth for the foreign-born population - Germany (%)
Place of birth for the foreign-born population - Netherlands (%)
Place of birth for the foreign-born population - Switzerland (%)
Place of birth for the foreign-born population - Other Western Europe (%)
Place of birth for the foreign-born population - Greece (%)
Place of birth for the foreign-born population - Italy (%)
Place of birth for the foreign-born population - Portugal (%)
Place of birth for the foreign-born population - Spain (%)
Place of birth for the foreign-born population - Other Southern Europe (%)
Place of birth for the foreign-born population - Albania (%)
Place of birth for the foreign-born population - Belarus (%)
Place of birth for the foreign-born population - Bosnia and Herzegovina (%)
Place of birth for the foreign-born population - Bulgaria (%)
Place of birth for the foreign-born population - Croatia (%)
Place of birth for the foreign-born population - Czechoslovakia (%)
Place of birth for the foreign-born population - Hungary (%)
Place of birth for the foreign-born population - Latvia (%)
Place of birth for the foreign-born population - Lithuania (%)
Place of birth for the foreign-born population - North Macedonia (Macedonia) (%)
Place of birth for the foreign-born population - Moldova (%)
Place of birth for the foreign-born population - Poland (%)
Place of birth for the foreign-born population - Romania (%)
Place of birth for the foreign-born population - Russia (%)
Place of birth for the foreign-born population - Serbia (%)
Place of birth for the foreign-born population - Ukraine (%)
Place of birth for the foreign-born population - Other Eastern Europe (%)
Place of birth for the foreign-born population - China (%)
Place of birth for the foreign-born population - Hong Kong (%)
Place of birth for the foreign-born population - Taiwan (%)
Place of birth for the foreign-born population - Japan (%)
Place of birth for the foreign-born population - Korea (%)
Place of birth for the foreign-born population - Other Eastern Asia (%)
Place of birth for the foreign-born population - Afghanistan (%)
Place of birth for the foreign-born population - Bangladesh (%)
Place of birth for the foreign-born population - India (%)
Place of birth for the foreign-born population - Iran (%)
Place of birth for the foreign-born population - Kazakhstan (%)
Place of birth for the foreign-born population - Nepal (%)
Place of birth for the foreign-born population - Pakistan (%)
Place of birth for the foreign-born population - Sri Lanka (%)
Place of birth for the foreign-born population - Uzbekistan (%)
Place of birth for the foreign-born population - Other South Central Asia (%)
Place of birth for the foreign-born population - Burma (%)
Place of birth for the foreign-born population - Cambodia (%)
Place of birth for the foreign-born population - Indonesia (%)
Place of birth for the foreign-born population - Laos (%)
Place of birth for the foreign-born population - Malaysia (%)
Place of birth for the foreign-born population - Philippines (%)
Place of birth for the foreign-born population - Singapore (%)
Place of birth for the foreign-born population - Thailand (%)
Place of birth for the foreign-born population - Vietnam (%)
Place of birth for the foreign-born population - Other South Eastern Asia (%)
Place of birth for the foreign-born population - Armenia (%)
Place of birth for the foreign-born population - Iraq (%)
Place of birth for the foreign-born population - Israel (%)
Place of birth for the foreign-born population - Jordan (%)
Place of birth for the foreign-born population - Kuwait (%)
Place of birth for the foreign-born population - Lebanon (%)
Place of birth for the foreign-born population - Saudi Arabia (%)
Place of birth for the foreign-born population - Syria (%)
Place of birth for the foreign-born population - Turkey (%)
Place of birth for the foreign-born population - Yemen (%)
Place of birth for the foreign-born population - Other Western Asia (%)
Place of birth for the foreign-born population - Eritrea (%)
Place of birth for the foreign-born population - Ethiopia (%)
Place of birth for the foreign-born population - Kenya (%)
Place of birth for the foreign-born population - Somalia (%)
Place of birth for the foreign-born population - Uganda (%)
Place of birth for the foreign-born population - Zimbabwe (%)
Place of birth for the foreign-born population - Other Eastern Africa (%)
Place of birth for the foreign-born population - Cameroon (%)
Place of birth for the foreign-born population - Congo (%)
Place of birth for the foreign-born population - Democratic Republic of Congo (Zaire) (%)
Place of birth for the foreign-born population - Other Middle Africa (%)
Place of birth for the foreign-born population - Egypt (%)
Place of birth for the foreign-born population - Morocco (%)
Place of birth for the foreign-born population - Sudan (%)
Place of birth for the foreign-born population - Other Northern Africa (%)
Place of birth for the foreign-born population - South Africa (%)
Place of birth for the foreign-born population - Other Southern Africa (%)
Place of birth for the foreign-born population - Cabo Verde (%)
Place of birth for the foreign-born population - Ghana (%)
Place of birth for the foreign-born population - Liberia (%)
Place of birth for the foreign-born population - Nigeria (%)
Place of birth for the foreign-born population - Senegal (%)
Place of birth for the foreign-born population - Sierra Leone (%)
Place of birth for the foreign-born population - Other Western Africa (%)
Place of birth for the foreign-born population - Australia (%)
Place of birth for the foreign-born population - New Zealand (%)
Place of birth for the foreign-born population - Fiji (%)
Place of birth for the foreign-born population - Micronesia (%)
Place of birth for the foreign-born population - Bahamas (%)
Place of birth for the foreign-born population - Barbados (%)
Place of birth for the foreign-born population - Cuba (%)
Place of birth for the foreign-born population - Dominica (%)
Place of birth for the foreign-born population - Dominican Republic (%)
Place of birth for the foreign-born population - Grenada (%)
Place of birth for the foreign-born population - Haiti (%)
Place of birth for the foreign-born population - Jamaica (%)
Place of birth for the foreign-born population - St. Vincent and the Grenadines (%)
Place of birth for the foreign-born population - Trinidad and Tobago (%)
Place of birth for the foreign-born population - West Indies (%)
Place of birth for the foreign-born population - Other Caribbean (%)
Place of birth for the foreign-born population - Belize (%)
Place of birth for the foreign-born population - Costa Rica (%)
Place of birth for the foreign-born population - El Salvador (%)
Place of birth for the foreign-born population - Guatemala (%)
Place of birth for the foreign-born population - Honduras (%)
Place of birth for the foreign-born population - Mexico (%)
Place of birth for the foreign-born population - Nicaragua (%)
Place of birth for the foreign-born population - Panama (%)
Place of birth for the foreign-born population - Other Central America (%)
Place of birth for the foreign-born population - Argentina (%)
Place of birth for the foreign-born population - Bolivia (%)
Place of birth for the foreign-born population - Brazil (%)
Place of birth for the foreign-born population - Chile (%)
Place of birth for the foreign-born population - Colombia (%)
Place of birth for the foreign-born population - Ecuador (%)
Place of birth for the foreign-born population - Guyana (%)
Place of birth for the foreign-born population - Peru (%)
Place of birth for the foreign-born population - Uruguay (%)
Place of birth for the foreign-born population - Venezuela (%)
Place of birth for the foreign-born population - Other South America (%)
Place of birth for the foreign-born population - Canada (%)
Place of birth for the foreign-born population - Other Northern America (%)
Place of birth for the foreign-born population - Other (%)
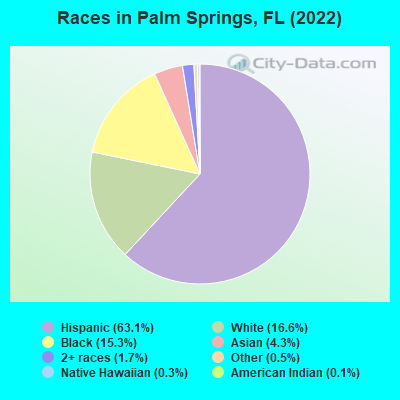
According to 2022 data, the most numerous races in Palm Springs, FL are White alone (4,500 residents), Hispanic (17,121 residents), and Black alone (4,141 residents). 28.7% of Palm Springs residents speak English at home. 51.2% of Palm Springs, FL residents are foreign-born (45.9% born in Latin America), which is 58.9% greater than the foreign-born rate of 21.0% across the entire state of Florida.
Race distribution in Palm Springs
2000 2022
10,458,509 65.4% White alone 2,682,715 16.8% Hispanic 2,264,268 14.2% Black alone 261,693 1.6% Asian alone 236,954 1.5% Two or more races 42,358 0.3% American Indian alone 28,994 0.2% Other race alone 6,887 0.04% Native Hawaiian and Other
11,309,403 50.8% White alone 6,025,039 27.1% Hispanic 3,241,015 14.6% Black alone 861,630 3.9% Two or more races 623,692 2.8% Asian alone 152,054 0.7% Other race alone 22,504 0.1% American Indian alone 9,486 0.04% Native Hawaiian and Other
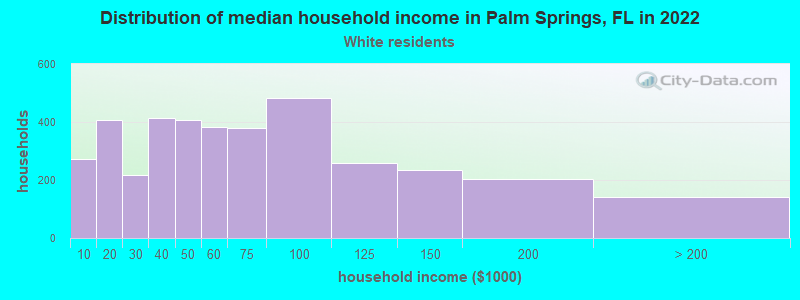
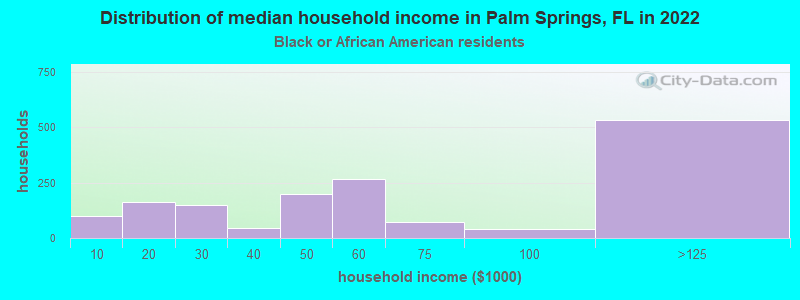
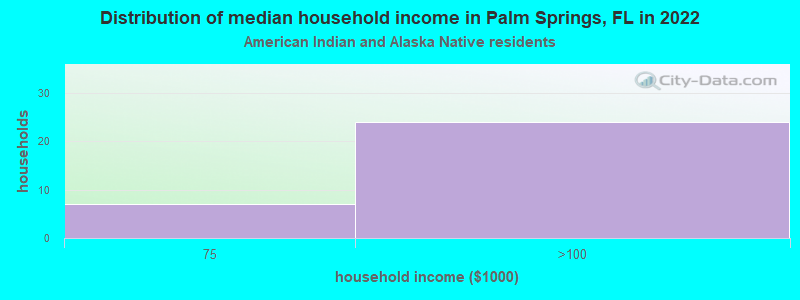
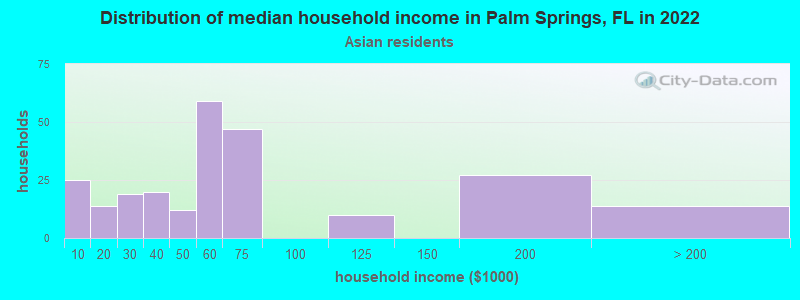
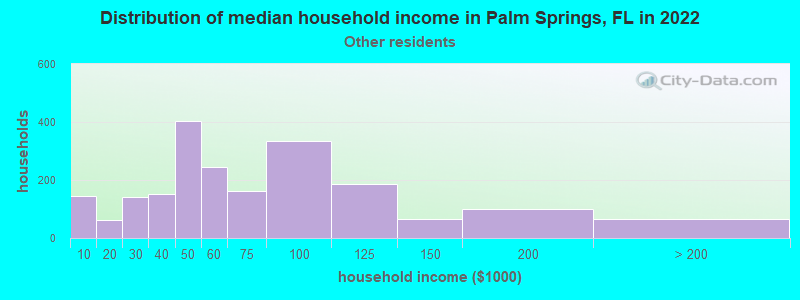
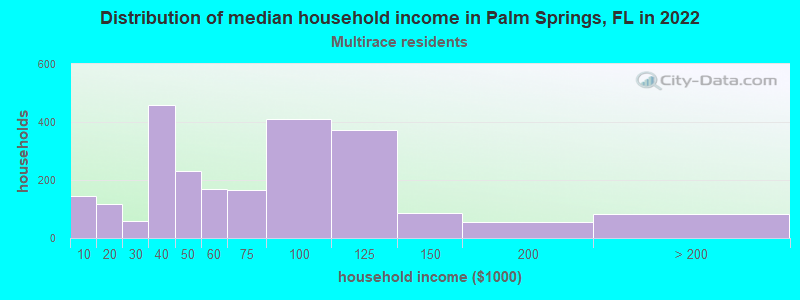
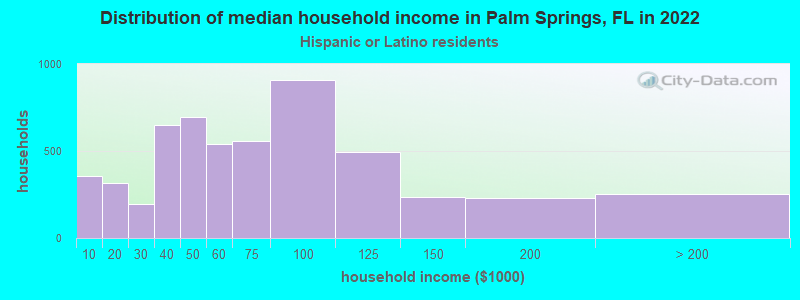
Income and house value in Palm Springs Median household income in 2022 $50,429 White non-Hispanic householders$51,927 Black householders$63,494 Asian householders$60,494 Some other race householders$63,500 Two or more races householders$58,500 Hispanic or Latino race householdersMedian 2022 house value $315,344 White Non-Hispanic householders$307,198 Black or African American householders $313,016 Asian householders$295,174 Some other race householders$310,301 Two or more races householders$315,344 Hispanic or Latino householders
Median age by race in Palm Springs
44.0 Median age for White residents44.8 42.0 32.6 Median age for Black or African American residents25.0 35.2 26.5 Median age for American Indian / Alaska Native residents-806,112,702.2 24.6 20.3 Median age for Asian residents20.4 35.6 33.9 Median age for Native Hawaiian / Pacific Islander residents-674,264,006.9 -672,397,325.0 34.9 Median age for Other race residents34.5 35.5 40.0 Median age for Two or more races residents42.4 34.5 48.7 Median age for White alone residents47.1 49.3 37.7 Median age for Hispanic or Latino residents40.0 35.6
Owner/renter occupied households by race in Palm Springs
House owners and renters - White residents 2,214 58.2% Owner occupied1,590 41.8% Renter occupiedHouse owners and renters - Black or African American residents 266 17.3% Owner occupied1,268 82.7% Renter occupiedHouse owners and renters - American Indian / Alaska Native residents 3 12.2% Owner occupied24 87.8% Renter occupiedHouse owners and renters - Asian residents 152 57.2% Owner occupied114 42.8% Renter occupiedHouse owners and renters - Other race residents 891 43.9% Owner occupied1,136 56.1% Renter occupiedHouse owners and renters - Two or more races residents 1,016 41.6% Owner occupied1,424 58.4% Renter occupiedHouse owners and renters - White alone residents 1,298 64.3% Owner occupied721 35.7% Renter occupiedHouse owners and renters - Hispanic or Latino residents 2,436 44.7% Owner occupied3,015 55.3% Renter occupied
Language usage in Palm Springs
English speakers - Total 28.7% of residents of Palm Springs speak English at home.
56.3% of residents speak Spanish at home 5,698 40.0% Speak English very well8,564 60.0% Speak English less than very well16.2% of residents speak other language at home 2,027 49.4% Speak English very well2,077 50.6% Speak English less than very well
English speakers - Born in the United States 77.1% of residents of Palm Springs speak English at home.
17.7% of residents speak Spanish at home 619 84.8% Speak English very well111 15.2% Speak English less than very well4.7% of residents speak other language at home 188 97.4% Speak English very well5 2.6% Speak English less than very well
English speakers - Native, born elsewhere 25.1% of residents of Palm Springs speak English at home.
70.8% of residents speak Spanish at home 815 73.0% Speak English very well301 27.0% Speak English less than very well2.3% of residents speak other language at home 36 100.0% Speak English very well
English speakers - Foreign-born 4.2% of residents of Palm Springs speak English at home.
73.6% of residents speak Spanish at home 2,399 23.8% Speak English very well7,674 76.2% Speak English less than very well22.7% of residents speak other language at home 1,195 38.5% Speak English very well1,911 61.5% Speak English less than very well
White (Caucasian) - Speak only English Native:
72.8% (4,243)Foreign-born:
4.3% (113)
White (Caucasian) - Speak another language Native:
19.0% (1,108)Foreign-born:
82.3% (2,154)
Black or African American - Speak only English Native:
63.9% (1,151)Foreign-born:
9.3% (192)
Black or African American - Speak another language Native:
37.2% (671)Foreign-born:
92.8% (1,925)
Asian - Speak only English Native:
35.9% (139)Foreign-born:
5.7% (41)
Asian - Speak another language Native:
59.1% (229)Foreign-born:
93.6% (661)
Other race - Speak only English Native:
10.2% (244)Foreign-born:
6.5% (293)
Other race - Speak another language Native:
88.1% (2,108)Foreign-born:
93.5% (4,191)
Two or more races - Speak only English Native:
45.5% (1,069)Foreign-born:
0.7% (37)
Two or more races - Speak another language Native:
55.3% (1,299)Foreign-born:
100.0% (5,218)
White alone - Speak only English Native:
93.9% (3,698)Foreign-born:
29.9% (92)
White alone - Speak another language Native:
5.8% (229)Foreign-born:
69.0% (213)
Hispanic or Latino - Speak only English Native:
24.9% (1,350)Foreign-born:
1.6% (168)
Hispanic or Latino - Speak another language Native:
74.7% (4,051)Foreign-born:
98.5% (10,455)
Foreign-born residents in Palm Springs 13,870 residents are foreign born (45.9% Latin America ).
This city:
51.2%Florida:
21.1%
Marital status for residents in Palm Springs Marital status - White (Caucasian) population 15 years and over
Males 33.1% Never married41.0% Now married3.9% Separated4.0% Widowed17.9% DivorcedFemales 33.4% Never married35.1% Now married5.5% Separated8.7% Widowed17.2% DivorcedWomen who gave birth in the past 12 months Now married:
73.2% (68)Unmarried:
26.8% (25)
Women who did not give birth in the past 12 months Now married:
34.3% (779)Unmarried:
65.7% (1,488)
Marital status - Black or African American population 15 years and over
Males 56.9% Never married33.6% Now married0.0% Separated0.0% Widowed9.5% DivorcedFemales 38.5% Never married21.8% Now married20.6% Separated5.5% Widowed13.5% DivorcedWomen who gave birth in the past 12 months Now married:
78.0% (206)Unmarried:
22.0% (58)
Women who did not give birth in the past 12 months Now married:
42.2% (450)Unmarried:
57.8% (617)
Marital status - American Indian / Alaska Native population 15 years and over
Males 66.7% Never married33.3% Now married0.0% Separated0.0% Widowed0.0% DivorcedFemales 25.0% Never married16.7% Now married58.3% Separated0.0% Widowed0.0% DivorcedWomen who did not give birth in the past 12 months Now married:
75.0% (29)Unmarried:
25.0% (10)
Marital status - Asian population 15 years and over
Males 24.9% Never married72.9% Now married2.2% Separated0.0% Widowed0.0% DivorcedFemales 30.0% Never married70.0% Now married0.0% Separated0.0% Widowed0.0% DivorcedWomen who gave birth in the past 12 months Now married:
100.0% (21)Unmarried:
0.0% (0)
Women who did not give birth in the past 12 months Now married:
65.3% (181)Unmarried:
34.7% (96)
Marital status - Other race population 15 years and over
Males 49.5% Never married40.7% Now married1.6% Separated2.2% Widowed6.0% DivorcedFemales 33.9% Never married34.9% Now married6.4% Separated4.8% Widowed20.1% DivorcedWomen who gave birth in the past 12 months Now married:
40.6% (84)Unmarried:
59.4% (123)
Women who did not give birth in the past 12 months Now married:
37.5% (645)Unmarried:
62.5% (1,076)
Marital status - Two or more races population 15 years and over
Males 34.7% Never married39.9% Now married0.0% Separated1.4% Widowed24.0% DivorcedFemales 35.4% Never married49.4% Now married2.6% Separated3.8% Widowed8.8% DivorcedWomen who gave birth in the past 12 months Now married:
70.8% (71)Unmarried:
29.2% (29)
Women who did not give birth in the past 12 months Now married:
54.2% (822)Unmarried:
45.8% (695)
Marital status - White alone, not Hispanic / Latino population 15 years and over
Males 34.6% Never married41.0% Now married0.0% Separated7.3% Widowed17.0% DivorcedFemales 32.7% Never married32.7% Now married4.6% Separated13.7% Widowed16.2% DivorcedWomen who gave birth in the past 12 months Now married:
100.0% (17)Unmarried:
0.0% (0)
Women who did not give birth in the past 12 months Now married:
25.9% (248)Unmarried:
74.1% (710)
Marital status - Hispanic or Latino population 15 years and over
Males 36.3% Never married41.4% Now married3.0% Separated1.7% Widowed17.6% DivorcedFemales 33.7% Never married40.5% Now married5.6% Separated4.2% Widowed16.0% DivorcedWomen who gave birth in the past 12 months Now married:
56.8% (172)Unmarried:
43.2% (131)
Women who did not give birth in the past 12 months Now married:
43.3% (1,706)Unmarried:
56.7% (2,233)
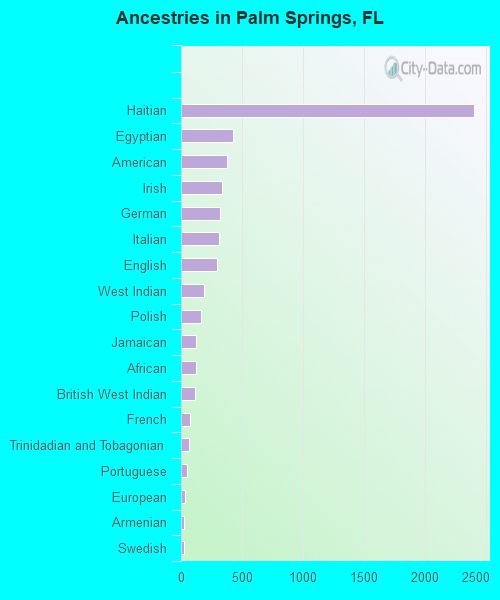
Ancestries in Palm Springs
2,406 12.1% Haitian430 2.2% Egyptian377 1.9% American338 1.7% Irish322 1.6% German309 1.5% Italian292 1.5% English190 1.0% West Indian160 0.8% Polish123 0.6% Jamaican119 0.6% African114 0.6% British West Indian75 0.4% French66 0.3% Trinidadian and Tobagonian47 0.2% Portuguese36 0.2% European25 0.1% Armenian25 0.1% Swedish20 0.1% Slovak14 0.07% Eastern European14 0.07% Romanian13 0.07% Dutch12 0.06% Scottish11 0.06% French Canadian11 0.06% Russian9 0.05% Nigerian9 0.05% Ukrainian6 0.03% Arab6 0.03% Iranian5 0.03% Guyanese5 0.03% Bahamian5 0.03% Lithuanian4 0.02% Macedonian3 0.02% British
Geographical mobility in Palm Springs Same house 1 year ago 8,639 88.3% White (Caucasian)3,843 90.5% Black or African American62 100.0% American Indian / Alaska Native904 77.7% Asian5,756 78.9% Other race6,730 86.4% Two or more races3,982 89.0% White alone, not Hispanic / Latino14,327 84.9% Hispanic or LatinoMoved within same county 661 6.8% White / Caucasian273 6.4% Black or African American57 4.9% Asian1,030 14.1% Other race667 8.6% Two or more races292 6.5% White alone, not Hispanic / Latino1,716 10.2% Hispanic or LatinoMoved within same state 105 1.1% White / Caucasian113 2.7% Black or African American152 2.1% Other race100 1.3% Two or more races86 1.9% White alone, not Hispanic / Latino147 0.9% Hispanic or LatinoMoved from different state 117 1.2% White / Caucasian6 0.1% Black or African American12 1.1% Asian52 0.7% Other race74 1.7% White alone, not Hispanic / Latino101 0.6% Hispanic or LatinoMoved from abroad 137 1.4% White28 0.7% Black or African American180 15.5% Asian150 100.0% Native Hawaiian / Pacific Islander348 4.8% Other race183 2.3% Two or more races16 0.3% White alone, not Hispanic / Latino654 3.9% Hispanic or Latino
Children Nativity (place of birth) in Palm Springs
Children under 6 years - Living with two parents Both parents native 306 98.9% Native4 1.1% Foreign-bornBoth parents foreign-born 451 67.4% Native218 32.6% Foreign-bornOne native, one foreign-born parent 57 100.0% NativeChildren under 6 years - Living with one parent Native parent 258 100.0% NativeForeign-born parent 708 97.0% Native22 3.0% Foreign-bornChildren 6 to 17 years - Living with two parents Both parents native 505 98.2% Native9 1.8% Foreign-bornBoth parents foreign-born 944 66.1% Native484 33.9% Foreign-bornOne native, one foreign-born parent 93 95.3% Native5 4.7% Foreign-bornChildren 6 to 17 years - Living with one parent Foreign-born parent 1,512 60.7% Native977 39.3% Foreign-born
Grandparents responsible for own grandchildren in Palm Springs
Grandparents (30 to 59 years) White / Caucasian 65 62.6% Responsible for grandchildren39 37.4% Not responsible for grandchildrenBlack or African American 37 100.0% Not responsible for grandchildrenOther race 135 76.0% Responsible for grandchildren43 24.0% Not responsible for grandchildrenTwo or more races 17 4.1% Responsible for grandchildren398 95.9% Not responsible for grandchildrenWhite alone, not Hispanic / Latino 28 100.0% Responsible for grandchildrenHispanic or Latino 129 25.9% Responsible for grandchildren368 74.1% Not responsible for grandchildrenGrandparents (60 years and over) White / Caucasian 51 54.8% Responsible for grandchildren43 45.2% Not responsible for grandchildrenBlack or African American 49 100.0% Not responsible for grandchildrenOther race 43 100.0% Not responsible for grandchildrenTwo or more races 23 44.0% Responsible for grandchildren29 56.0% Not responsible for grandchildrenWhite alone, not Hispanic / Latino 25 75.9% Responsible for grandchildren8 24.1% Not responsible for grandchildrenHispanic or Latino 82 40.0% Responsible for grandchildren122 60.0% Not responsible for grandchildren