Races in Parkland, Washington (WA) Detailed Stats
Data:
Races - White alone (%)
Races - White alone (% change since 2000)
Races - Black alone (%)
Races - Black alone (% change since 2000)
Races - American Indian alone (%)
Races - American Indian alone (% change since 2000)
Races - Asian alone (%)
Races - Asian alone (% change since 2000)
Races - Hispanic (%)
Races - Hispanic (% change since 2000)
Races - Native Hawaiian and Other Pacific Islander alone (%)
Races - Native Hawaiian and Other Pacific Islander alone (% change since 2000)
Races - Two or more races(%)
Races - Two or more races(% change since 2000)
Races - Other race alone (%)
Races - Other race alone (% change since 2000)
Racial diversity
Place of birth - Born in state of residence (%)
Place of birth - Born in state of residence (%) - White
Place of birth - Born in state of residence (%) - Black or African American
Place of birth - Born in state of residence (%) - Asian
Place of birth - Born in state of residence (%) - Hispanic or Latino
Place of birth - Born in state of residence (%) - American Indian and Alaska Native
Place of birth - Born in state of residence (%) - Multirace
Place of birth - Born in state of residence (%) - Other Race
Place of birth - Born in other state (%)
Place of birth - Born in other state (%) - White
Place of birth - Born in other state (%) - Black or African American
Place of birth - Born in other state (%) - Asian
Place of birth - Born in other state (%) - Hispanic or Latino
Place of birth - Born in other state (%) - American Indian and Alaska Native
Place of birth - Born in other state (%) - Multirace
Place of birth - Born in other state (%) - Other Race
Place of birth - Native, outside of US (%)
Place of birth - Native, outside of US (%) - White
Place of birth - Native, outside of US (%) - Black or African American
Place of birth - Native, outside of US (%) - Asian
Place of birth - Native, outside of US (%) - Hispanic or Latino
Place of birth - Native, outside of US (%) - American Indian and Alaska Native
Place of birth - Native, outside of US (%) - Multirace
Place of birth - Native, outside of US (%) - Other Race
Place of birth - Foreign born (%)
Place of birth - Foreign born (%) - White
Place of birth - Foreign born (%) - Black or African American
Place of birth - Foreign born (%) - Asian
Place of birth - Foreign born (%) - Hispanic or Latino
Place of birth - Foreign born (%) - American Indian and Alaska Native
Place of birth - Foreign born (%) - Multirace
Place of birth - Foreign born (%) - Other Race
Residents speaking English at home (%)
Residents speaking English at home - Born in the United States (%)
Residents speaking English at home - Native, born elsewhere (%)
Residents speaking English at home - Foreign born (%)
Residents speaking Spanish at home (%)
Residents speaking Spanish at home - Born in the United States (%)
Residents speaking Spanish at home - Native, born elsewhere (%)
Residents speaking Spanish at home - Foreign born (%)
Residents speaking other language at home (%)
Residents speaking other language at home - Born in the United States (%)
Residents speaking other language at home - Native, born elsewhere (%)
Residents speaking other language at home - Foreign born (%)
Marital status - Never married (%)
Marital status - Now married (%)
Marital status - Separated (%)
Marital status - Widowed (%)
Marital status - Divorced (%)
Ancestries Reported - Arab (%)
Ancestries Reported - Czech (%)
Ancestries Reported - Danish (%)
Ancestries Reported - Dutch (%)
Ancestries Reported - English (%)
Ancestries Reported - French (%)
Ancestries Reported - French Canadian (%)
Ancestries Reported - German (%)
Ancestries Reported - Greek (%)
Ancestries Reported - Hungarian (%)
Ancestries Reported - Irish (%)
Ancestries Reported - Italian (%)
Ancestries Reported - Lithuanian (%)
Ancestries Reported - Norwegian (%)
Ancestries Reported - Polish (%)
Ancestries Reported - Portuguese (%)
Ancestries Reported - Russian (%)
Ancestries Reported - Scotch-Irish (%)
Ancestries Reported - Scottish (%)
Ancestries Reported - Slovak (%)
Ancestries Reported - Subsaharan African (%)
Ancestries Reported - Swedish (%)
Ancestries Reported - Swiss (%)
Ancestries Reported - Ukrainian (%)
Ancestries Reported - United States (%)
Ancestries Reported - Welsh (%)
Ancestries Reported - West Indian (%)
Ancestries Reported - Other (%)
Geographical mobility - Same house 1 year ago (%)
Geographical mobility - Same house 1 year ago (%) - White
Geographical mobility - Same house 1 year ago (%) - Black or African American
Geographical mobility - Same house 1 year ago (%) - Asian
Geographical mobility - Same house 1 year ago (%) - Hispanic or Latino
Geographical mobility - Same house 1 year ago (%) - American Indian and Alaska Native
Geographical mobility - Same house 1 year ago (%) - Multirace
Geographical mobility - Same house 1 year ago (%) - Other Race
Geographical mobility - Moved within same county (%)
Geographical mobility - Moved within same county (%) - White
Geographical mobility - Moved within same county (%) - Black or African American
Geographical mobility - Moved within same county (%) - Asian
Geographical mobility - Moved within same county (%) - Hispanic or Latino
Geographical mobility - Moved within same county (%) - American Indian and Alaska Native
Geographical mobility - Moved within same county (%) - Multirace
Geographical mobility - Moved within same county (%) - Other Race
Geographical mobility - Moved from different county within same state (%)
Geographical mobility - Moved from different county within same state (%) - White
Geographical mobility - Moved from different county within same state (%) - Black or African American
Geographical mobility - Moved from different county within same state (%) - Asian
Geographical mobility - Moved from different county within same state (%) - Hispanic or Latino
Geographical mobility - Moved from different county within same state (%) - American Indian and Alaska Native
Geographical mobility - Moved from different county within same state (%) - Multirace
Geographical mobility - Moved from different county within same state (%) - Other Race
Geographical mobility - Moved from different state (%)
Geographical mobility - Moved from different state (%) - White
Geographical mobility - Moved from different state (%) - Black or African American
Geographical mobility - Moved from different state (%) - Asian
Geographical mobility - Moved from different state (%) - Hispanic or Latino
Geographical mobility - Moved from different state (%) - American Indian and Alaska Native
Geographical mobility - Moved from different state (%) - Multirace
Geographical mobility - Moved from different state (%) - Other Race
Geographical mobility - Moved from abroad (%)
Geographical mobility - Moved from abroad (%) - White
Geographical mobility - Moved from abroad (%) - Black or African American
Geographical mobility - Moved from abroad (%) - Asian
Geographical mobility - Moved from abroad (%) - Hispanic or Latino
Geographical mobility - Moved from abroad (%) - American Indian and Alaska Native
Geographical mobility - Moved from abroad (%) - Multirace
Geographical mobility - Moved from abroad (%) - Other Race
Place of birth for the foreign-born population - Ireland (%)
Place of birth for the foreign-born population - Denmark (%)
Place of birth for the foreign-born population - Norway (%)
Place of birth for the foreign-born population - Sweden (%)
Place of birth for the foreign-born population - United Kingdom (%)
Place of birth for the foreign-born population - England (%)
Place of birth for the foreign-born population - Scotland (%)
Place of birth for the foreign-born population - Other Northern Europe (%)
Place of birth for the foreign-born population - Austria (%)
Place of birth for the foreign-born population - Belgium (%)
Place of birth for the foreign-born population - France (%)
Place of birth for the foreign-born population - Germany (%)
Place of birth for the foreign-born population - Netherlands (%)
Place of birth for the foreign-born population - Switzerland (%)
Place of birth for the foreign-born population - Other Western Europe (%)
Place of birth for the foreign-born population - Greece (%)
Place of birth for the foreign-born population - Italy (%)
Place of birth for the foreign-born population - Portugal (%)
Place of birth for the foreign-born population - Spain (%)
Place of birth for the foreign-born population - Other Southern Europe (%)
Place of birth for the foreign-born population - Albania (%)
Place of birth for the foreign-born population - Belarus (%)
Place of birth for the foreign-born population - Bosnia and Herzegovina (%)
Place of birth for the foreign-born population - Bulgaria (%)
Place of birth for the foreign-born population - Croatia (%)
Place of birth for the foreign-born population - Czechoslovakia (%)
Place of birth for the foreign-born population - Hungary (%)
Place of birth for the foreign-born population - Latvia (%)
Place of birth for the foreign-born population - Lithuania (%)
Place of birth for the foreign-born population - North Macedonia (Macedonia) (%)
Place of birth for the foreign-born population - Moldova (%)
Place of birth for the foreign-born population - Poland (%)
Place of birth for the foreign-born population - Romania (%)
Place of birth for the foreign-born population - Russia (%)
Place of birth for the foreign-born population - Serbia (%)
Place of birth for the foreign-born population - Ukraine (%)
Place of birth for the foreign-born population - Other Eastern Europe (%)
Place of birth for the foreign-born population - China (%)
Place of birth for the foreign-born population - Hong Kong (%)
Place of birth for the foreign-born population - Taiwan (%)
Place of birth for the foreign-born population - Japan (%)
Place of birth for the foreign-born population - Korea (%)
Place of birth for the foreign-born population - Other Eastern Asia (%)
Place of birth for the foreign-born population - Afghanistan (%)
Place of birth for the foreign-born population - Bangladesh (%)
Place of birth for the foreign-born population - India (%)
Place of birth for the foreign-born population - Iran (%)
Place of birth for the foreign-born population - Kazakhstan (%)
Place of birth for the foreign-born population - Nepal (%)
Place of birth for the foreign-born population - Pakistan (%)
Place of birth for the foreign-born population - Sri Lanka (%)
Place of birth for the foreign-born population - Uzbekistan (%)
Place of birth for the foreign-born population - Other South Central Asia (%)
Place of birth for the foreign-born population - Burma (%)
Place of birth for the foreign-born population - Cambodia (%)
Place of birth for the foreign-born population - Indonesia (%)
Place of birth for the foreign-born population - Laos (%)
Place of birth for the foreign-born population - Malaysia (%)
Place of birth for the foreign-born population - Philippines (%)
Place of birth for the foreign-born population - Singapore (%)
Place of birth for the foreign-born population - Thailand (%)
Place of birth for the foreign-born population - Vietnam (%)
Place of birth for the foreign-born population - Other South Eastern Asia (%)
Place of birth for the foreign-born population - Armenia (%)
Place of birth for the foreign-born population - Iraq (%)
Place of birth for the foreign-born population - Israel (%)
Place of birth for the foreign-born population - Jordan (%)
Place of birth for the foreign-born population - Kuwait (%)
Place of birth for the foreign-born population - Lebanon (%)
Place of birth for the foreign-born population - Saudi Arabia (%)
Place of birth for the foreign-born population - Syria (%)
Place of birth for the foreign-born population - Turkey (%)
Place of birth for the foreign-born population - Yemen (%)
Place of birth for the foreign-born population - Other Western Asia (%)
Place of birth for the foreign-born population - Eritrea (%)
Place of birth for the foreign-born population - Ethiopia (%)
Place of birth for the foreign-born population - Kenya (%)
Place of birth for the foreign-born population - Somalia (%)
Place of birth for the foreign-born population - Uganda (%)
Place of birth for the foreign-born population - Zimbabwe (%)
Place of birth for the foreign-born population - Other Eastern Africa (%)
Place of birth for the foreign-born population - Cameroon (%)
Place of birth for the foreign-born population - Congo (%)
Place of birth for the foreign-born population - Democratic Republic of Congo (Zaire) (%)
Place of birth for the foreign-born population - Other Middle Africa (%)
Place of birth for the foreign-born population - Egypt (%)
Place of birth for the foreign-born population - Morocco (%)
Place of birth for the foreign-born population - Sudan (%)
Place of birth for the foreign-born population - Other Northern Africa (%)
Place of birth for the foreign-born population - South Africa (%)
Place of birth for the foreign-born population - Other Southern Africa (%)
Place of birth for the foreign-born population - Cabo Verde (%)
Place of birth for the foreign-born population - Ghana (%)
Place of birth for the foreign-born population - Liberia (%)
Place of birth for the foreign-born population - Nigeria (%)
Place of birth for the foreign-born population - Senegal (%)
Place of birth for the foreign-born population - Sierra Leone (%)
Place of birth for the foreign-born population - Other Western Africa (%)
Place of birth for the foreign-born population - Australia (%)
Place of birth for the foreign-born population - New Zealand (%)
Place of birth for the foreign-born population - Fiji (%)
Place of birth for the foreign-born population - Micronesia (%)
Place of birth for the foreign-born population - Bahamas (%)
Place of birth for the foreign-born population - Barbados (%)
Place of birth for the foreign-born population - Cuba (%)
Place of birth for the foreign-born population - Dominica (%)
Place of birth for the foreign-born population - Dominican Republic (%)
Place of birth for the foreign-born population - Grenada (%)
Place of birth for the foreign-born population - Haiti (%)
Place of birth for the foreign-born population - Jamaica (%)
Place of birth for the foreign-born population - St. Vincent and the Grenadines (%)
Place of birth for the foreign-born population - Trinidad and Tobago (%)
Place of birth for the foreign-born population - West Indies (%)
Place of birth for the foreign-born population - Other Caribbean (%)
Place of birth for the foreign-born population - Belize (%)
Place of birth for the foreign-born population - Costa Rica (%)
Place of birth for the foreign-born population - El Salvador (%)
Place of birth for the foreign-born population - Guatemala (%)
Place of birth for the foreign-born population - Honduras (%)
Place of birth for the foreign-born population - Mexico (%)
Place of birth for the foreign-born population - Nicaragua (%)
Place of birth for the foreign-born population - Panama (%)
Place of birth for the foreign-born population - Other Central America (%)
Place of birth for the foreign-born population - Argentina (%)
Place of birth for the foreign-born population - Bolivia (%)
Place of birth for the foreign-born population - Brazil (%)
Place of birth for the foreign-born population - Chile (%)
Place of birth for the foreign-born population - Colombia (%)
Place of birth for the foreign-born population - Ecuador (%)
Place of birth for the foreign-born population - Guyana (%)
Place of birth for the foreign-born population - Peru (%)
Place of birth for the foreign-born population - Uruguay (%)
Place of birth for the foreign-born population - Venezuela (%)
Place of birth for the foreign-born population - Other South America (%)
Place of birth for the foreign-born population - Canada (%)
Place of birth for the foreign-born population - Other Northern America (%)
Place of birth for the foreign-born population - Other (%)
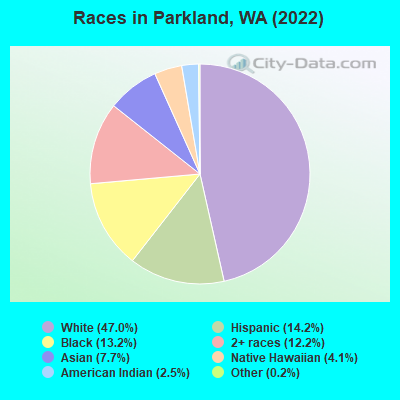
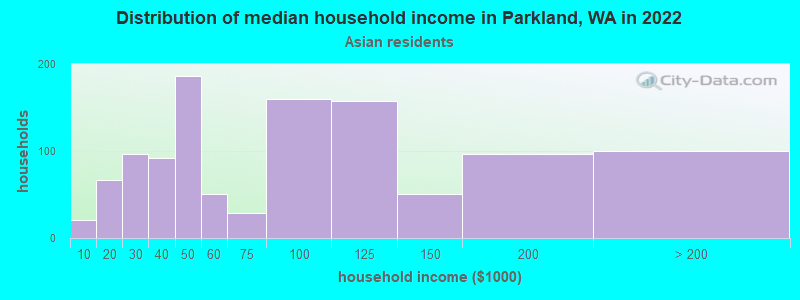
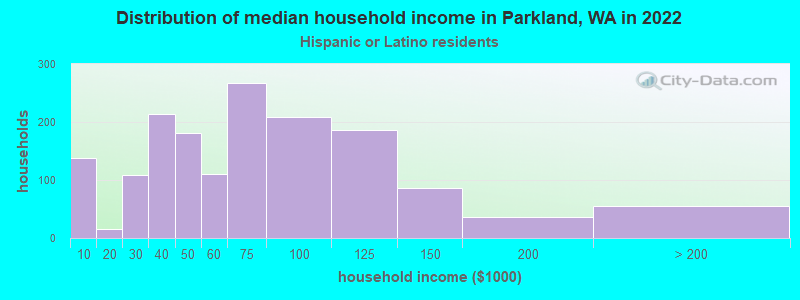
According to 2022 data, the most numerous races in Parkland, WA are White alone (18,679 residents), Hispanic (5,644 residents), and Asian alone (3,057 residents). 76.4% of Parkland residents speak English at home. 15.5% of Parkland, WA residents are foreign-born (5.5% born in Asia, 3.3% born in Latin America, 2.2% born in Africa, 2.1% born in Europe, 1.9% born in Oceania), which is 3.2% greater than the foreign-born rate of 15.0% across the entire state of Washington.
Race distribution in Parkland
2000 2022
17,223 71.6% White alone 1,893 7.9% Black alone 1,574 6.5% Asian alone 1,360 5.7% Two or more races 1,281 5.3% Hispanic 420 1.7% Native Hawaiian and Other 236 1.0% American Indian alone 66 0.3% Other race alone
18,679 47.0% White alone 5,644 14.2% Hispanic 5,248 13.2% Black alone 4,860 12.2% Two or more races 3,057 7.7% Asian alone 1,611 4.1% Native Hawaiian and Other 993 2.5% American Indian alone 66 0.2% Other race alone
2000 2022
4,652,490 78.9% White alone 441,509 7.5% Hispanic 319,401 5.4% Asian alone 184,631 3.1% Black alone 175,926 3.0% Two or more races 85,396 1.4% American Indian alone 22,779 0.4% Native Hawaiian and Other 11,989 0.2% Other race alone
4,941,456 63.5% White alone 1,093,313 14.0% Hispanic 755,832 9.7% Asian alone 523,448 6.7% Two or more races 299,537 3.8% Black alone 69,024 0.9% American Indian alone 52,231 0.7% Native Hawaiian and Other 50,945 0.7% Other race alone
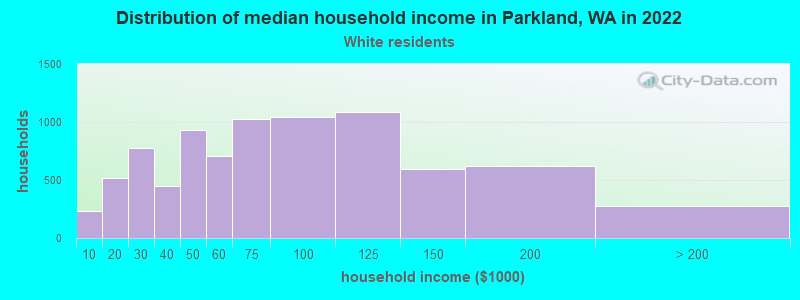
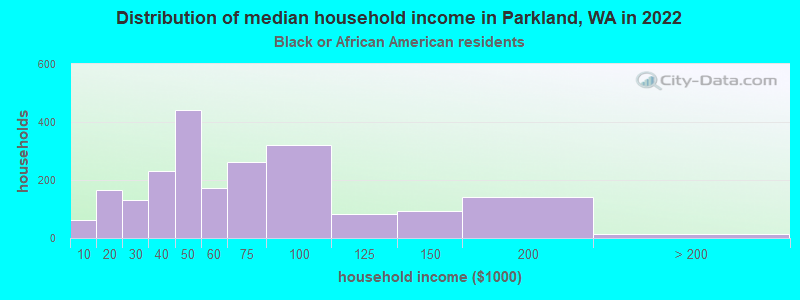
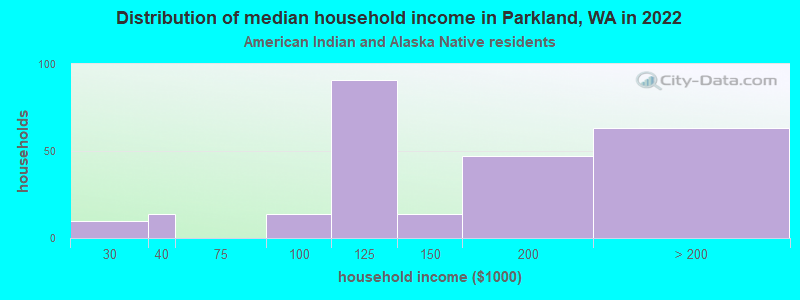
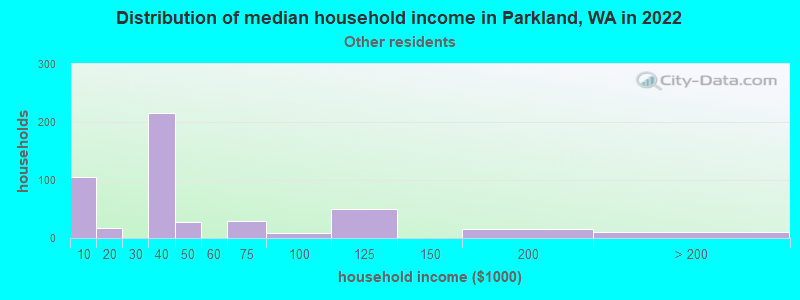
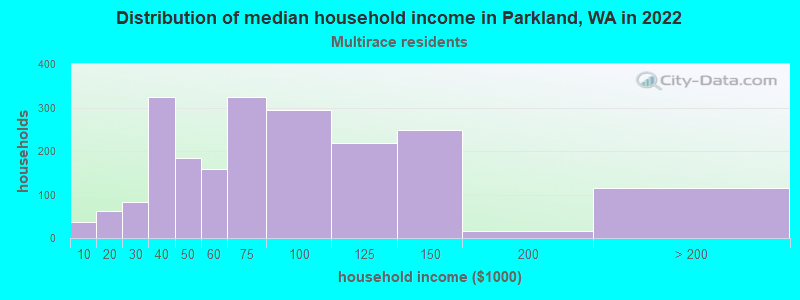
Income and house value in Parkland Median household income in 2022 $70,658 White non-Hispanic householders$52,485 Black householders$168,194 American Indian and Alaska Native householders$76,408 Asian householders$83,984 Native Hawaiian and other Pacific Islander householders$35,186 Some other race householders$73,376 Two or more races householders$69,191 Hispanic or Latino race householdersMedian 2022 house value $420,411 White Non-Hispanic householders$433,962 Black or African American householders$418,759 American Indian or Alaska Native householders $390,004 Asian householders$471,641 Native Hawaiian and other Pacific Islander householders$363,563 Some other race householders$413,801 Two or more races householders$429,666 Hispanic or Latino householders
Median age by race in Parkland
37.5 Median age for White residents37.0 38.5 35.2 Median age for Black or African American residents34.6 43.8 15.5 Median age for American Indian / Alaska Native residents17.6 18.9 46.7 Median age for Asian residents39.0 53.0 41.2 Median age for Native Hawaiian / Pacific Islander residents41.0 48.9 26.4 Median age for Other race residents23.0 31.6 26.7 Median age for Two or more races residents28.3 25.3 40.4 Median age for White alone residents39.8 41.2 25.5 Median age for Hispanic or Latino residents24.8 26.0
Owner/renter occupied households by race in Parkland
House owners and renters - White residents 5,130 61.6% Owner occupied3,197 38.4% Renter occupiedHouse owners and renters - Black or African American residents 562 26.6% Owner occupied1,552 73.4% Renter occupiedHouse owners and renters - American Indian / Alaska Native residents 91 54.9% Owner occupied75 45.1% Renter occupiedHouse owners and renters - Asian residents 748 68.7% Owner occupied340 31.3% Renter occupiedHouse owners and renters - Native Hawaiian / Pacific Islander residents 219 34.5% Owner occupied415 65.5% Renter occupiedHouse owners and renters - Other race residents 207 42.6% Owner occupied279 57.4% Renter occupiedHouse owners and renters - Two or more races residents 806 38.2% Owner occupied1,306 61.8% Renter occupiedHouse owners and renters - White alone residents 4,848 62.1% Owner occupied2,963 37.9% Renter occupiedHouse owners and renters - Hispanic or Latino residents 756 43.9% Owner occupied968 56.1% Renter occupied
Language usage in Parkland
English speakers - Total 76.4% of residents of Parkland speak English at home.
7.9% of residents speak Spanish at home 2,038 68.9% Speak English very well918 31.1% Speak English less than very well16.1% of residents speak other language at home 3,036 50.3% Speak English very well2,996 49.7% Speak English less than very well
English speakers - Born in the United States 93.0% of residents of Parkland speak English at home.
4.4% of residents speak Spanish at home 523 93.7% Speak English very well35 6.3% Speak English less than very well2.6% of residents speak other language at home 246 72.6% Speak English very well93 27.4% Speak English less than very well
English speakers - Native, born elsewhere 55.5% of residents of Parkland speak English at home.
12.4% of residents speak Spanish at home 140 65.1% Speak English very well75 34.9% Speak English less than very well30.3% of residents speak other language at home 372 70.7% Speak English very well154 29.3% Speak English less than very well
English speakers - Foreign-born 13.4% of residents of Parkland speak English at home.
17.5% of residents speak Spanish at home 289 26.0% Speak English very well821 74.0% Speak English less than very well70.4% of residents speak other language at home 1,829 41.1% Speak English very well2,622 58.9% Speak English less than very well
White (Caucasian) - Speak only English Native:
95.0% (16,880)Foreign-born:
18.0% (214)
White (Caucasian) - Speak another language Native:
4.3% (758)Foreign-born:
84.2% (1,005)
Black or African American - Speak only English Native:
97.0% (4,190)Foreign-born:
15.2% (166)
Black or African American - Speak another language Native:
2.9% (125)Foreign-born:
83.8% (911)
Asian - Speak only English Native:
61.8% (617)Foreign-born:
8.7% (183)
Asian - Speak another language Native:
37.8% (378)Foreign-born:
87.9% (1,845)
Native Hawaiian / Pacific Islander - Speak only English Native:
49.2% (420)Foreign-born:
4.6% (27)
Native Hawaiian / Pacific Islander - Speak another language Native:
52.7% (449)Foreign-born:
88.9% (519)
Other race - Speak only English Native:
41.0% (512)Foreign-born:
5.1% (18)
Other race - Speak another language Native:
58.6% (731)Foreign-born:
94.4% (326)
Two or more races - Speak only English Native:
80.0% (4,464)Foreign-born:
15.9% (171)
Two or more races - Speak another language Native:
20.6% (1,152)Foreign-born:
80.2% (864)
White alone - Speak only English Native:
96.7% (16,092)Foreign-born:
22.7% (226)
White alone - Speak another language Native:
3.1% (508)Foreign-born:
80.7% (804)
Hispanic or Latino - Speak only English Native:
53.4% (2,072)Foreign-born:
4.9% (61)
Hispanic or Latino - Speak another language Native:
45.3% (1,759)Foreign-born:
95.8% (1,194)
Foreign-born residents in Parkland 6,159 residents are foreign born (5.5% Asia , 3.3% Latin America , 2.2% Africa , 2.1% Europe , 1.9% Oceania ).
This city:
15.5%Washington:
14.9%
Marital status for residents in Parkland Marital status - White (Caucasian) population 15 years and over
Males 33.7% Never married49.1% Now married0.5% Separated3.0% Widowed13.7% DivorcedFemales 32.9% Never married40.5% Now married0.8% Separated9.0% Widowed16.8% DivorcedWomen who gave birth in the past 12 months Now married:
56.4% (149)Unmarried:
43.6% (116)
Women who did not give birth in the past 12 months Now married:
37.3% (1,737)Unmarried:
62.7% (2,918)
Marital status - Black or African American population 15 years and over
Males 54.0% Never married31.6% Now married0.8% Separated2.2% Widowed11.5% DivorcedFemales 46.1% Never married27.1% Now married7.0% Separated5.5% Widowed14.2% DivorcedWomen who gave birth in the past 12 months Now married:
68.8% (11)Unmarried:
31.2% (5)
Women who did not give birth in the past 12 months Now married:
35.6% (379)Unmarried:
64.4% (684)
Marital status - American Indian / Alaska Native population 15 years and over
Males 79.3% Never married20.7% Now married0.0% Separated0.0% Widowed0.0% DivorcedFemales 34.8% Never married50.0% Now married0.0% Separated0.0% Widowed15.2% DivorcedWomen who did not give birth in the past 12 months Now married:
44.7% (94)Unmarried:
55.3% (117)
Marital status - Asian population 15 years and over
Males 40.0% Never married51.5% Now married0.9% Separated3.2% Widowed4.4% DivorcedFemales 29.1% Never married48.0% Now married1.4% Separated11.5% Widowed10.1% DivorcedWomen who gave birth in the past 12 months Now married:
26.3% (10)Unmarried:
73.7% (29)
Women who did not give birth in the past 12 months Now married:
38.4% (283)Unmarried:
61.6% (455)
Marital status - Native Hawaiian / Pacific Islander population 15 years and over
Males 50.6% Never married46.0% Now married2.0% Separated1.4% Widowed0.0% DivorcedFemales 16.5% Never married41.8% Now married0.0% Separated19.6% Widowed22.2% DivorcedWomen who gave birth in the past 12 months Now married:
100.0% (87)Unmarried:
0.0% (0)
Women who did not give birth in the past 12 months Now married:
24.7% (43)Unmarried:
75.3% (131)
Marital status - Other race population 15 years and over
Males 40.5% Never married35.2% Now married0.4% Separated0.0% Widowed24.0% DivorcedFemales 48.9% Never married39.3% Now married0.0% Separated0.8% Widowed11.0% DivorcedWomen who gave birth in the past 12 months Now married:
46.9% (33)Unmarried:
53.1% (37)
Women who did not give birth in the past 12 months Now married:
33.7% (148)Unmarried:
66.3% (291)
Marital status - Two or more races population 15 years and over
Males 50.8% Never married34.6% Now married2.9% Separated0.0% Widowed11.8% DivorcedFemales 50.1% Never married38.9% Now married2.8% Separated0.6% Widowed7.6% DivorcedWomen who gave birth in the past 12 months Now married:
100.0% (166)Unmarried:
0.0% (0)
Women who did not give birth in the past 12 months Now married:
32.4% (582)Unmarried:
67.6% (1,212)
Marital status - White alone, not Hispanic / Latino population 15 years and over
Males 30.7% Never married50.8% Now married0.6% Separated3.3% Widowed14.7% DivorcedFemales 32.3% Never married39.7% Now married0.9% Separated9.7% Widowed17.4% DivorcedWomen who gave birth in the past 12 months Now married:
54.1% (140)Unmarried:
45.9% (119)
Women who did not give birth in the past 12 months Now married:
35.7% (1,499)Unmarried:
64.3% (2,706)
Marital status - Hispanic or Latino population 15 years and over
Males 48.2% Never married39.8% Now married1.6% Separated0.0% Widowed10.4% DivorcedFemales 44.9% Never married43.1% Now married1.8% Separated0.6% Widowed9.6% DivorcedWomen who gave birth in the past 12 months Now married:
56.4% (48)Unmarried:
43.6% (37)
Women who did not give birth in the past 12 months Now married:
41.0% (673)Unmarried:
59.0% (967)
Ancestries in Parkland
1,445 6.8% German1,244 5.8% American733 3.4% European634 3.0% English560 2.6% Irish493 2.3% African478 2.2% Kenyan433 2.0% Norwegian336 1.6% Nigerian247 1.2% Russian239 1.1% Italian202 0.9% Swedish183 0.9% Ukrainian142 0.7% Scandinavian134 0.6% French96 0.5% Romanian93 0.4% Polish90 0.4% French Canadian53 0.2% British45 0.2% Scotch-Irish43 0.2% Yugoslavian39 0.2% Scottish39 0.2% Welsh29 0.1% Northern European27 0.1% Greek27 0.1% Barbadian22 0.1% Danish21 0.10% Latvian20 0.09% Ghanaian19 0.09% Ethiopian17 0.08% Canadian16 0.08% Swiss15 0.07% Finnish15 0.07% Haitian12 0.06% Hungarian7 0.03% Croatian6 0.03% West Indian5 0.02% Slavic5 0.02% Eastern European4 0.02% Belgian
Geographical mobility in Parkland Same house 1 year ago 16,953 84.3% White (Caucasian)4,252 77.5% Black or African American639 66.2% American Indian / Alaska Native2,543 82.2% Asian1,210 82.2% Native Hawaiian / Pacific Islander1,291 79.1% Other race5,675 81.0% Two or more races15,693 84.7% White alone, not Hispanic / Latino4,174 74.9% Hispanic or LatinoMoved within same county 2,170 10.8% White / Caucasian606 11.1% Black or African American204 21.1% American Indian / Alaska Native274 8.9% Asian171 11.7% Native Hawaiian / Pacific Islander252 15.5% Other race1,289 18.4% Two or more races1,867 10.1% White alone, not Hispanic / Latino1,281 23.0% Hispanic or LatinoMoved within same state 303 1.5% White / Caucasian34 0.6% Black or African American54 1.8% Asian24 1.6% Native Hawaiian / Pacific Islander11 0.6% Other race40 0.6% Two or more races314 1.7% White alone, not Hispanic / Latino25 0.5% Hispanic or LatinoMoved from different state 612 3.0% White / Caucasian250 4.6% Black or African American69 2.2% Asian29 2.0% Native Hawaiian / Pacific Islander150 9.2% Other race117 1.7% Two or more races585 3.2% White alone, not Hispanic / Latino178 3.2% Hispanic or LatinoMoved from abroad 150 2.7% Black or African American131 4.2% Asian30 2.0% Native Hawaiian / Pacific Islander13 0.8% Other race10 0.2% Hispanic or Latino
Children Nativity (place of birth) in Parkland
Children under 6 years - Living with two parents Both parents native 1,285 100.0% Native0 0.0% Foreign-bornBoth parents foreign-born 262 100.0% NativeOne native, one foreign-born parent 301 94.6% Native17 5.4% Foreign-bornChildren under 6 years - Living with one parent Native parent 874 100.0% NativeForeign-born parent 157 100.0% NativeChildren 6 to 17 years - Living with two parents Both parents native 1,456 100.0% NativeBoth parents foreign-born 512 60.8% Native330 39.2% Foreign-bornOne native, one foreign-born parent 449 78.0% Native127 22.0% Foreign-bornChildren 6 to 17 years - Living with one parent Native parent 2,267 100.0% NativeForeign-born parent 485 53.2% Native427 46.8% Foreign-born
Grandparents responsible for own grandchildren in Parkland
Grandparents (30 to 59 years) White / Caucasian 172 35.1% Responsible for grandchildren318 64.9% Not responsible for grandchildrenBlack or African American 17 51.5% Responsible for grandchildren16 48.5% Not responsible for grandchildrenAsian 12 34.8% Responsible for grandchildren22 65.2% Not responsible for grandchildrenNative Hawaiian / Pacific Islander 10 100.0% Responsible for grandchildrenTwo or more races 11 35.4% Responsible for grandchildren21 64.6% Not responsible for grandchildrenWhite alone, not Hispanic / Latino 151 31.6% Responsible for grandchildren327 68.4% Not responsible for grandchildrenHispanic or Latino 29 100.0% Not responsible for grandchildrenGrandparents (60 years and over) White / Caucasian 39 18.7% Responsible for grandchildren170 81.3% Not responsible for grandchildrenBlack or African American 15 100.0% Not responsible for grandchildrenAsian 111 100.0% Not responsible for grandchildrenNative Hawaiian / Pacific Islander 17 100.0% Not responsible for grandchildrenTwo or more races 16 100.0% Not responsible for grandchildrenWhite alone, not Hispanic / Latino 41 19.3% Responsible for grandchildren171 80.7% Not responsible for grandchildrenHispanic or Latino 11 100.0% Not responsible for grandchildren