Races in Paso Robles, California (CA) Detailed Stats
Ancestries, Foreign-born residents, place of birth
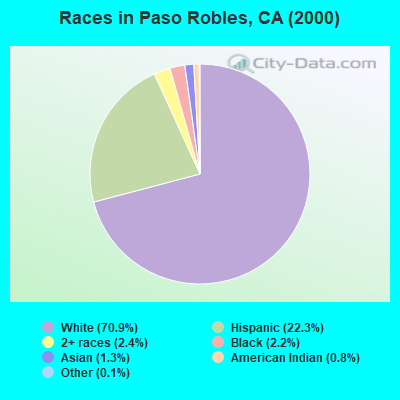
Race distribution in Paso Robles

- 28,70670.9%White alone
- 9,04122.3%Hispanic
- 9532.4%Two or more races
- 8802.2%Black alone
- 5251.3%Asian alone
- 3130.8%American Indian alone
- 530.1%Other race alone
- 220.05%Native Hawaiian and Other
Pacific Islander alone
2000
2022
-
- 15,816,79046.7%White alone
- 10,966,55632.4%Hispanic
- 3,648,86010.8%Asian alone
- 2,181,9266.4%Black alone
- 903,1152.7%Two or more races
- 178,9840.5%American Indian alone
- 103,7360.3%Native Hawaiian and Other
Pacific Islander alone - 71,6810.2%Other race alone

-
- 15,732,18440.3%Hispanic
- 13,160,42633.7%White alone
- 5,957,86715.3%Asian alone
- 2,025,2185.2%Black alone
- 1,663,2224.3%Two or more races
- 251,6180.6%Other race alone
- 135,7770.3%Native Hawaiian and Other
Pacific Islander alone - 103,0300.3%American Indian alone

Income and house value in Paso Robles
- Median household income in 2022
- $84,523White non-Hispanic householders
- $60,971Black householders
- $86,613American Indian and Alaska Native householders
- $121,574Asian householders
- $4,182Native Hawaiian and other Pacific Islander householders
- $54,184Some other race householders
- $73,399Two or more races householders
- $66,951Hispanic or Latino race householders
- Median 2022 house value
- $613,679White Non-Hispanic householders
- $483,745Black or African American householders
- $637,795American Indian or Alaska Native householders
- $633,476Asian householders
- $528,736Some other race householders
- $580,926Two or more races householders
- $539,174Hispanic or Latino householders
Household income for White non-Hispanic householders

Household income for Black householders

Household income for American Indian and Alaska Native householders

Household income for Asian householders

Household income for Native Hawaiian and other Pacific Islander householders

Household income for Two or more races householders

Household income for Hispanic or Latino race householders

Zip code: 93446