Races in Peachtree City, Georgia (GA) Detailed Stats
Data:
Races - White alone (%)
Races - White alone (% change since 2000)
Races - Black alone (%)
Races - Black alone (% change since 2000)
Races - American Indian alone (%)
Races - American Indian alone (% change since 2000)
Races - Asian alone (%)
Races - Asian alone (% change since 2000)
Races - Hispanic (%)
Races - Hispanic (% change since 2000)
Races - Native Hawaiian and Other Pacific Islander alone (%)
Races - Native Hawaiian and Other Pacific Islander alone (% change since 2000)
Races - Two or more races(%)
Races - Two or more races(% change since 2000)
Races - Other race alone (%)
Races - Other race alone (% change since 2000)
Racial diversity
Place of birth - Born in state of residence (%)
Place of birth - Born in state of residence (%) - White
Place of birth - Born in state of residence (%) - Black or African American
Place of birth - Born in state of residence (%) - Asian
Place of birth - Born in state of residence (%) - Hispanic or Latino
Place of birth - Born in state of residence (%) - American Indian and Alaska Native
Place of birth - Born in state of residence (%) - Multirace
Place of birth - Born in state of residence (%) - Other Race
Place of birth - Born in other state (%)
Place of birth - Born in other state (%) - White
Place of birth - Born in other state (%) - Black or African American
Place of birth - Born in other state (%) - Asian
Place of birth - Born in other state (%) - Hispanic or Latino
Place of birth - Born in other state (%) - American Indian and Alaska Native
Place of birth - Born in other state (%) - Multirace
Place of birth - Born in other state (%) - Other Race
Place of birth - Native, outside of US (%)
Place of birth - Native, outside of US (%) - White
Place of birth - Native, outside of US (%) - Black or African American
Place of birth - Native, outside of US (%) - Asian
Place of birth - Native, outside of US (%) - Hispanic or Latino
Place of birth - Native, outside of US (%) - American Indian and Alaska Native
Place of birth - Native, outside of US (%) - Multirace
Place of birth - Native, outside of US (%) - Other Race
Place of birth - Foreign born (%)
Place of birth - Foreign born (%) - White
Place of birth - Foreign born (%) - Black or African American
Place of birth - Foreign born (%) - Asian
Place of birth - Foreign born (%) - Hispanic or Latino
Place of birth - Foreign born (%) - American Indian and Alaska Native
Place of birth - Foreign born (%) - Multirace
Place of birth - Foreign born (%) - Other Race
Residents speaking English at home (%)
Residents speaking English at home - Born in the United States (%)
Residents speaking English at home - Native, born elsewhere (%)
Residents speaking English at home - Foreign born (%)
Residents speaking Spanish at home (%)
Residents speaking Spanish at home - Born in the United States (%)
Residents speaking Spanish at home - Native, born elsewhere (%)
Residents speaking Spanish at home - Foreign born (%)
Residents speaking other language at home (%)
Residents speaking other language at home - Born in the United States (%)
Residents speaking other language at home - Native, born elsewhere (%)
Residents speaking other language at home - Foreign born (%)
Marital status - Never married (%)
Marital status - Now married (%)
Marital status - Separated (%)
Marital status - Widowed (%)
Marital status - Divorced (%)
Ancestries Reported - Arab (%)
Ancestries Reported - Czech (%)
Ancestries Reported - Danish (%)
Ancestries Reported - Dutch (%)
Ancestries Reported - English (%)
Ancestries Reported - French (%)
Ancestries Reported - French Canadian (%)
Ancestries Reported - German (%)
Ancestries Reported - Greek (%)
Ancestries Reported - Hungarian (%)
Ancestries Reported - Irish (%)
Ancestries Reported - Italian (%)
Ancestries Reported - Lithuanian (%)
Ancestries Reported - Norwegian (%)
Ancestries Reported - Polish (%)
Ancestries Reported - Portuguese (%)
Ancestries Reported - Russian (%)
Ancestries Reported - Scotch-Irish (%)
Ancestries Reported - Scottish (%)
Ancestries Reported - Slovak (%)
Ancestries Reported - Subsaharan African (%)
Ancestries Reported - Swedish (%)
Ancestries Reported - Swiss (%)
Ancestries Reported - Ukrainian (%)
Ancestries Reported - United States (%)
Ancestries Reported - Welsh (%)
Ancestries Reported - West Indian (%)
Ancestries Reported - Other (%)
Geographical mobility - Same house 1 year ago (%)
Geographical mobility - Same house 1 year ago (%) - White
Geographical mobility - Same house 1 year ago (%) - Black or African American
Geographical mobility - Same house 1 year ago (%) - Asian
Geographical mobility - Same house 1 year ago (%) - Hispanic or Latino
Geographical mobility - Same house 1 year ago (%) - American Indian and Alaska Native
Geographical mobility - Same house 1 year ago (%) - Multirace
Geographical mobility - Same house 1 year ago (%) - Other Race
Geographical mobility - Moved within same county (%)
Geographical mobility - Moved within same county (%) - White
Geographical mobility - Moved within same county (%) - Black or African American
Geographical mobility - Moved within same county (%) - Asian
Geographical mobility - Moved within same county (%) - Hispanic or Latino
Geographical mobility - Moved within same county (%) - American Indian and Alaska Native
Geographical mobility - Moved within same county (%) - Multirace
Geographical mobility - Moved within same county (%) - Other Race
Geographical mobility - Moved from different county within same state (%)
Geographical mobility - Moved from different county within same state (%) - White
Geographical mobility - Moved from different county within same state (%) - Black or African American
Geographical mobility - Moved from different county within same state (%) - Asian
Geographical mobility - Moved from different county within same state (%) - Hispanic or Latino
Geographical mobility - Moved from different county within same state (%) - American Indian and Alaska Native
Geographical mobility - Moved from different county within same state (%) - Multirace
Geographical mobility - Moved from different county within same state (%) - Other Race
Geographical mobility - Moved from different state (%)
Geographical mobility - Moved from different state (%) - White
Geographical mobility - Moved from different state (%) - Black or African American
Geographical mobility - Moved from different state (%) - Asian
Geographical mobility - Moved from different state (%) - Hispanic or Latino
Geographical mobility - Moved from different state (%) - American Indian and Alaska Native
Geographical mobility - Moved from different state (%) - Multirace
Geographical mobility - Moved from different state (%) - Other Race
Geographical mobility - Moved from abroad (%)
Geographical mobility - Moved from abroad (%) - White
Geographical mobility - Moved from abroad (%) - Black or African American
Geographical mobility - Moved from abroad (%) - Asian
Geographical mobility - Moved from abroad (%) - Hispanic or Latino
Geographical mobility - Moved from abroad (%) - American Indian and Alaska Native
Geographical mobility - Moved from abroad (%) - Multirace
Geographical mobility - Moved from abroad (%) - Other Race
Place of birth for the foreign-born population - Ireland (%)
Place of birth for the foreign-born population - Denmark (%)
Place of birth for the foreign-born population - Norway (%)
Place of birth for the foreign-born population - Sweden (%)
Place of birth for the foreign-born population - United Kingdom (%)
Place of birth for the foreign-born population - England (%)
Place of birth for the foreign-born population - Scotland (%)
Place of birth for the foreign-born population - Other Northern Europe (%)
Place of birth for the foreign-born population - Austria (%)
Place of birth for the foreign-born population - Belgium (%)
Place of birth for the foreign-born population - France (%)
Place of birth for the foreign-born population - Germany (%)
Place of birth for the foreign-born population - Netherlands (%)
Place of birth for the foreign-born population - Switzerland (%)
Place of birth for the foreign-born population - Other Western Europe (%)
Place of birth for the foreign-born population - Greece (%)
Place of birth for the foreign-born population - Italy (%)
Place of birth for the foreign-born population - Portugal (%)
Place of birth for the foreign-born population - Spain (%)
Place of birth for the foreign-born population - Other Southern Europe (%)
Place of birth for the foreign-born population - Albania (%)
Place of birth for the foreign-born population - Belarus (%)
Place of birth for the foreign-born population - Bosnia and Herzegovina (%)
Place of birth for the foreign-born population - Bulgaria (%)
Place of birth for the foreign-born population - Croatia (%)
Place of birth for the foreign-born population - Czechoslovakia (%)
Place of birth for the foreign-born population - Hungary (%)
Place of birth for the foreign-born population - Latvia (%)
Place of birth for the foreign-born population - Lithuania (%)
Place of birth for the foreign-born population - North Macedonia (Macedonia) (%)
Place of birth for the foreign-born population - Moldova (%)
Place of birth for the foreign-born population - Poland (%)
Place of birth for the foreign-born population - Romania (%)
Place of birth for the foreign-born population - Russia (%)
Place of birth for the foreign-born population - Serbia (%)
Place of birth for the foreign-born population - Ukraine (%)
Place of birth for the foreign-born population - Other Eastern Europe (%)
Place of birth for the foreign-born population - China (%)
Place of birth for the foreign-born population - Hong Kong (%)
Place of birth for the foreign-born population - Taiwan (%)
Place of birth for the foreign-born population - Japan (%)
Place of birth for the foreign-born population - Korea (%)
Place of birth for the foreign-born population - Other Eastern Asia (%)
Place of birth for the foreign-born population - Afghanistan (%)
Place of birth for the foreign-born population - Bangladesh (%)
Place of birth for the foreign-born population - India (%)
Place of birth for the foreign-born population - Iran (%)
Place of birth for the foreign-born population - Kazakhstan (%)
Place of birth for the foreign-born population - Nepal (%)
Place of birth for the foreign-born population - Pakistan (%)
Place of birth for the foreign-born population - Sri Lanka (%)
Place of birth for the foreign-born population - Uzbekistan (%)
Place of birth for the foreign-born population - Other South Central Asia (%)
Place of birth for the foreign-born population - Burma (%)
Place of birth for the foreign-born population - Cambodia (%)
Place of birth for the foreign-born population - Indonesia (%)
Place of birth for the foreign-born population - Laos (%)
Place of birth for the foreign-born population - Malaysia (%)
Place of birth for the foreign-born population - Philippines (%)
Place of birth for the foreign-born population - Singapore (%)
Place of birth for the foreign-born population - Thailand (%)
Place of birth for the foreign-born population - Vietnam (%)
Place of birth for the foreign-born population - Other South Eastern Asia (%)
Place of birth for the foreign-born population - Armenia (%)
Place of birth for the foreign-born population - Iraq (%)
Place of birth for the foreign-born population - Israel (%)
Place of birth for the foreign-born population - Jordan (%)
Place of birth for the foreign-born population - Kuwait (%)
Place of birth for the foreign-born population - Lebanon (%)
Place of birth for the foreign-born population - Saudi Arabia (%)
Place of birth for the foreign-born population - Syria (%)
Place of birth for the foreign-born population - Turkey (%)
Place of birth for the foreign-born population - Yemen (%)
Place of birth for the foreign-born population - Other Western Asia (%)
Place of birth for the foreign-born population - Eritrea (%)
Place of birth for the foreign-born population - Ethiopia (%)
Place of birth for the foreign-born population - Kenya (%)
Place of birth for the foreign-born population - Somalia (%)
Place of birth for the foreign-born population - Uganda (%)
Place of birth for the foreign-born population - Zimbabwe (%)
Place of birth for the foreign-born population - Other Eastern Africa (%)
Place of birth for the foreign-born population - Cameroon (%)
Place of birth for the foreign-born population - Congo (%)
Place of birth for the foreign-born population - Democratic Republic of Congo (Zaire) (%)
Place of birth for the foreign-born population - Other Middle Africa (%)
Place of birth for the foreign-born population - Egypt (%)
Place of birth for the foreign-born population - Morocco (%)
Place of birth for the foreign-born population - Sudan (%)
Place of birth for the foreign-born population - Other Northern Africa (%)
Place of birth for the foreign-born population - South Africa (%)
Place of birth for the foreign-born population - Other Southern Africa (%)
Place of birth for the foreign-born population - Cabo Verde (%)
Place of birth for the foreign-born population - Ghana (%)
Place of birth for the foreign-born population - Liberia (%)
Place of birth for the foreign-born population - Nigeria (%)
Place of birth for the foreign-born population - Senegal (%)
Place of birth for the foreign-born population - Sierra Leone (%)
Place of birth for the foreign-born population - Other Western Africa (%)
Place of birth for the foreign-born population - Australia (%)
Place of birth for the foreign-born population - New Zealand (%)
Place of birth for the foreign-born population - Fiji (%)
Place of birth for the foreign-born population - Micronesia (%)
Place of birth for the foreign-born population - Bahamas (%)
Place of birth for the foreign-born population - Barbados (%)
Place of birth for the foreign-born population - Cuba (%)
Place of birth for the foreign-born population - Dominica (%)
Place of birth for the foreign-born population - Dominican Republic (%)
Place of birth for the foreign-born population - Grenada (%)
Place of birth for the foreign-born population - Haiti (%)
Place of birth for the foreign-born population - Jamaica (%)
Place of birth for the foreign-born population - St. Vincent and the Grenadines (%)
Place of birth for the foreign-born population - Trinidad and Tobago (%)
Place of birth for the foreign-born population - West Indies (%)
Place of birth for the foreign-born population - Other Caribbean (%)
Place of birth for the foreign-born population - Belize (%)
Place of birth for the foreign-born population - Costa Rica (%)
Place of birth for the foreign-born population - El Salvador (%)
Place of birth for the foreign-born population - Guatemala (%)
Place of birth for the foreign-born population - Honduras (%)
Place of birth for the foreign-born population - Mexico (%)
Place of birth for the foreign-born population - Nicaragua (%)
Place of birth for the foreign-born population - Panama (%)
Place of birth for the foreign-born population - Other Central America (%)
Place of birth for the foreign-born population - Argentina (%)
Place of birth for the foreign-born population - Bolivia (%)
Place of birth for the foreign-born population - Brazil (%)
Place of birth for the foreign-born population - Chile (%)
Place of birth for the foreign-born population - Colombia (%)
Place of birth for the foreign-born population - Ecuador (%)
Place of birth for the foreign-born population - Guyana (%)
Place of birth for the foreign-born population - Peru (%)
Place of birth for the foreign-born population - Uruguay (%)
Place of birth for the foreign-born population - Venezuela (%)
Place of birth for the foreign-born population - Other South America (%)
Place of birth for the foreign-born population - Canada (%)
Place of birth for the foreign-born population - Other Northern America (%)
Place of birth for the foreign-born population - Other (%)
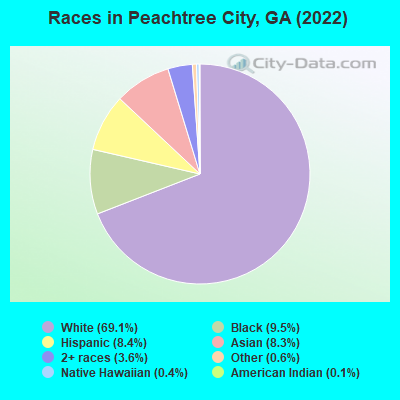
According to 2022 data, the most numerous races in Peachtree City, GA are White alone (27,168 residents), Black alone (3,727 residents), and Hispanic (3,292 residents). 84.3% of Peachtree City residents speak English at home. 15.4% of Peachtree City, GA residents are foreign-born (7.1% born in Asia, 3.3% born in Latin America, 2.8% born in Europe), which is 34.9% greater than the foreign-born rate of 10.0% across the entire state of Georgia.
Race distribution in Peachtree City
2000 2022
5,128,661 62.6% White alone 2,331,465 28.5% Black alone 435,227 5.3% Hispanic 171,513 2.1% Asian alone 87,364 1.1% Two or more races 17,670 0.2% American Indian alone 11,275 0.1% Other race alone 3,278 0.04% Native Hawaiian and Other
5,415,657 49.6% White alone 3,349,240 30.7% Black alone 1,132,604 10.4% Hispanic 479,156 4.4% Asian alone 462,923 4.2% Two or more races 54,416 0.5% Other race alone 11,923 0.1% American Indian alone 6,957 0.06% Native Hawaiian and Other
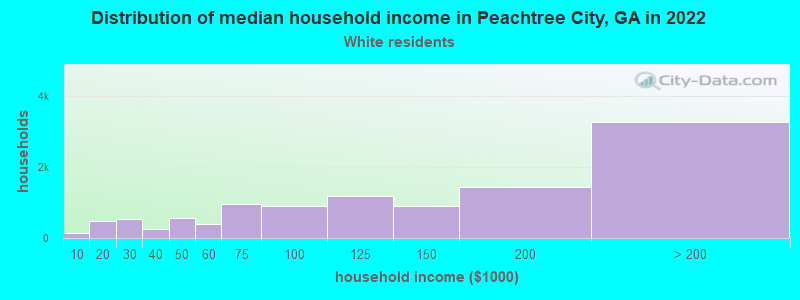
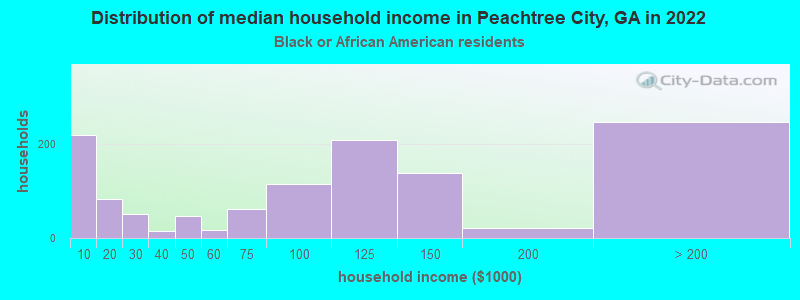
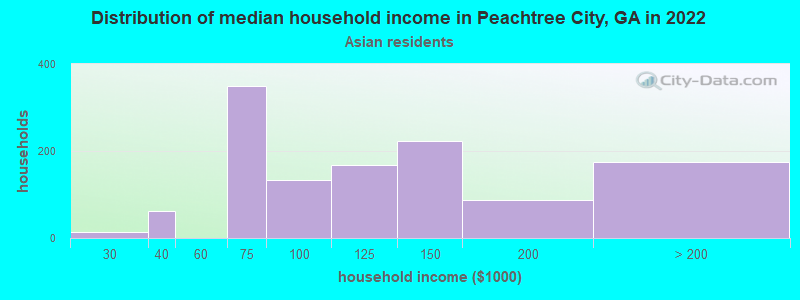
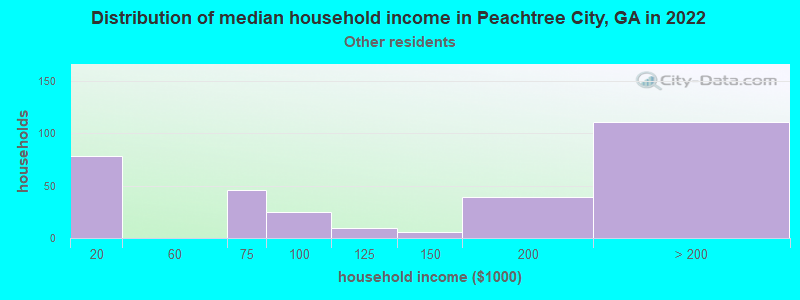
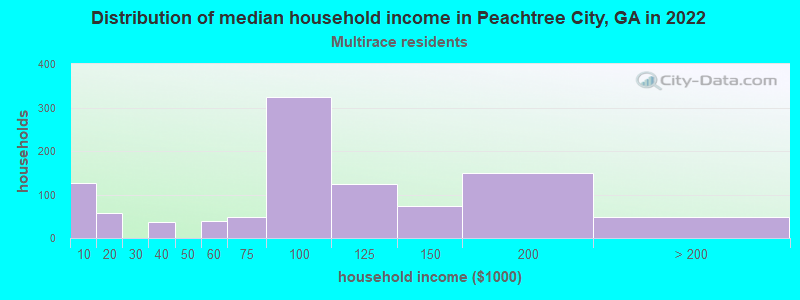
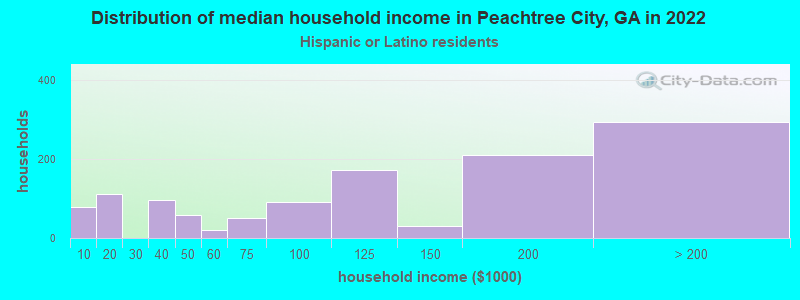
Income and house value in Peachtree City Median household income in 2022 $124,456 White non-Hispanic householders$101,672 Black householders$108,101 Asian householders$97,840 Two or more races householders$111,172 Hispanic or Latino race householdersMedian 2022 house value $513,388 White Non-Hispanic householders$458,869 Black or African American householders$601,313 American Indian or Alaska Native householders $471,697 Asian householders$471,162 Some other race householders$347,158 Two or more races householders$462,610 Hispanic or Latino householders
Median age by race in Peachtree City
46.2 Median age for White residents43.9 48.0 37.4 Median age for Black or African American residents29.8 42.8 36.8 Median age for American Indian / Alaska Native residents-597,222,221.6 33.1 40.6 Median age for Asian residents33.9 40.5 46.1 Median age for Native Hawaiian / Pacific Islander residents-666,666,666.0 -666,666,666.0 49.5 Median age for Other race residents54.4 59.4 36.8 Median age for Two or more races residents36.9 41.6 46.9 Median age for White alone residents44.5 48.6 36.7 Median age for Hispanic or Latino residents44.4 29.0
Owner/renter occupied households by race in Peachtree City
House owners and renters - White residents 8,884 80.7% Owner occupied2,119 19.3% Renter occupiedHouse owners and renters - Black or African American residents 430 29.0% Owner occupied1,054 71.0% Renter occupiedHouse owners and renters - American Indian / Alaska Native residents 13 100.0% Owner occupiedHouse owners and renters - Asian residents 1,063 75.5% Owner occupied345 24.5% Renter occupiedHouse owners and renters - Native Hawaiian / Pacific Islander residents 34 45.2% Owner occupied41 54.8% Renter occupiedHouse owners and renters - Other race residents 183 71.9% Owner occupied71 28.1% Renter occupiedHouse owners and renters - Two or more races residents 749 60.8% Owner occupied484 39.2% Renter occupiedHouse owners and renters - White alone residents 8,504 81.0% Owner occupied1,998 19.0% Renter occupiedHouse owners and renters - Hispanic or Latino residents 945 69.5% Owner occupied415 30.5% Renter occupied
Language usage in Peachtree City
English speakers - Total 84.3% of residents of Peachtree City speak English at home.
5.2% of residents speak Spanish at home 1,463 74.2% Speak English very well508 25.8% Speak English less than very well10.5% of residents speak other language at home 2,376 59.3% Speak English very well1,629 40.7% Speak English less than very well
English speakers - Born in the United States 96.7% of residents of Peachtree City speak English at home.
2.0% of residents speak Spanish at home 374 81.1% Speak English very well87 18.9% Speak English less than very well1.4% of residents speak other language at home 320 96.4% Speak English very well12 3.6% Speak English less than very well
English speakers - Native, born elsewhere 54.6% of residents of Peachtree City speak English at home.
31.4% of residents speak Spanish at home 159 59.6% Speak English very well108 40.4% Speak English less than very well14.5% of residents speak other language at home 123 100.0% Speak English very well
English speakers - Foreign-born 28.8% of residents of Peachtree City speak English at home.
18.3% of residents speak Spanish at home 803 71.9% Speak English very well314 28.1% Speak English less than very well53.4% of residents speak other language at home 1,637 50.3% Speak English very well1,618 49.7% Speak English less than very well
White (Caucasian) - Speak only English Native:
97.3% (25,099)Foreign-born:
51.2% (713)
White (Caucasian) - Speak another language Native:
2.4% (612)Foreign-born:
50.4% (703)
Black or African American - Speak only English Native:
98.3% (2,916)Foreign-born:
51.7% (221)
Black or African American - Speak another language Native:
1.6% (49)Foreign-born:
48.1% (206)
Asian - Speak only English Native:
29.0% (121)Foreign-born:
17.2% (473)
Asian - Speak another language Native:
71.7% (298)Foreign-born:
91.8% (2,519)
Other race - Speak another language Native:
75.5% (179)Foreign-born:
95.3% (167)
Two or more races - Speak only English Native:
72.1% (1,479)Foreign-born:
3.7% (53)
Two or more races - Speak another language Native:
28.3% (581)Foreign-born:
97.1% (1,387)
White alone - Speak only English Native:
98.7% (24,684)Foreign-born:
53.7% (716)
White alone - Speak another language Native:
1.0% (256)Foreign-born:
45.9% (612)
Hispanic or Latino - Speak only English Native:
56.5% (1,172)Foreign-born:
12.4% (129)
Hispanic or Latino - Speak another language Native:
45.4% (941)Foreign-born:
87.8% (917)
Foreign-born residents in Peachtree City 6,039 residents are foreign born (7.1% Asia , 3.3% Latin America , 2.8% Europe ).
This city:
15.4%Georgia:
10.4%
Marital status for residents in Peachtree City Marital status - White (Caucasian) population 15 years and over
Males 24.6% Never married65.7% Now married0.1% Separated2.6% Widowed7.0% DivorcedFemales 19.0% Never married62.0% Now married0.2% Separated9.3% Widowed9.6% DivorcedWomen who gave birth in the past 12 months Now married:
76.6% (126)Unmarried:
23.4% (39)
Women who did not give birth in the past 12 months Now married:
51.8% (2,606)Unmarried:
48.2% (2,422)
Marital status - Black or African American population 15 years and over
Males 34.1% Never married57.8% Now married6.3% Separated1.4% Widowed0.5% DivorcedFemales 26.7% Never married47.6% Now married0.5% Separated12.6% Widowed12.6% DivorcedWomen who gave birth in the past 12 months Now married:
63.9% (71)Unmarried:
36.1% (40)
Women who did not give birth in the past 12 months Now married:
41.5% (309)Unmarried:
58.5% (437)
Marital status - American Indian / Alaska Native population 15 years and over
Males 0.0% Never married0.0% Now married0.0% Separated0.0% Widowed100.0% DivorcedFemales 0.0% Never married19.4% Now married25.0% Separated0.0% Widowed55.6% DivorcedWomen who did not give birth in the past 12 months Now married:
0.0% (0)Unmarried:
100.0% (32)
Marital status - Asian population 15 years and over
Males 12.8% Never married85.9% Now married0.0% Separated0.0% Widowed1.2% DivorcedFemales 19.4% Never married74.4% Now married1.3% Separated3.5% Widowed1.3% DivorcedWomen who gave birth in the past 12 months Now married:
100.0% (48)Unmarried:
0.0% (0)
Women who did not give birth in the past 12 months Now married:
73.0% (682)Unmarried:
27.0% (253)
Marital status - Native Hawaiian / Pacific Islander population 15 years and over
Males 55.4% Never married44.6% Now married0.0% Separated0.0% Widowed0.0% DivorcedFemales 0.0% Never married0.0% Now married0.0% Separated39.3% Widowed60.7% DivorcedWomen who did not give birth in the past 12 months Now married:
0.0% (0)Unmarried:
100.0% (68)
Marital status - Other race population 15 years and over
Males 0.0% Never married83.9% Now married0.0% Separated0.0% Widowed16.1% DivorcedFemales 47.1% Never married30.0% Now married0.0% Separated22.9% Widowed0.0% DivorcedWomen who gave birth in the past 12 months Now married:
0.0% (0)Unmarried:
100.0% (56)
Women who did not give birth in the past 12 months Now married:
51.1% (121)Unmarried:
48.9% (115)
Marital status - Two or more races population 15 years and over
Males 36.4% Never married61.2% Now married0.0% Separated0.0% Widowed2.5% DivorcedFemales 47.0% Never married36.3% Now married0.0% Separated13.7% Widowed3.0% DivorcedWomen who did not give birth in the past 12 months Now married:
24.2% (252)Unmarried:
75.8% (789)
Marital status - White alone, not Hispanic / Latino population 15 years and over
Males 24.1% Never married65.7% Now married0.1% Separated2.8% Widowed7.3% DivorcedFemales 19.1% Never married61.7% Now married0.2% Separated9.5% Widowed9.5% DivorcedWomen who gave birth in the past 12 months Now married:
76.6% (130)Unmarried:
23.4% (40)
Women who did not give birth in the past 12 months Now married:
51.3% (2,523)Unmarried:
48.7% (2,393)
Marital status - Hispanic or Latino population 15 years and over
Males 26.4% Never married70.7% Now married0.0% Separated0.0% Widowed2.9% DivorcedFemales 38.0% Never married45.0% Now married0.0% Separated11.4% Widowed5.7% DivorcedWomen who gave birth in the past 12 months Now married:
0.0% (0)Unmarried:
100.0% (48)
Women who did not give birth in the past 12 months Now married:
44.2% (372)Unmarried:
55.8% (470)
Ancestries in Peachtree City
2,798 14.8% English1,435 7.6% American1,283 6.8% German1,223 6.5% Irish961 5.1% European563 3.0% Italian483 2.6% Albanian300 1.6% Nigerian265 1.4% Scottish260 1.4% Norwegian219 1.2% Dutch188 1.0% Polish164 0.9% Hungarian131 0.7% French128 0.7% British128 0.7% Northern European124 0.7% Swedish114 0.6% Scotch-Irish97 0.5% South African86 0.5% African79 0.4% Jamaican71 0.4% Scandinavian59 0.3% Czech55 0.3% Zimbabwean51 0.3% Eastern European44 0.2% Slovak29 0.2% Belgian28 0.1% Ukrainian28 0.1% Trinidadian and Tobagonian23 0.1% Greek18 0.10% Egyptian18 0.10% Iranian17 0.09% Welsh16 0.08% Russian16 0.08% French Canadian14 0.07% Danish13 0.07% Portuguese12 0.06% Canadian11 0.06% Cajun11 0.06% Austrian11 0.06% Latvian10 0.05% Romanian8 0.04% Brazilian5 0.03% Slavic
Geographical mobility in Peachtree City Same house 1 year ago 24,016 86.3% White (Caucasian)3,368 90.1% Black or African American63 85.8% American Indian / Alaska Native2,751 85.2% Asian206 100.0% Native Hawaiian / Pacific Islander735 96.4% Other race3,104 89.9% Two or more races23,257 86.4% White alone, not Hispanic / Latino2,775 87.6% Hispanic or LatinoMoved within same county 734 2.6% White / Caucasian43 1.1% Black or African American9 12.2% American Indian / Alaska Native156 4.8% Asian10 1.3% Other race142 4.1% Two or more races737 2.7% White alone, not Hispanic / Latino113 3.6% Hispanic or LatinoMoved within same state 1,319 4.7% White / Caucasian273 7.3% Black or African American101 3.1% Asian37 1.1% Two or more races1,195 4.4% White alone, not Hispanic / Latino145 4.6% Hispanic or LatinoMoved from different state 1,649 5.9% White / Caucasian44 1.2% Black or African American94 2.9% Asian13 1.7% Other race149 4.3% Two or more races1,551 5.8% White alone, not Hispanic / Latino135 4.3% Hispanic or LatinoMoved from abroad 40 0.1% White118 3.7% Asian48 0.2% White alone, not Hispanic / Latino
Children Nativity (place of birth) in Peachtree City
Children under 6 years - Living with two parents Both parents native 830 100.0% NativeBoth parents foreign-born 161 65.0% Native87 35.0% Foreign-bornOne native, one foreign-born parent 116 100.0% NativeChildren under 6 years - Living with one parent Native parent 218 100.0% NativeForeign-born parent 18 100.0% Foreign-bornChildren 6 to 17 years - Living with two parents Both parents native 3,902 100.0% NativeBoth parents foreign-born 421 34.2% Native811 65.8% Foreign-bornOne native, one foreign-born parent 1,036 98.9% Native11 1.1% Foreign-bornChildren 6 to 17 years - Living with one parent Native parent 1,466 100.0% NativeForeign-born parent 201 50.6% Native196 49.4% Foreign-born
Grandparents responsible for own grandchildren in Peachtree City
Grandparents (30 to 59 years) White / Caucasian 6 9.2% Responsible for grandchildren62 90.8% Not responsible for grandchildrenBlack or African American 22 100.0% Responsible for grandchildrenNative Hawaiian / Pacific Islander 23 100.0% Not responsible for grandchildrenOther race 31 100.0% Not responsible for grandchildrenTwo or more races 41 100.0% Responsible for grandchildrenWhite alone, not Hispanic / Latino 6 8.5% Responsible for grandchildren67 91.5% Not responsible for grandchildrenHispanic or Latino 22 50.1% Responsible for grandchildren22 49.9% Not responsible for grandchildrenGrandparents (60 years and over) White / Caucasian 63 27.3% Responsible for grandchildren168 72.7% Not responsible for grandchildrenBlack or African American 61 100.0% Not responsible for grandchildrenNative Hawaiian / Pacific Islander 39 100.0% Responsible for grandchildrenOther race 12 100.0% Not responsible for grandchildrenTwo or more races 18 100.0% Not responsible for grandchildrenWhite alone, not Hispanic / Latino 65 25.1% Responsible for grandchildren193 74.9% Not responsible for grandchildrenHispanic or Latino 18 100.0% Not responsible for grandchildren