Races in Pembroke, New Hampshire (NH) Detailed Stats
Ancestries, Foreign-born residents, place of birth

Recent posts about races in Pembroke, New Hampshire on our local forum with over 2,400,000 registered users:
 | What will be the biggest changes when moving to NH from MA? (44 replies) |
| Thinking of moving to New Hampshire from WA (40 replies) |
| Moving to the Manchester Area - Advice Please :) (13 replies) |
| Florida girl looking to relocate to NH! Advice PLEASE! (20 replies) |
| Possibility for 40-somethings in New Hampshire? (34 replies) |
| Possibly moving to Manchester or Bedford NH (3 replies) |
Latest news about races in Pembroke, NH collected exclusively by city-data.com from local newspapers, TV, and radio stations
0.9% of Pembroke, NH residents are foreign-born , which is 474.7% less than the foreign-born rate of 5.0% across the entire state of New Hampshire.
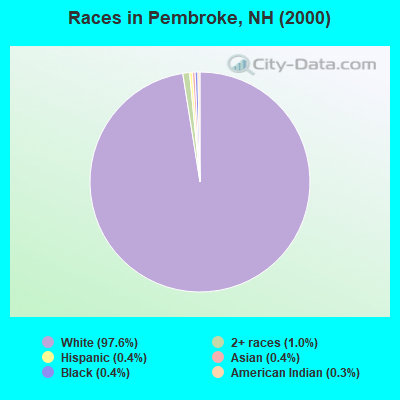
Race distribution in Pembroke

- 6,72997.6%White alone
- 681.0%Two or more races
- 300.4%Hispanic
- 260.4%Asian alone
- 250.4%Black alone
- 180.3%American Indian alone
- 10.01%Other race alone
2000
2022
-
- 1,175,25295.1%White alone
- 20,4891.7%Hispanic
- 15,8031.3%Asian alone
- 11,6060.9%Two or more races
- 8,3540.7%Black alone
- 2,6980.2%American Indian alone
- 1,2540.1%Other race alone
- 3300.03%Native Hawaiian and Other
Pacific Islander alone

-
- 1,208,10186.6%White alone
- 63,4794.5%Hispanic
- 60,7244.4%Two or more races
- 36,5192.6%Asian alone
- 17,9311.3%Black alone
- 6,6150.5%Other race alone
- 1,0140.07%American Indian alone
- 8480.06%Native Hawaiian and Other
Pacific Islander alone

Income and house value in Pembroke
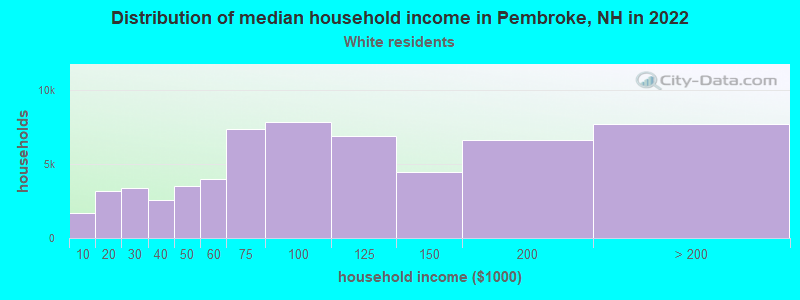
- Median household income in 2022
- $86,675White non-Hispanic householders
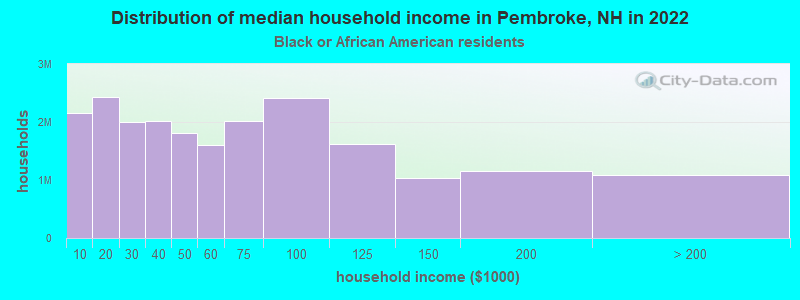
- $66,846Black householders
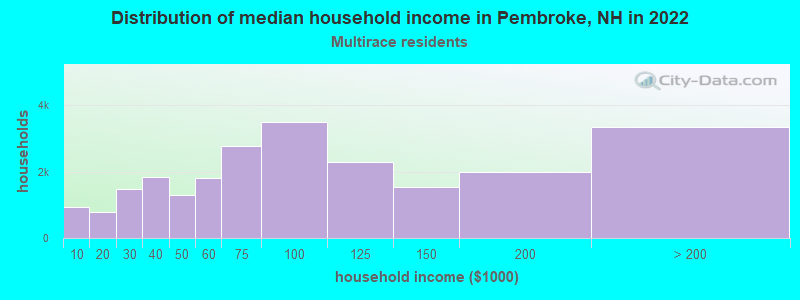
- $137,746Two or more races householders
- Median 2022 house value
- $353,002White Non-Hispanic householders
- $317,326Black or African American householders
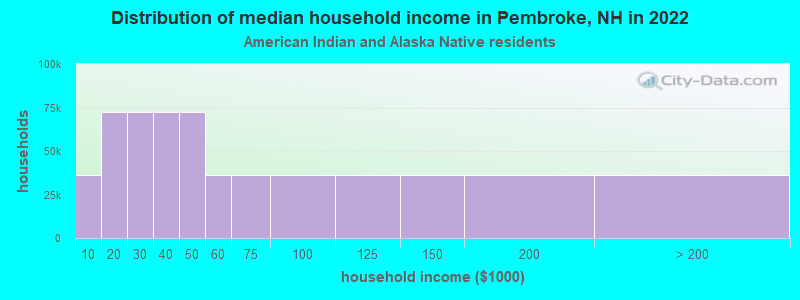
- $234,708American Indian or Alaska Native householders
Household income for White non-Hispanic householders
Household income for Black householders
Household income for American Indian and Alaska Native householders
Household income for Two or more races householders
Foreign-born residents in Pembroke
60 residents are foreign born
| This city: | 0.9% |
| New Hampshire: | 4.4% |
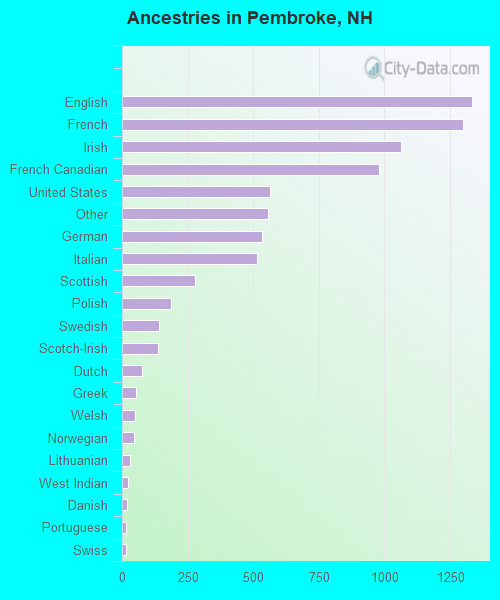
Ancestries in Pembroke

- 1,33216.8%English
- 1,29916.4%French
- 1,06213.4%Irish
- 97812.3%French Canadian
- 5647.1%United States
- 5587.0%Other
- 5356.7%German
- 5146.5%Italian
- 2773.5%Scottish
- 1872.4%Polish
- 1421.8%Swedish
- 1391.7%Scotch-Irish
- 761.0%Dutch
- 530.7%Greek
- 510.6%Welsh
- 470.6%Norwegian
- 290.4%Lithuanian
- 220.3%West Indian
- 180.2%Danish
- 160.2%Portuguese
- 160.2%Swiss
- 110.1%Russian
- 110.1%Ukrainian
- 60.08%Czech
Zip codes: 03275.