Races in Pinos Altos, New Mexico (NM) Detailed Stats
Ancestries, Foreign-born residents, place of birth

Data:
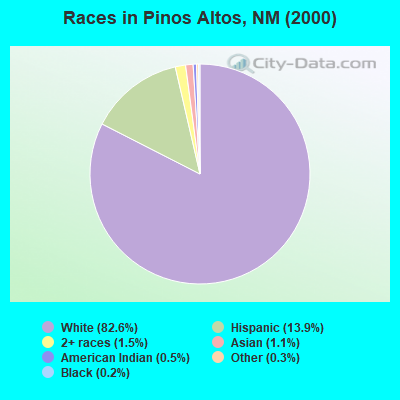
Race distribution in Pinos Altos

- 91282.6%White alone
- 15313.9%Hispanic
- 171.5%Two or more races
- 121.1%Asian alone
- 50.5%American Indian alone
- 30.3%Other race alone
- 20.2%Black alone
2000
2022
-
- 813,49544.7%White alone
- 765,38642.1%Hispanic
- 161,4608.9%American Indian alone
- 30,6541.7%Black alone
- 25,7931.4%Two or more races
- 18,2571.0%Asian alone
- 3,0090.2%Other race alone
- 9920.05%Native Hawaiian and Other
Pacific Islander alone
-
- 1,059,86750.2%Hispanic
- 735,47834.8%White alone
- 171,8088.1%American Indian alone
- 65,0843.1%Two or more races
- 36,8701.7%Black alone
- 35,8701.7%Asian alone
- 7,5820.4%Other race alone
- 7850.04%Native Hawaiian and Other
Pacific Islander alone
Income and house value in Pinos Altos
- Median household income in 2022
- $62,717White non-Hispanic householders
- $54,706Some other race householders
- $60,225Hispanic or Latino race householders
- Median 2022 house value
- $267,991White Non-Hispanic householders
- $340,755Some other race householders
- $244,715Hispanic or Latino householders