Races in Plainfield, Vermont (VT) Detailed Stats
Ancestries, Foreign-born residents, place of birth

Data:
Latest news about races in Plainfield, VT collected exclusively by city-data.com from local newspapers, TV, and radio stations
1.6% of Plainfield, VT residents are foreign-born , which is 145.0% less than the foreign-born rate of 4.0% across the entire state of Vermont.
Race distribution in Plainfield

- 1,22795.4%White alone
- 181.4%Hispanic
- 110.9%Two or more races
- 100.8%Black alone
- 100.8%American Indian alone
- 60.5%Asian alone
- 40.3%Other race alone
2000
2022
-
- 585,43196.2%White alone
- 6,8091.1%Two or more races
- 5,5040.9%Hispanic
- 5,1600.8%Asian alone
- 2,9210.5%Black alone
- 2,3250.4%American Indian alone
- 5570.09%Other race alone
- 1200.02%Native Hawaiian and Other
Pacific Islander alone
-
- 583,54690.2%White alone
- 27,3404.2%Two or more races
- 14,7702.3%Hispanic
- 11,5121.8%Asian alone
- 6,2641.0%Black alone
- 2,5210.4%Other race alone
- 1,0520.2%American Indian alone
- 590.01%Native Hawaiian and Other
Pacific Islander alone
Income and house value in Plainfield
- Median household income in 2022
- $69,463White non-Hispanic householders
- $26,002American Indian and Alaska Native householders
- $180,326Two or more races householders
- $109,384Hispanic or Latino race householders
- Median 2022 house value
- $280,222White Non-Hispanic householders
- $162,576Native Hawaiian and other Pacific Islander householders
- $221,694Two or more races householders
- $332,542Hispanic or Latino householders
Foreign-born residents in Plainfield
21 residents are foreign born
| This city: | 1.6% |
| Vermont: | 3.8% |
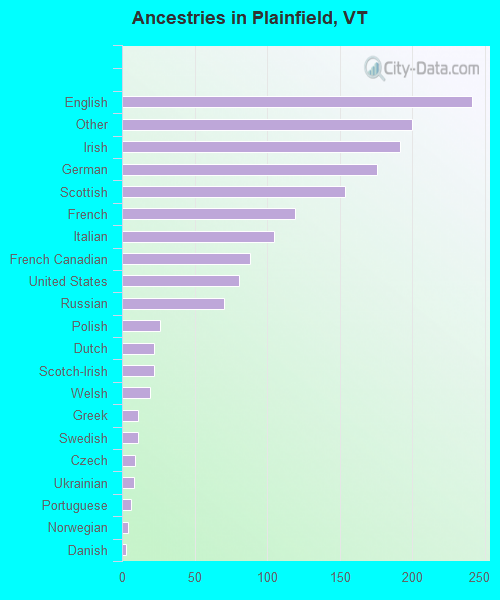
Ancestries in Plainfield

- 24115.3%English
- 20012.7%Other
- 19212.2%Irish
- 17611.2%German
- 1549.8%Scottish
- 1197.6%French
- 1056.7%Italian
- 885.6%French Canadian
- 815.1%United States
- 704.5%Russian
- 261.7%Polish
- 221.4%Dutch
- 221.4%Scotch-Irish
- 191.2%Welsh
- 110.7%Greek
- 110.7%Swedish
- 90.6%Czech
- 80.5%Ukrainian
- 60.4%Portuguese
- 40.3%Norwegian
- 30.2%Danish
- 20.1%Hungarian
- 20.1%Lithuanian
- 20.1%Swiss