Races in Pompano Beach, Florida (FL) Detailed Stats
Data:
Races - White alone (%)
Races - White alone (% change since 2000)
Races - Black alone (%)
Races - Black alone (% change since 2000)
Races - American Indian alone (%)
Races - American Indian alone (% change since 2000)
Races - Asian alone (%)
Races - Asian alone (% change since 2000)
Races - Hispanic (%)
Races - Hispanic (% change since 2000)
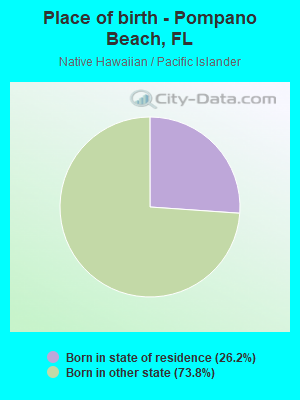
Races - Native Hawaiian and Other Pacific Islander alone (%)
Races - Native Hawaiian and Other Pacific Islander alone (% change since 2000)
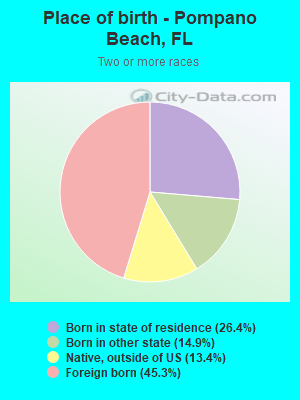
Races - Two or more races(%)
Races - Two or more races(% change since 2000)
Races - Other race alone (%)
Races - Other race alone (% change since 2000)
Racial diversity
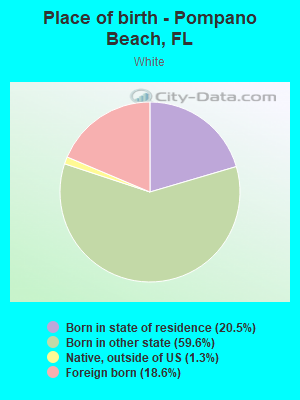
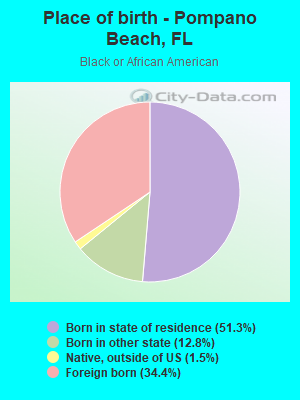
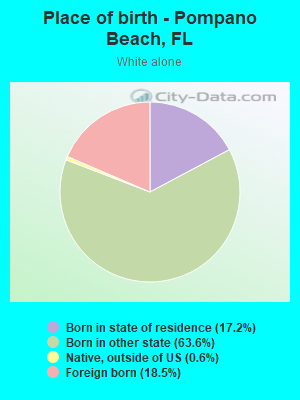
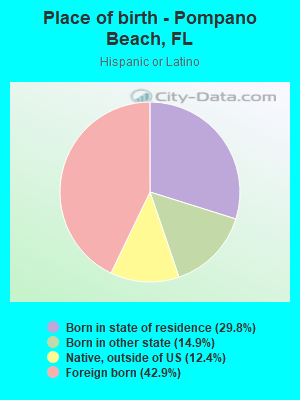
Place of birth - Born in state of residence (%)
Place of birth - Born in state of residence (%) - White
Place of birth - Born in state of residence (%) - Black or African American
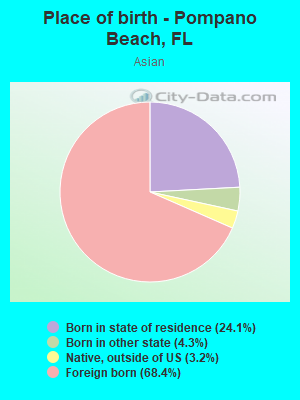
Place of birth - Born in state of residence (%) - Asian
Place of birth - Born in state of residence (%) - Hispanic or Latino
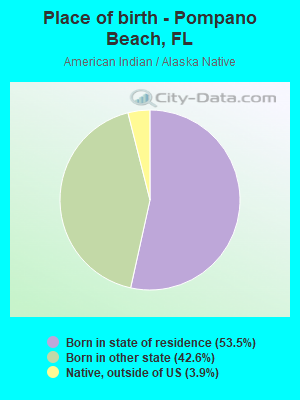
Place of birth - Born in state of residence (%) - American Indian and Alaska Native
Place of birth - Born in state of residence (%) - Multirace
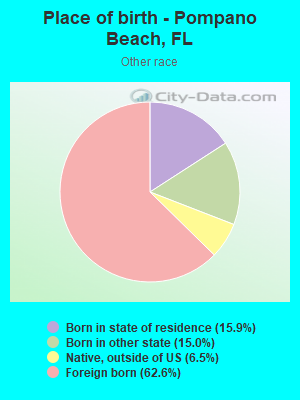
Place of birth - Born in state of residence (%) - Other Race
Place of birth - Born in other state (%)
Place of birth - Born in other state (%) - White
Place of birth - Born in other state (%) - Black or African American
Place of birth - Born in other state (%) - Asian
Place of birth - Born in other state (%) - Hispanic or Latino
Place of birth - Born in other state (%) - American Indian and Alaska Native
Place of birth - Born in other state (%) - Multirace
Place of birth - Born in other state (%) - Other Race
Place of birth - Native, outside of US (%)
Place of birth - Native, outside of US (%) - White
Place of birth - Native, outside of US (%) - Black or African American
Place of birth - Native, outside of US (%) - Asian
Place of birth - Native, outside of US (%) - Hispanic or Latino
Place of birth - Native, outside of US (%) - American Indian and Alaska Native
Place of birth - Native, outside of US (%) - Multirace
Place of birth - Native, outside of US (%) - Other Race
Place of birth - Foreign born (%)
Place of birth - Foreign born (%) - White
Place of birth - Foreign born (%) - Black or African American
Place of birth - Foreign born (%) - Asian
Place of birth - Foreign born (%) - Hispanic or Latino
Place of birth - Foreign born (%) - American Indian and Alaska Native
Place of birth - Foreign born (%) - Multirace
Place of birth - Foreign born (%) - Other Race
Residents speaking English at home (%)
Residents speaking English at home - Born in the United States (%)
Residents speaking English at home - Native, born elsewhere (%)
Residents speaking English at home - Foreign born (%)
Residents speaking Spanish at home (%)
Residents speaking Spanish at home - Born in the United States (%)
Residents speaking Spanish at home - Native, born elsewhere (%)
Residents speaking Spanish at home - Foreign born (%)
Residents speaking other language at home (%)
Residents speaking other language at home - Born in the United States (%)
Residents speaking other language at home - Native, born elsewhere (%)
Residents speaking other language at home - Foreign born (%)
Marital status - Never married (%)
Marital status - Now married (%)
Marital status - Separated (%)
Marital status - Widowed (%)
Marital status - Divorced (%)
Ancestries Reported - Arab (%)
Ancestries Reported - Czech (%)
Ancestries Reported - Danish (%)
Ancestries Reported - Dutch (%)
Ancestries Reported - English (%)
Ancestries Reported - French (%)
Ancestries Reported - French Canadian (%)
Ancestries Reported - German (%)
Ancestries Reported - Greek (%)
Ancestries Reported - Hungarian (%)
Ancestries Reported - Irish (%)
Ancestries Reported - Italian (%)
Ancestries Reported - Lithuanian (%)
Ancestries Reported - Norwegian (%)
Ancestries Reported - Polish (%)
Ancestries Reported - Portuguese (%)
Ancestries Reported - Russian (%)
Ancestries Reported - Scotch-Irish (%)
Ancestries Reported - Scottish (%)
Ancestries Reported - Slovak (%)
Ancestries Reported - Subsaharan African (%)
Ancestries Reported - Swedish (%)
Ancestries Reported - Swiss (%)
Ancestries Reported - Ukrainian (%)
Ancestries Reported - United States (%)
Ancestries Reported - Welsh (%)
Ancestries Reported - West Indian (%)
Ancestries Reported - Other (%)
Geographical mobility - Same house 1 year ago (%)
Geographical mobility - Same house 1 year ago (%) - White
Geographical mobility - Same house 1 year ago (%) - Black or African American
Geographical mobility - Same house 1 year ago (%) - Asian
Geographical mobility - Same house 1 year ago (%) - Hispanic or Latino
Geographical mobility - Same house 1 year ago (%) - American Indian and Alaska Native
Geographical mobility - Same house 1 year ago (%) - Multirace
Geographical mobility - Same house 1 year ago (%) - Other Race
Geographical mobility - Moved within same county (%)
Geographical mobility - Moved within same county (%) - White
Geographical mobility - Moved within same county (%) - Black or African American
Geographical mobility - Moved within same county (%) - Asian
Geographical mobility - Moved within same county (%) - Hispanic or Latino
Geographical mobility - Moved within same county (%) - American Indian and Alaska Native
Geographical mobility - Moved within same county (%) - Multirace
Geographical mobility - Moved within same county (%) - Other Race
Geographical mobility - Moved from different county within same state (%)
Geographical mobility - Moved from different county within same state (%) - White
Geographical mobility - Moved from different county within same state (%) - Black or African American
Geographical mobility - Moved from different county within same state (%) - Asian
Geographical mobility - Moved from different county within same state (%) - Hispanic or Latino
Geographical mobility - Moved from different county within same state (%) - American Indian and Alaska Native
Geographical mobility - Moved from different county within same state (%) - Multirace
Geographical mobility - Moved from different county within same state (%) - Other Race
Geographical mobility - Moved from different state (%)
Geographical mobility - Moved from different state (%) - White
Geographical mobility - Moved from different state (%) - Black or African American
Geographical mobility - Moved from different state (%) - Asian
Geographical mobility - Moved from different state (%) - Hispanic or Latino
Geographical mobility - Moved from different state (%) - American Indian and Alaska Native
Geographical mobility - Moved from different state (%) - Multirace
Geographical mobility - Moved from different state (%) - Other Race
Geographical mobility - Moved from abroad (%)
Geographical mobility - Moved from abroad (%) - White
Geographical mobility - Moved from abroad (%) - Black or African American
Geographical mobility - Moved from abroad (%) - Asian
Geographical mobility - Moved from abroad (%) - Hispanic or Latino
Geographical mobility - Moved from abroad (%) - American Indian and Alaska Native
Geographical mobility - Moved from abroad (%) - Multirace
Geographical mobility - Moved from abroad (%) - Other Race
Place of birth for the foreign-born population - Ireland (%)
Place of birth for the foreign-born population - Denmark (%)
Place of birth for the foreign-born population - Norway (%)
Place of birth for the foreign-born population - Sweden (%)
Place of birth for the foreign-born population - United Kingdom (%)
Place of birth for the foreign-born population - England (%)
Place of birth for the foreign-born population - Scotland (%)
Place of birth for the foreign-born population - Other Northern Europe (%)
Place of birth for the foreign-born population - Austria (%)
Place of birth for the foreign-born population - Belgium (%)
Place of birth for the foreign-born population - France (%)
Place of birth for the foreign-born population - Germany (%)
Place of birth for the foreign-born population - Netherlands (%)
Place of birth for the foreign-born population - Switzerland (%)
Place of birth for the foreign-born population - Other Western Europe (%)
Place of birth for the foreign-born population - Greece (%)
Place of birth for the foreign-born population - Italy (%)
Place of birth for the foreign-born population - Portugal (%)
Place of birth for the foreign-born population - Spain (%)
Place of birth for the foreign-born population - Other Southern Europe (%)
Place of birth for the foreign-born population - Albania (%)
Place of birth for the foreign-born population - Belarus (%)
Place of birth for the foreign-born population - Bosnia and Herzegovina (%)
Place of birth for the foreign-born population - Bulgaria (%)
Place of birth for the foreign-born population - Croatia (%)
Place of birth for the foreign-born population - Czechoslovakia (%)
Place of birth for the foreign-born population - Hungary (%)
Place of birth for the foreign-born population - Latvia (%)
Place of birth for the foreign-born population - Lithuania (%)
Place of birth for the foreign-born population - North Macedonia (Macedonia) (%)
Place of birth for the foreign-born population - Moldova (%)
Place of birth for the foreign-born population - Poland (%)
Place of birth for the foreign-born population - Romania (%)
Place of birth for the foreign-born population - Russia (%)
Place of birth for the foreign-born population - Serbia (%)
Place of birth for the foreign-born population - Ukraine (%)
Place of birth for the foreign-born population - Other Eastern Europe (%)
Place of birth for the foreign-born population - China (%)
Place of birth for the foreign-born population - Hong Kong (%)
Place of birth for the foreign-born population - Taiwan (%)
Place of birth for the foreign-born population - Japan (%)
Place of birth for the foreign-born population - Korea (%)
Place of birth for the foreign-born population - Other Eastern Asia (%)
Place of birth for the foreign-born population - Afghanistan (%)
Place of birth for the foreign-born population - Bangladesh (%)
Place of birth for the foreign-born population - India (%)
Place of birth for the foreign-born population - Iran (%)
Place of birth for the foreign-born population - Kazakhstan (%)
Place of birth for the foreign-born population - Nepal (%)
Place of birth for the foreign-born population - Pakistan (%)
Place of birth for the foreign-born population - Sri Lanka (%)
Place of birth for the foreign-born population - Uzbekistan (%)
Place of birth for the foreign-born population - Other South Central Asia (%)
Place of birth for the foreign-born population - Burma (%)
Place of birth for the foreign-born population - Cambodia (%)
Place of birth for the foreign-born population - Indonesia (%)
Place of birth for the foreign-born population - Laos (%)
Place of birth for the foreign-born population - Malaysia (%)
Place of birth for the foreign-born population - Philippines (%)
Place of birth for the foreign-born population - Singapore (%)
Place of birth for the foreign-born population - Thailand (%)
Place of birth for the foreign-born population - Vietnam (%)
Place of birth for the foreign-born population - Other South Eastern Asia (%)
Place of birth for the foreign-born population - Armenia (%)
Place of birth for the foreign-born population - Iraq (%)
Place of birth for the foreign-born population - Israel (%)
Place of birth for the foreign-born population - Jordan (%)
Place of birth for the foreign-born population - Kuwait (%)
Place of birth for the foreign-born population - Lebanon (%)
Place of birth for the foreign-born population - Saudi Arabia (%)
Place of birth for the foreign-born population - Syria (%)
Place of birth for the foreign-born population - Turkey (%)
Place of birth for the foreign-born population - Yemen (%)
Place of birth for the foreign-born population - Other Western Asia (%)
Place of birth for the foreign-born population - Eritrea (%)
Place of birth for the foreign-born population - Ethiopia (%)
Place of birth for the foreign-born population - Kenya (%)
Place of birth for the foreign-born population - Somalia (%)
Place of birth for the foreign-born population - Uganda (%)
Place of birth for the foreign-born population - Zimbabwe (%)
Place of birth for the foreign-born population - Other Eastern Africa (%)
Place of birth for the foreign-born population - Cameroon (%)
Place of birth for the foreign-born population - Congo (%)
Place of birth for the foreign-born population - Democratic Republic of Congo (Zaire) (%)
Place of birth for the foreign-born population - Other Middle Africa (%)
Place of birth for the foreign-born population - Egypt (%)
Place of birth for the foreign-born population - Morocco (%)
Place of birth for the foreign-born population - Sudan (%)
Place of birth for the foreign-born population - Other Northern Africa (%)
Place of birth for the foreign-born population - South Africa (%)
Place of birth for the foreign-born population - Other Southern Africa (%)
Place of birth for the foreign-born population - Cabo Verde (%)
Place of birth for the foreign-born population - Ghana (%)
Place of birth for the foreign-born population - Liberia (%)
Place of birth for the foreign-born population - Nigeria (%)
Place of birth for the foreign-born population - Senegal (%)
Place of birth for the foreign-born population - Sierra Leone (%)
Place of birth for the foreign-born population - Other Western Africa (%)
Place of birth for the foreign-born population - Australia (%)
Place of birth for the foreign-born population - New Zealand (%)
Place of birth for the foreign-born population - Fiji (%)
Place of birth for the foreign-born population - Micronesia (%)
Place of birth for the foreign-born population - Bahamas (%)
Place of birth for the foreign-born population - Barbados (%)
Place of birth for the foreign-born population - Cuba (%)
Place of birth for the foreign-born population - Dominica (%)
Place of birth for the foreign-born population - Dominican Republic (%)
Place of birth for the foreign-born population - Grenada (%)
Place of birth for the foreign-born population - Haiti (%)
Place of birth for the foreign-born population - Jamaica (%)
Place of birth for the foreign-born population - St. Vincent and the Grenadines (%)
Place of birth for the foreign-born population - Trinidad and Tobago (%)
Place of birth for the foreign-born population - West Indies (%)
Place of birth for the foreign-born population - Other Caribbean (%)
Place of birth for the foreign-born population - Belize (%)
Place of birth for the foreign-born population - Costa Rica (%)
Place of birth for the foreign-born population - El Salvador (%)
Place of birth for the foreign-born population - Guatemala (%)
Place of birth for the foreign-born population - Honduras (%)
Place of birth for the foreign-born population - Mexico (%)
Place of birth for the foreign-born population - Nicaragua (%)
Place of birth for the foreign-born population - Panama (%)
Place of birth for the foreign-born population - Other Central America (%)
Place of birth for the foreign-born population - Argentina (%)
Place of birth for the foreign-born population - Bolivia (%)
Place of birth for the foreign-born population - Brazil (%)
Place of birth for the foreign-born population - Chile (%)
Place of birth for the foreign-born population - Colombia (%)
Place of birth for the foreign-born population - Ecuador (%)
Place of birth for the foreign-born population - Guyana (%)
Place of birth for the foreign-born population - Peru (%)
Place of birth for the foreign-born population - Uruguay (%)
Place of birth for the foreign-born population - Venezuela (%)
Place of birth for the foreign-born population - Other South America (%)
Place of birth for the foreign-born population - Canada (%)
Place of birth for the foreign-born population - Other Northern America (%)
Place of birth for the foreign-born population - Other (%)
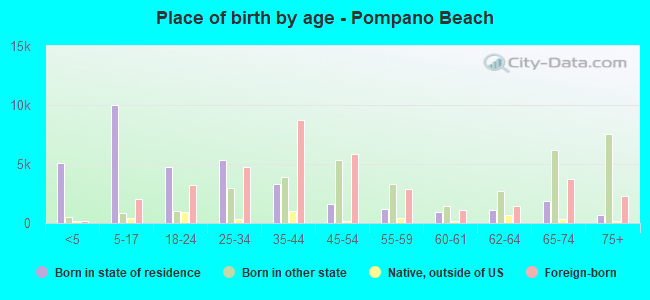
According to 2022 data, the most numerous races in Pompano Beach, FL are White alone (40,983 residents), Hispanic (28,543 residents), and Black alone (37,243 residents). 58.7% of Pompano Beach residents speak English at home. 33.5% of Pompano Beach, FL residents are foreign-born (25.0% born in Latin America), which is 37.4% greater than the foreign-born rate of 21.0% across the entire state of Florida.
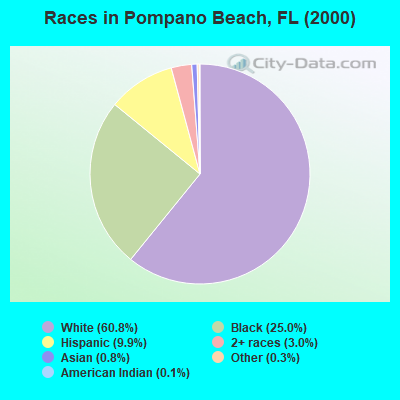
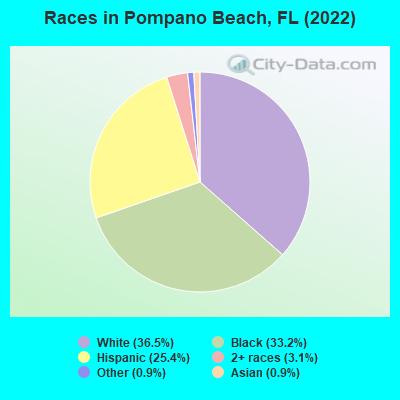
Race distribution in Pompano Beach
2000 2022
47,549 60.8% White alone 19,520 25.0% Black alone 7,770 9.9% Hispanic 2,370 3.0% Two or more races 621 0.8% Asian alone 237 0.3% Other race alone 111 0.1% American Indian alone 13 0.02% Native Hawaiian and Other
40,983 36.5% White alone 37,243 33.2% Black alone 28,543 25.4% Hispanic 3,488 3.1% Two or more races 1,012 0.9% Asian alone 1,039 0.9% Other race alone
2000 2022
10,458,509 65.4% White alone 2,682,715 16.8% Hispanic 2,264,268 14.2% Black alone 261,693 1.6% Asian alone 236,954 1.5% Two or more races 42,358 0.3% American Indian alone 28,994 0.2% Other race alone 6,887 0.04% Native Hawaiian and Other
11,309,403 50.8% White alone 6,025,039 27.1% Hispanic 3,241,015 14.6% Black alone 861,630 3.9% Two or more races 623,692 2.8% Asian alone 152,054 0.7% Other race alone 22,504 0.1% American Indian alone 9,486 0.04% Native Hawaiian and Other
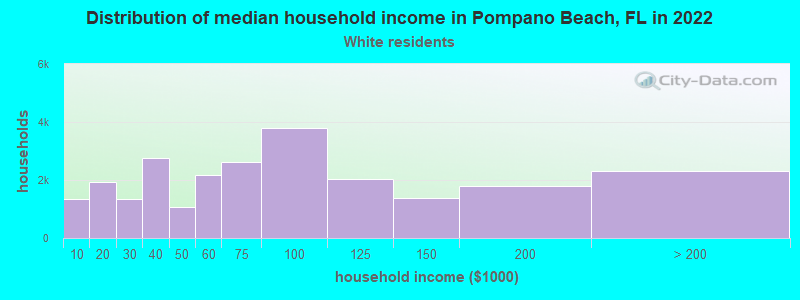
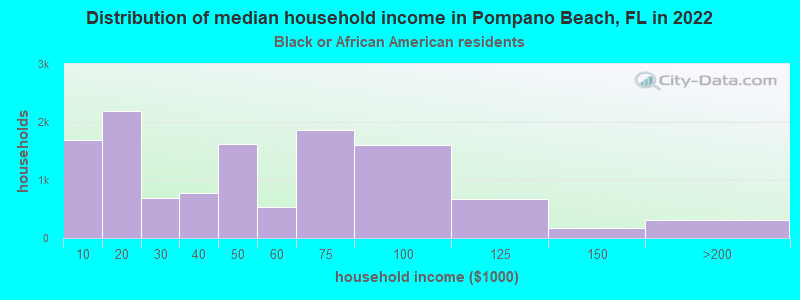
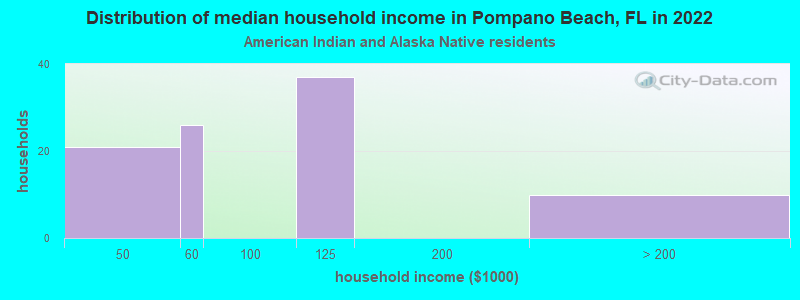
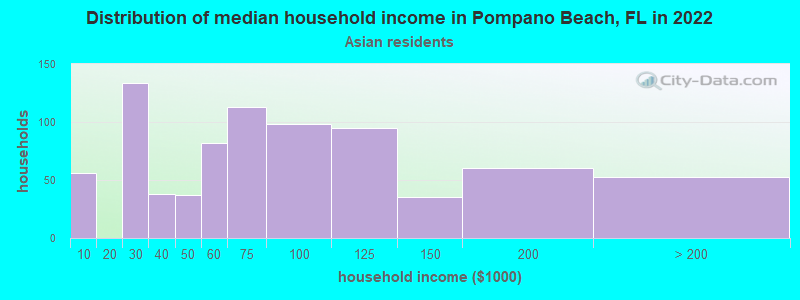
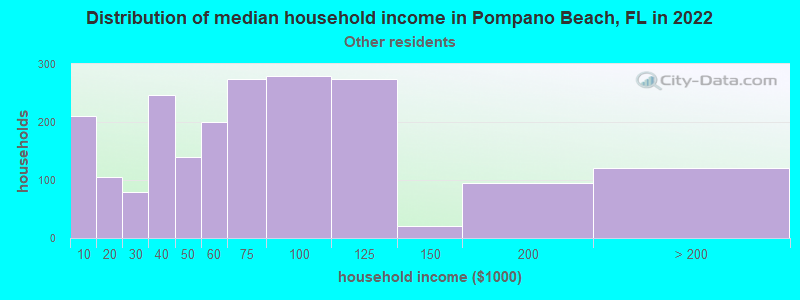
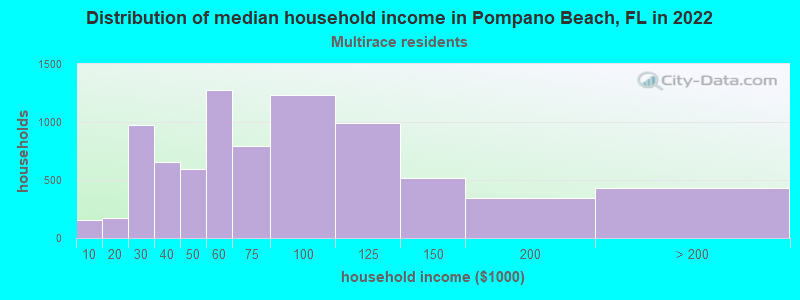
Income and house value in Pompano Beach Median household income in 2022 $71,711 White non-Hispanic householders$43,099 Black householders$50,020 Asian householders$71,033 Some other race householders$61,724 Two or more races householders$57,188 Hispanic or Latino race householdersMedian 2022 house value $618,446 White Non-Hispanic householders$265,820 Black or African American householders $342,180 Asian householders$367,754 Some other race householders$461,403 Two or more races householders$470,768 Hispanic or Latino householders
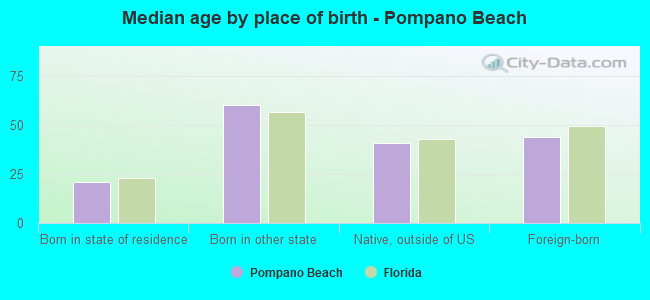
Median age by race in Pompano Beach
57.5 Median age for White residents58.6 55.9 36.2 Median age for Black or African American residents36.6 36.1 -666,666,666.0 Median age for American Indian / Alaska Native residents-666,666,666.0 -666,666,666.0 43.9 Median age for Asian residents43.3 64.2 -666,666,666.0 Median age for Native Hawaiian / Pacific Islander residents-666,666,666.0 -666,666,666.0 40.1 Median age for Other race residents31.7 51.2 35.8 Median age for Two or more races residents37.6 33.2 58.9 Median age for White alone residents60.0 58.1 35.0 Median age for Hispanic or Latino residents34.9 35.2
Owner/renter occupied households by race in Pompano Beach
House owners and renters - White residents 18,211 74.1% Owner occupied6,359 25.9% Renter occupiedHouse owners and renters - Black or African American residents 4,984 41.1% Owner occupied7,139 58.9% Renter occupiedHouse owners and renters - American Indian / Alaska Native residents 61 71.3% Owner occupied25 28.7% Renter occupiedHouse owners and renters - Asian residents 384 66.3% Owner occupied195 33.7% Renter occupiedHouse owners and renters - Other race residents 1,421 51.3% Owner occupied1,350 48.7% Renter occupiedHouse owners and renters - Two or more races residents 3,052 37.5% Owner occupied5,082 62.5% Renter occupiedHouse owners and renters - White alone residents 17,525 75.5% Owner occupied5,682 24.5% Renter occupiedHouse owners and renters - Hispanic or Latino residents 4,402 40.8% Owner occupied6,377 59.2% Renter occupied
Language usage in Pompano Beach
English speakers - Total 58.7% of residents of Pompano Beach speak English at home.
21.3% of residents speak Spanish at home 14,369 63.4% Speak English very well8,298 36.6% Speak English less than very well20.0% of residents speak other language at home 10,904 51.1% Speak English very well10,436 48.9% Speak English less than very well
English speakers - Born in the United States 90.4% of residents of Pompano Beach speak English at home.
7.1% of residents speak Spanish at home 2,346 94.5% Speak English very well137 5.5% Speak English less than very well2.5% of residents speak other language at home 875 100.0% Speak English very well
English speakers - Native, born elsewhere 16.0% of residents of Pompano Beach speak English at home.
72.9% of residents speak Spanish at home 2,513 76.2% Speak English very well785 23.8% Speak English less than very well11.0% of residents speak other language at home 152 30.5% Speak English very well347 69.5% Speak English less than very well
English speakers - Foreign-born 18.2% of residents of Pompano Beach speak English at home.
35.0% of residents speak Spanish at home 5,821 46.1% Speak English very well6,808 53.9% Speak English less than very well46.8% of residents speak other language at home 7,303 43.2% Speak English very well9,591 56.8% Speak English less than very well
White (Caucasian) - Speak only English Native:
91.2% (32,306)Foreign-born:
26.4% (2,183)
White (Caucasian) - Speak another language Native:
8.8% (3,113)Foreign-born:
73.6% (6,091)
Black or African American - Speak only English Native:
85.6% (19,002)Foreign-born:
26.2% (3,419)
Black or African American - Speak another language Native:
14.4% (3,205)Foreign-born:
73.8% (9,654)
Asian - Speak only English Native:
68.7% (200)Foreign-born:
22.3% (317)
Asian - Speak another language Native:
29.4% (85)Foreign-born:
77.6% (1,103)
Other race - Speak only English Native:
33.0% (758)Foreign-born:
2.0% (79)
Other race - Speak another language Native:
67.0% (1,536)Foreign-born:
98.0% (3,963)
Two or more races - Speak only English Native:
35.6% (3,664)Foreign-born:
8.2% (816)
Two or more races - Speak another language Native:
64.4% (6,630)Foreign-born:
91.8% (9,104)
White alone - Speak only English Native:
94.9% (31,004)Foreign-born:
26.5% (2,013)
White alone - Speak another language Native:
5.1% (1,679)Foreign-born:
73.5% (5,580)
Hispanic or Latino - Speak only English Native:
35.2% (5,104)Foreign-born:
5.3% (652)
Hispanic or Latino - Speak another language Native:
64.8% (9,396)Foreign-born:
94.7% (11,579)
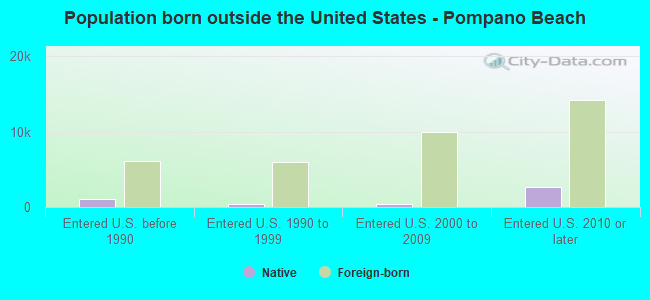
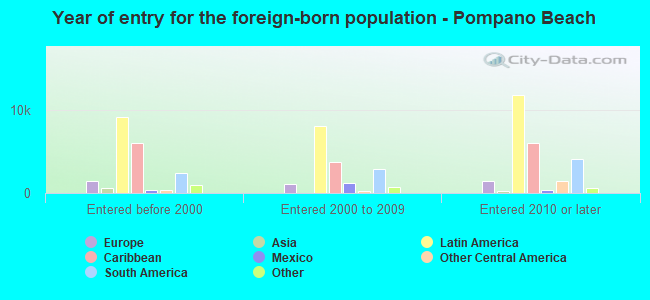
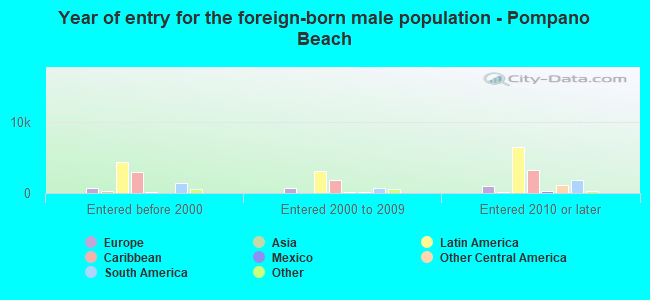
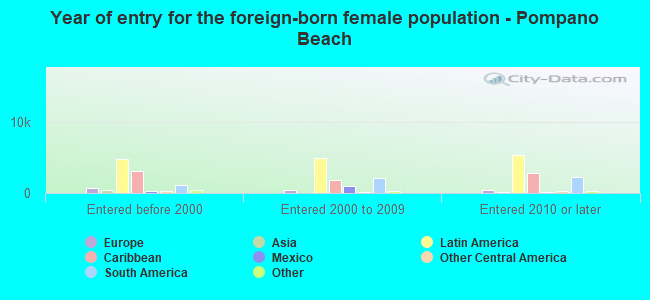
Foreign-born residents in Pompano Beach 37,623 residents are foreign born (25.0% Latin America ).
This city:
33.5%Florida:
21.1%
Marital status for residents in Pompano Beach Marital status - White (Caucasian) population 15 years and over
Males 30.5% Never married43.4% Now married2.7% Separated8.3% Widowed15.1% DivorcedFemales 22.9% Never married38.3% Now married0.6% Separated12.3% Widowed25.8% DivorcedWomen who gave birth in the past 12 months Now married:
93.4% (384)Unmarried:
6.6% (27)
Women who did not give birth in the past 12 months Now married:
26.6% (1,804)Unmarried:
73.4% (4,978)
Marital status - Black or African American population 15 years and over
Males 57.9% Never married34.6% Now married0.8% Separated0.0% Widowed6.7% DivorcedFemales 44.0% Never married25.0% Now married3.5% Separated12.6% Widowed15.0% DivorcedWomen who gave birth in the past 12 months Now married:
71.7% (764)Unmarried:
28.3% (302)
Women who did not give birth in the past 12 months Now married:
16.4% (1,379)Unmarried:
83.6% (7,018)
Marital status - American Indian / Alaska Native population 15 years and over
Males 83.0% Never married17.0% Now married0.0% Separated0.0% Widowed0.0% DivorcedFemales 61.5% Never married1.3% Now married0.0% Separated23.1% Widowed14.1% DivorcedWomen who did not give birth in the past 12 months Now married:
0.0% (0)Unmarried:
100.0% (36)
Marital status - Asian population 15 years and over
Males 33.6% Never married56.8% Now married4.8% Separated0.0% Widowed4.7% DivorcedFemales 16.6% Never married67.6% Now married1.1% Separated3.6% Widowed11.0% DivorcedWomen who gave birth in the past 12 months Now married:
92.3% (122)Unmarried:
7.7% (10)
Women who did not give birth in the past 12 months Now married:
70.9% (402)Unmarried:
29.1% (165)
Marital status - Native Hawaiian / Pacific Islander population 15 years and over
Males 100.0% Never married0.0% Now married0.0% Separated0.0% Widowed0.0% DivorcedFemales 0.0% Never married100.0% Now married0.0% Separated0.0% Widowed0.0% DivorcedWomen who did not give birth in the past 12 months Now married:
100.0% (12)Unmarried:
0.0% (0)
Marital status - Other race population 15 years and over
Males 50.7% Never married30.9% Now married2.9% Separated0.0% Widowed15.4% DivorcedFemales 40.9% Never married33.7% Now married6.0% Separated8.0% Widowed11.4% DivorcedWomen who did not give birth in the past 12 months Now married:
42.3% (579)Unmarried:
57.7% (789)
Marital status - Two or more races population 15 years and over
Males 42.9% Never married34.9% Now married6.0% Separated2.7% Widowed13.4% DivorcedFemales 37.2% Never married44.7% Now married6.8% Separated3.6% Widowed7.7% DivorcedWomen who gave birth in the past 12 months Now married:
56.4% (469)Unmarried:
43.6% (363)
Women who did not give birth in the past 12 months Now married:
51.6% (2,932)Unmarried:
48.4% (2,749)
Marital status - White alone, not Hispanic / Latino population 15 years and over
Males 29.0% Never married43.7% Now married2.8% Separated8.7% Widowed15.8% DivorcedFemales 18.0% Never married42.1% Now married0.7% Separated12.8% Widowed26.3% DivorcedWomen who gave birth in the past 12 months Now married:
93.4% (384)Unmarried:
6.6% (27)
Women who did not give birth in the past 12 months Now married:
34.6% (1,804)Unmarried:
65.4% (3,410)
Marital status - Hispanic or Latino population 15 years and over
Males 52.0% Never married29.7% Now married4.6% Separated2.1% Widowed11.6% DivorcedFemales 41.0% Never married34.6% Now married5.0% Separated6.5% Widowed13.0% DivorcedWomen who gave birth in the past 12 months Now married:
60.4% (416)Unmarried:
39.6% (273)
Women who did not give birth in the past 12 months Now married:
39.0% (2,993)Unmarried:
61.0% (4,673)
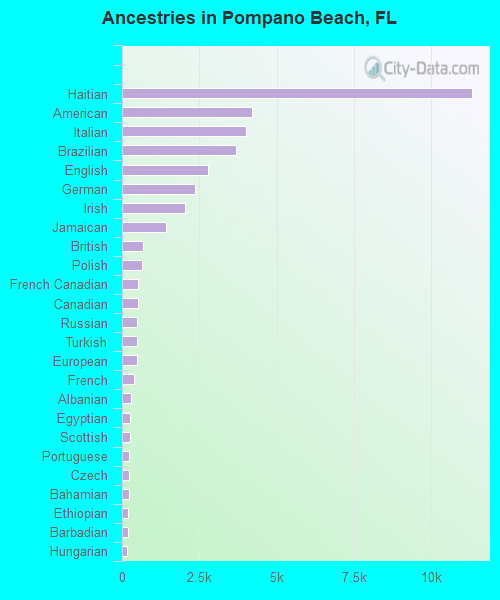
Ancestries in Pompano Beach
11,298 15.1% Haitian4,195 5.6% American4,021 5.4% Italian3,694 4.9% Brazilian2,767 3.7% English2,359 3.2% German2,037 2.7% Irish1,407 1.9% Jamaican687 0.9% British651 0.9% Polish533 0.7% French Canadian532 0.7% Canadian499 0.7% Russian484 0.6% Turkish483 0.6% European392 0.5% French287 0.4% Albanian262 0.4% Egyptian254 0.3% Scottish233 0.3% Portuguese222 0.3% Czech212 0.3% Bahamian192 0.3% Ethiopian188 0.3% Barbadian174 0.2% Hungarian165 0.2% African161 0.2% Scandinavian149 0.2% Norwegian143 0.2% Eastern European139 0.2% Swedish136 0.2% Romanian133 0.2% Ukrainian133 0.2% Lebanese131 0.2% Dutch114 0.2% West Indian114 0.2% Greek101 0.1% Slovak99 0.1% Bulgarian97 0.1% Lithuanian87 0.1% Scotch-Irish84 0.1% Moroccan81 0.1% Guyanese79 0.1% Trinidadian and Tobagonian78 0.1% U.S. Virgin Islander66 0.09% Macedonian59 0.08% Danish53 0.07% Austrian50 0.07% Northern European47 0.06% Croatian46 0.06% Welsh42 0.06% Iranian37 0.05% Cape Verdean33 0.04% Swiss32 0.04% Armenian30 0.04% Belgian27 0.04% Belizean25 0.03% Israeli25 0.03% Serbian20 0.03% Maltese17 0.02% Celtic16 0.02% South African13 0.02% Syrian13 0.02% Nigerian11 0.01% Czechoslovakian10 0.01% Cypriot10 0.01% British West Indian10 0.01% Finnish6 0.01% Pennsylvania German5 0.01% Australian
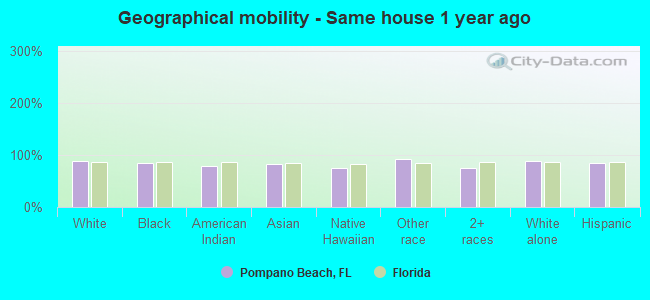
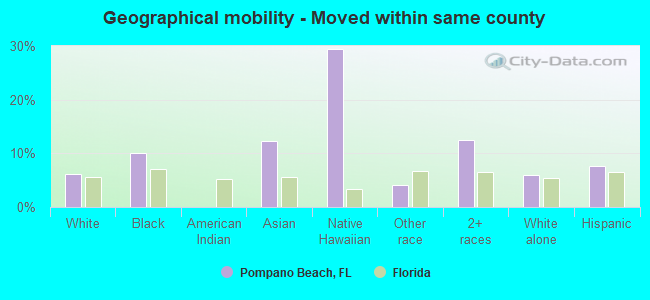
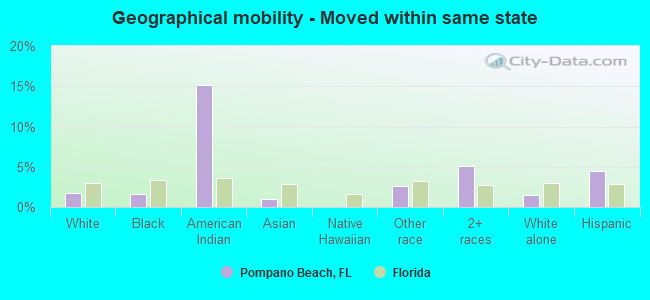
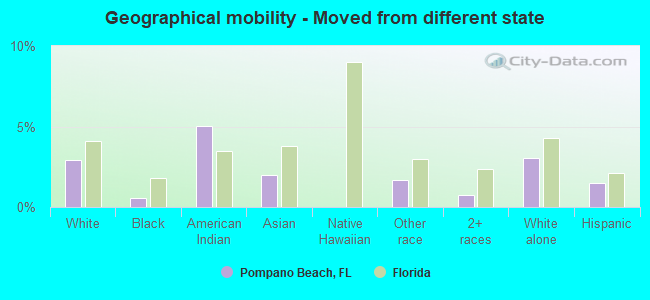
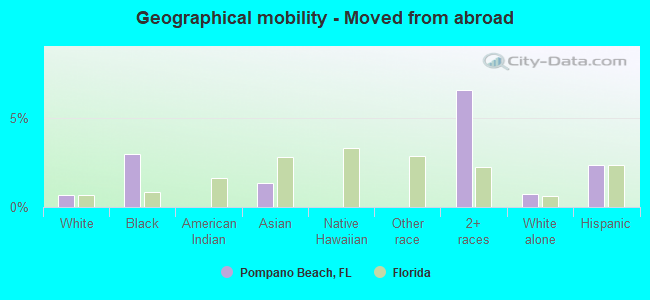
Geographical mobility in Pompano Beach Same house 1 year ago 39,065 88.5% White (Caucasian)32,335 84.9% Black or African American150 78.5% American Indian / Alaska Native1,489 82.4% Asian16 75.7% Native Hawaiian / Pacific Islander4,541 92.3% Other race16,024 75.2% Two or more races36,159 88.8% White alone, not Hispanic / Latino23,522 84.0% Hispanic or LatinoMoved within same county 2,700 6.1% White / Caucasian3,847 10.1% Black or African American224 12.4% Asian6 29.5% Native Hawaiian / Pacific Islander203 4.1% Other race2,648 12.4% Two or more races2,414 5.9% White alone, not Hispanic / Latino2,136 7.6% Hispanic or LatinoMoved within same state 768 1.7% White / Caucasian601 1.6% Black or African American29 15.1% American Indian / Alaska Native17 0.9% Asian127 2.6% Other race1,080 5.1% Two or more races600 1.5% White alone, not Hispanic / Latino1,269 4.5% Hispanic or LatinoMoved from different state 1,290 2.9% White / Caucasian202 0.5% Black or African American10 5.0% American Indian / Alaska Native36 2.0% Asian83 1.7% Other race163 0.8% Two or more races1,233 3.0% White alone, not Hispanic / Latino422 1.5% Hispanic or LatinoMoved from abroad 297 0.7% White1,120 2.9% Black or African American25 1.4% Asian1,398 6.6% Two or more races297 0.7% White alone, not Hispanic / Latino665 2.4% Hispanic or Latino
Children Nativity (place of birth) in Pompano Beach
Children under 6 years - Living with two parents Both parents native 1,122 100.0% NativeBoth parents foreign-born 1,534 90.1% Native168 9.9% Foreign-bornOne native, one foreign-born parent 888 100.0% NativeChildren under 6 years - Living with one parent Native parent 1,243 100.0% NativeForeign-born parent 1,721 94.1% Native107 5.9% Foreign-bornChildren 6 to 17 years - Living with two parents Both parents native 2,497 100.0% NativeBoth parents foreign-born 2,299 76.1% Native724 23.9% Foreign-bornOne native, one foreign-born parent 152 100.0% NativeChildren 6 to 17 years - Living with one parent Native parent 1,821 100.0% NativeForeign-born parent 2,719 64.6% Native1,492 35.4% Foreign-born
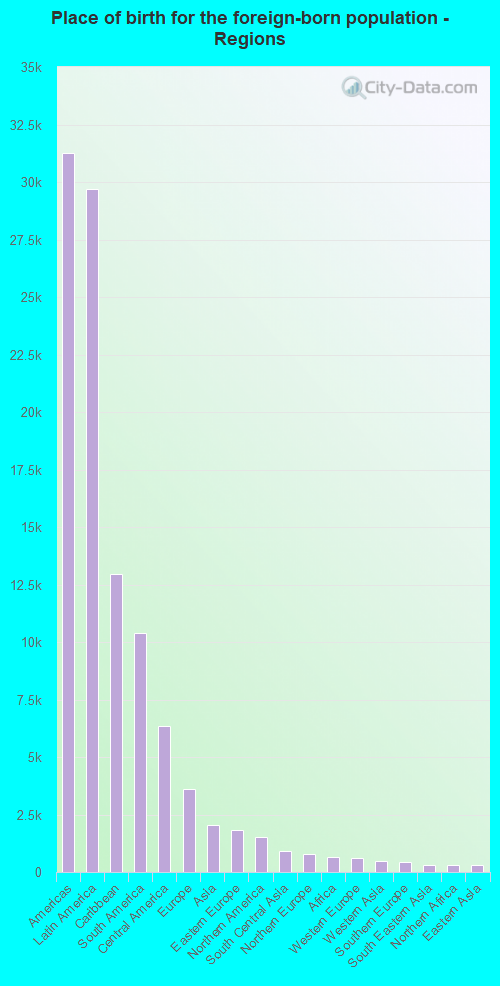
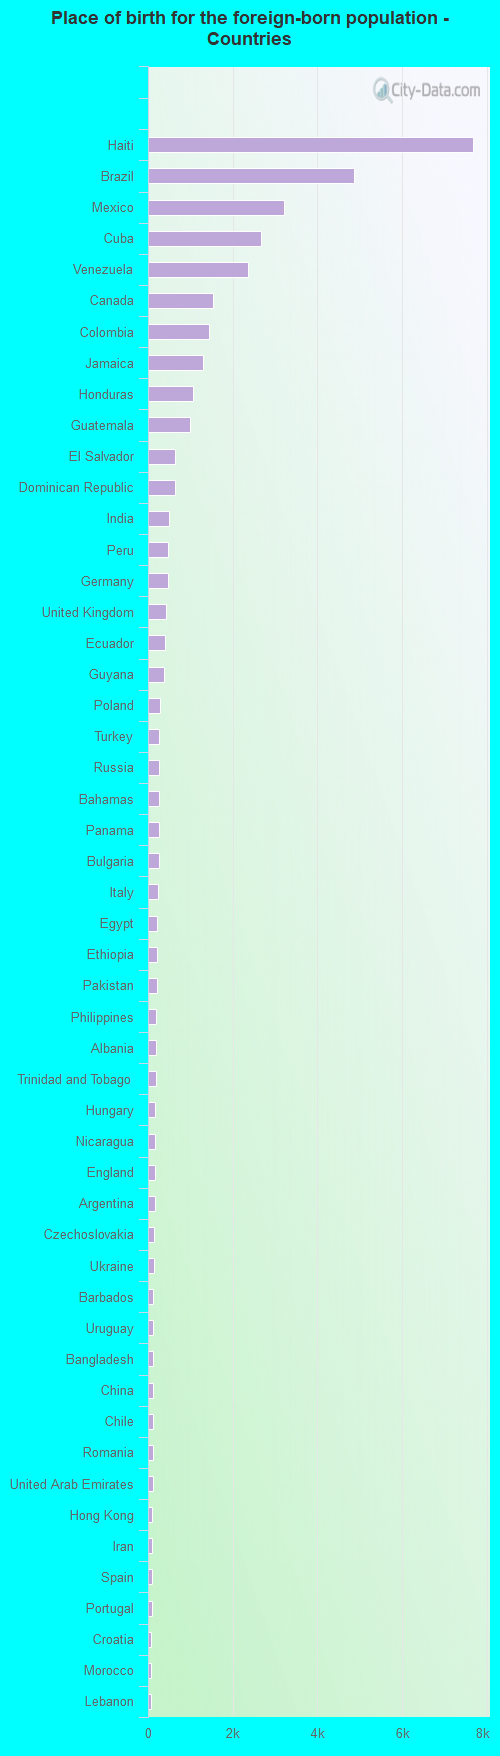
Place of birth for residents in Pompano Beach 31,244 Americas29,707 Latin America12,961 Caribbean10,381 South America6,365 Central America3,629 Europe2,031 Asia1,814 Eastern Europe1,536 Northern America921 South Central Asia788 Northern Europe657 Africa595 Western Europe499 Western Asia430 Southern Europe324 South Eastern Asia304 Northern Africa285 Eastern Asia221 China207 Eastern Africa60 Oceania45 Australia and New Zealand Subregion36 Southern Africa11 Western Africa7,666 Haiti4,868 Brazil3,220 Mexico2,674 Cuba2,349 Venezuela1,536 Canada1,445 Colombia1,292 Jamaica1,056 Honduras1,002 Guatemala633 El Salvador628 Dominican Republic505 India477 Peru466 Germany434 United Kingdom409 Ecuador366 Guyana282 Poland270 Turkey267 Russia254 Bahamas254 Panama253 Bulgaria242 Italy214 Egypt207 Ethiopia203 Pakistan198 Philippines193 Albania192 Trinidad and Tobago177 Hungary176 Nicaragua165 England163 Argentina149 Czechoslovakia130 Ukraine125 Barbados124 Uruguay123 Bangladesh114 China114 Chile109 Romania108 United Arab Emirates106 Hong Kong90 Iran89 Spain87 Portugal82 Croatia80 Morocco73 Lebanon69 West Indies68 France65 Vietnam63 Sweden60 Bolivia59 Ireland52 North Macedonia (Macedonia)46 Belarus41 Serbia37 Thailand36 South Africa35 Japan29 Korea27 New Zealand20 Netherlands19 Belgium19 Syria18 Australia17 Scotland17 Malaysia15 Austria13 Grenada12 Belize11 Nigeria11 Kuwait11 Denmark8 Norway8 Costa Rica8 Algeria6 St. Lucia6 Iraq5 Burma (Myanmar)
Grandparents responsible for own grandchildren in Pompano Beach
Grandparents (30 to 59 years) White / Caucasian 12 27.3% Responsible for grandchildren33 72.7% Not responsible for grandchildrenBlack or African American 152 51.5% Responsible for grandchildren143 48.5% Not responsible for grandchildrenAsian 51 100.0% Not responsible for grandchildrenOther race 3 100.0% Not responsible for grandchildrenTwo or more races 172 100.0% Not responsible for grandchildrenWhite alone, not Hispanic / Latino 23 100.0% Not responsible for grandchildrenHispanic or Latino 29 22.3% Responsible for grandchildren100 77.7% Not responsible for grandchildrenGrandparents (60 years and over) White / Caucasian 100 40.9% Responsible for grandchildren144 59.1% Not responsible for grandchildrenBlack or African American 214 50.9% Responsible for grandchildren207 49.1% Not responsible for grandchildrenAsian 34 100.0% Not responsible for grandchildrenOther race 68 100.0% Not responsible for grandchildrenTwo or more races 43 10.4% Responsible for grandchildren367 89.6% Not responsible for grandchildrenWhite alone, not Hispanic / Latino 93 41.0% Responsible for grandchildren133 59.0% Not responsible for grandchildrenHispanic or Latino 43 12.0% Responsible for grandchildren314 88.0% Not responsible for grandchildren