Races in Pompton Lakes, New Jersey (NJ) Detailed Stats
Data:
Races - White alone (%)
Races - White alone (% change since 2000)
Races - Black alone (%)
Races - Black alone (% change since 2000)
Races - American Indian alone (%)
Races - American Indian alone (% change since 2000)
Races - Asian alone (%)
Races - Asian alone (% change since 2000)
Races - Hispanic (%)
Races - Hispanic (% change since 2000)
Races - Native Hawaiian and Other Pacific Islander alone (%)
Races - Native Hawaiian and Other Pacific Islander alone (% change since 2000)
Races - Two or more races(%)
Races - Two or more races(% change since 2000)
Races - Other race alone (%)
Races - Other race alone (% change since 2000)
Racial diversity
Place of birth - Born in state of residence (%)
Place of birth - Born in state of residence (%) - White
Place of birth - Born in state of residence (%) - Black or African American
Place of birth - Born in state of residence (%) - Asian
Place of birth - Born in state of residence (%) - Hispanic or Latino
Place of birth - Born in state of residence (%) - American Indian and Alaska Native
Place of birth - Born in state of residence (%) - Multirace
Place of birth - Born in state of residence (%) - Other Race
Place of birth - Born in other state (%)
Place of birth - Born in other state (%) - White
Place of birth - Born in other state (%) - Black or African American
Place of birth - Born in other state (%) - Asian
Place of birth - Born in other state (%) - Hispanic or Latino
Place of birth - Born in other state (%) - American Indian and Alaska Native
Place of birth - Born in other state (%) - Multirace
Place of birth - Born in other state (%) - Other Race
Place of birth - Native, outside of US (%)
Place of birth - Native, outside of US (%) - White
Place of birth - Native, outside of US (%) - Black or African American
Place of birth - Native, outside of US (%) - Asian
Place of birth - Native, outside of US (%) - Hispanic or Latino
Place of birth - Native, outside of US (%) - American Indian and Alaska Native
Place of birth - Native, outside of US (%) - Multirace
Place of birth - Native, outside of US (%) - Other Race
Place of birth - Foreign born (%)
Place of birth - Foreign born (%) - White
Place of birth - Foreign born (%) - Black or African American
Place of birth - Foreign born (%) - Asian
Place of birth - Foreign born (%) - Hispanic or Latino
Place of birth - Foreign born (%) - American Indian and Alaska Native
Place of birth - Foreign born (%) - Multirace
Place of birth - Foreign born (%) - Other Race
Residents speaking English at home (%)
Residents speaking English at home - Born in the United States (%)
Residents speaking English at home - Native, born elsewhere (%)
Residents speaking English at home - Foreign born (%)
Residents speaking Spanish at home (%)
Residents speaking Spanish at home - Born in the United States (%)
Residents speaking Spanish at home - Native, born elsewhere (%)
Residents speaking Spanish at home - Foreign born (%)
Residents speaking other language at home (%)
Residents speaking other language at home - Born in the United States (%)
Residents speaking other language at home - Native, born elsewhere (%)
Residents speaking other language at home - Foreign born (%)
Marital status - Never married (%)
Marital status - Now married (%)
Marital status - Separated (%)
Marital status - Widowed (%)
Marital status - Divorced (%)
Ancestries Reported - Arab (%)
Ancestries Reported - Czech (%)
Ancestries Reported - Danish (%)
Ancestries Reported - Dutch (%)
Ancestries Reported - English (%)
Ancestries Reported - French (%)
Ancestries Reported - French Canadian (%)
Ancestries Reported - German (%)
Ancestries Reported - Greek (%)
Ancestries Reported - Hungarian (%)
Ancestries Reported - Irish (%)
Ancestries Reported - Italian (%)
Ancestries Reported - Lithuanian (%)
Ancestries Reported - Norwegian (%)
Ancestries Reported - Polish (%)
Ancestries Reported - Portuguese (%)
Ancestries Reported - Russian (%)
Ancestries Reported - Scotch-Irish (%)
Ancestries Reported - Scottish (%)
Ancestries Reported - Slovak (%)
Ancestries Reported - Subsaharan African (%)
Ancestries Reported - Swedish (%)
Ancestries Reported - Swiss (%)
Ancestries Reported - Ukrainian (%)
Ancestries Reported - United States (%)
Ancestries Reported - Welsh (%)
Ancestries Reported - West Indian (%)
Ancestries Reported - Other (%)
Geographical mobility - Same house 1 year ago (%)
Geographical mobility - Same house 1 year ago (%) - White
Geographical mobility - Same house 1 year ago (%) - Black or African American
Geographical mobility - Same house 1 year ago (%) - Asian
Geographical mobility - Same house 1 year ago (%) - Hispanic or Latino
Geographical mobility - Same house 1 year ago (%) - American Indian and Alaska Native
Geographical mobility - Same house 1 year ago (%) - Multirace
Geographical mobility - Same house 1 year ago (%) - Other Race
Geographical mobility - Moved within same county (%)
Geographical mobility - Moved within same county (%) - White
Geographical mobility - Moved within same county (%) - Black or African American
Geographical mobility - Moved within same county (%) - Asian
Geographical mobility - Moved within same county (%) - Hispanic or Latino
Geographical mobility - Moved within same county (%) - American Indian and Alaska Native
Geographical mobility - Moved within same county (%) - Multirace
Geographical mobility - Moved within same county (%) - Other Race
Geographical mobility - Moved from different county within same state (%)
Geographical mobility - Moved from different county within same state (%) - White
Geographical mobility - Moved from different county within same state (%) - Black or African American
Geographical mobility - Moved from different county within same state (%) - Asian
Geographical mobility - Moved from different county within same state (%) - Hispanic or Latino
Geographical mobility - Moved from different county within same state (%) - American Indian and Alaska Native
Geographical mobility - Moved from different county within same state (%) - Multirace
Geographical mobility - Moved from different county within same state (%) - Other Race
Geographical mobility - Moved from different state (%)
Geographical mobility - Moved from different state (%) - White
Geographical mobility - Moved from different state (%) - Black or African American
Geographical mobility - Moved from different state (%) - Asian
Geographical mobility - Moved from different state (%) - Hispanic or Latino
Geographical mobility - Moved from different state (%) - American Indian and Alaska Native
Geographical mobility - Moved from different state (%) - Multirace
Geographical mobility - Moved from different state (%) - Other Race
Geographical mobility - Moved from abroad (%)
Geographical mobility - Moved from abroad (%) - White
Geographical mobility - Moved from abroad (%) - Black or African American
Geographical mobility - Moved from abroad (%) - Asian
Geographical mobility - Moved from abroad (%) - Hispanic or Latino
Geographical mobility - Moved from abroad (%) - American Indian and Alaska Native
Geographical mobility - Moved from abroad (%) - Multirace
Geographical mobility - Moved from abroad (%) - Other Race
Place of birth for the foreign-born population - Ireland (%)
Place of birth for the foreign-born population - Denmark (%)
Place of birth for the foreign-born population - Norway (%)
Place of birth for the foreign-born population - Sweden (%)
Place of birth for the foreign-born population - United Kingdom (%)
Place of birth for the foreign-born population - England (%)
Place of birth for the foreign-born population - Scotland (%)
Place of birth for the foreign-born population - Other Northern Europe (%)
Place of birth for the foreign-born population - Austria (%)
Place of birth for the foreign-born population - Belgium (%)
Place of birth for the foreign-born population - France (%)
Place of birth for the foreign-born population - Germany (%)
Place of birth for the foreign-born population - Netherlands (%)
Place of birth for the foreign-born population - Switzerland (%)
Place of birth for the foreign-born population - Other Western Europe (%)
Place of birth for the foreign-born population - Greece (%)
Place of birth for the foreign-born population - Italy (%)
Place of birth for the foreign-born population - Portugal (%)
Place of birth for the foreign-born population - Spain (%)
Place of birth for the foreign-born population - Other Southern Europe (%)
Place of birth for the foreign-born population - Albania (%)
Place of birth for the foreign-born population - Belarus (%)
Place of birth for the foreign-born population - Bosnia and Herzegovina (%)
Place of birth for the foreign-born population - Bulgaria (%)
Place of birth for the foreign-born population - Croatia (%)
Place of birth for the foreign-born population - Czechoslovakia (%)
Place of birth for the foreign-born population - Hungary (%)
Place of birth for the foreign-born population - Latvia (%)
Place of birth for the foreign-born population - Lithuania (%)
Place of birth for the foreign-born population - North Macedonia (Macedonia) (%)
Place of birth for the foreign-born population - Moldova (%)
Place of birth for the foreign-born population - Poland (%)
Place of birth for the foreign-born population - Romania (%)
Place of birth for the foreign-born population - Russia (%)
Place of birth for the foreign-born population - Serbia (%)
Place of birth for the foreign-born population - Ukraine (%)
Place of birth for the foreign-born population - Other Eastern Europe (%)
Place of birth for the foreign-born population - China (%)
Place of birth for the foreign-born population - Hong Kong (%)
Place of birth for the foreign-born population - Taiwan (%)
Place of birth for the foreign-born population - Japan (%)
Place of birth for the foreign-born population - Korea (%)
Place of birth for the foreign-born population - Other Eastern Asia (%)
Place of birth for the foreign-born population - Afghanistan (%)
Place of birth for the foreign-born population - Bangladesh (%)
Place of birth for the foreign-born population - India (%)
Place of birth for the foreign-born population - Iran (%)
Place of birth for the foreign-born population - Kazakhstan (%)
Place of birth for the foreign-born population - Nepal (%)
Place of birth for the foreign-born population - Pakistan (%)
Place of birth for the foreign-born population - Sri Lanka (%)
Place of birth for the foreign-born population - Uzbekistan (%)
Place of birth for the foreign-born population - Other South Central Asia (%)
Place of birth for the foreign-born population - Burma (%)
Place of birth for the foreign-born population - Cambodia (%)
Place of birth for the foreign-born population - Indonesia (%)
Place of birth for the foreign-born population - Laos (%)
Place of birth for the foreign-born population - Malaysia (%)
Place of birth for the foreign-born population - Philippines (%)
Place of birth for the foreign-born population - Singapore (%)
Place of birth for the foreign-born population - Thailand (%)
Place of birth for the foreign-born population - Vietnam (%)
Place of birth for the foreign-born population - Other South Eastern Asia (%)
Place of birth for the foreign-born population - Armenia (%)
Place of birth for the foreign-born population - Iraq (%)
Place of birth for the foreign-born population - Israel (%)
Place of birth for the foreign-born population - Jordan (%)
Place of birth for the foreign-born population - Kuwait (%)
Place of birth for the foreign-born population - Lebanon (%)
Place of birth for the foreign-born population - Saudi Arabia (%)
Place of birth for the foreign-born population - Syria (%)
Place of birth for the foreign-born population - Turkey (%)
Place of birth for the foreign-born population - Yemen (%)
Place of birth for the foreign-born population - Other Western Asia (%)
Place of birth for the foreign-born population - Eritrea (%)
Place of birth for the foreign-born population - Ethiopia (%)
Place of birth for the foreign-born population - Kenya (%)
Place of birth for the foreign-born population - Somalia (%)
Place of birth for the foreign-born population - Uganda (%)
Place of birth for the foreign-born population - Zimbabwe (%)
Place of birth for the foreign-born population - Other Eastern Africa (%)
Place of birth for the foreign-born population - Cameroon (%)
Place of birth for the foreign-born population - Congo (%)
Place of birth for the foreign-born population - Democratic Republic of Congo (Zaire) (%)
Place of birth for the foreign-born population - Other Middle Africa (%)
Place of birth for the foreign-born population - Egypt (%)
Place of birth for the foreign-born population - Morocco (%)
Place of birth for the foreign-born population - Sudan (%)
Place of birth for the foreign-born population - Other Northern Africa (%)
Place of birth for the foreign-born population - South Africa (%)
Place of birth for the foreign-born population - Other Southern Africa (%)
Place of birth for the foreign-born population - Cabo Verde (%)
Place of birth for the foreign-born population - Ghana (%)
Place of birth for the foreign-born population - Liberia (%)
Place of birth for the foreign-born population - Nigeria (%)
Place of birth for the foreign-born population - Senegal (%)
Place of birth for the foreign-born population - Sierra Leone (%)
Place of birth for the foreign-born population - Other Western Africa (%)
Place of birth for the foreign-born population - Australia (%)
Place of birth for the foreign-born population - New Zealand (%)
Place of birth for the foreign-born population - Fiji (%)
Place of birth for the foreign-born population - Micronesia (%)
Place of birth for the foreign-born population - Bahamas (%)
Place of birth for the foreign-born population - Barbados (%)
Place of birth for the foreign-born population - Cuba (%)
Place of birth for the foreign-born population - Dominica (%)
Place of birth for the foreign-born population - Dominican Republic (%)
Place of birth for the foreign-born population - Grenada (%)
Place of birth for the foreign-born population - Haiti (%)
Place of birth for the foreign-born population - Jamaica (%)
Place of birth for the foreign-born population - St. Vincent and the Grenadines (%)
Place of birth for the foreign-born population - Trinidad and Tobago (%)
Place of birth for the foreign-born population - West Indies (%)
Place of birth for the foreign-born population - Other Caribbean (%)
Place of birth for the foreign-born population - Belize (%)
Place of birth for the foreign-born population - Costa Rica (%)
Place of birth for the foreign-born population - El Salvador (%)
Place of birth for the foreign-born population - Guatemala (%)
Place of birth for the foreign-born population - Honduras (%)
Place of birth for the foreign-born population - Mexico (%)
Place of birth for the foreign-born population - Nicaragua (%)
Place of birth for the foreign-born population - Panama (%)
Place of birth for the foreign-born population - Other Central America (%)
Place of birth for the foreign-born population - Argentina (%)
Place of birth for the foreign-born population - Bolivia (%)
Place of birth for the foreign-born population - Brazil (%)
Place of birth for the foreign-born population - Chile (%)
Place of birth for the foreign-born population - Colombia (%)
Place of birth for the foreign-born population - Ecuador (%)
Place of birth for the foreign-born population - Guyana (%)
Place of birth for the foreign-born population - Peru (%)
Place of birth for the foreign-born population - Uruguay (%)
Place of birth for the foreign-born population - Venezuela (%)
Place of birth for the foreign-born population - Other South America (%)
Place of birth for the foreign-born population - Canada (%)
Place of birth for the foreign-born population - Other Northern America (%)
Place of birth for the foreign-born population - Other (%)
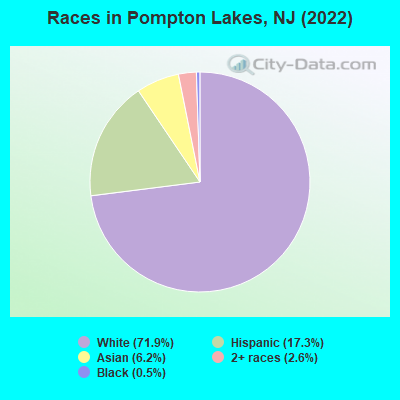
According to 2022 data, the most numerous races in Pompton Lakes, NJ are White alone (7,858 residents), Hispanic (1,886 residents), and Black alone (55 residents). 71.6% of Pompton Lakes residents speak English at home. 15.1% of Pompton Lakes, NJ residents are foreign-born (5.8% born in Europe, 4.7% born in Latin America, 3.8% born in Asia), which is 52.6% less than the foreign-born rate of 23.0% across the entire state of New Jersey.
Race distribution in Pompton Lakes
2000 2022
5,557,209 66.0% White alone 1,117,191 13.3% Hispanic 1,096,171 13.0% Black alone 477,012 5.7% Asian alone 133,689 1.6% Two or more races 19,565 0.2% Other race alone 11,338 0.1% American Indian alone 2,175 0.03% Native Hawaiian and Other
4,766,476 51.5% White alone 2,028,470 21.9% Hispanic 1,111,632 12.0% Black alone 923,546 10.0% Asian alone 332,237 3.6% Two or more races 89,847 1.0% Other race alone 8,557 0.09% American Indian alone 934 0.01% Native Hawaiian and Other
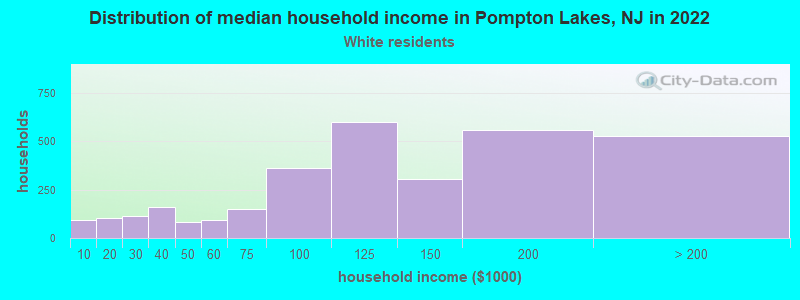
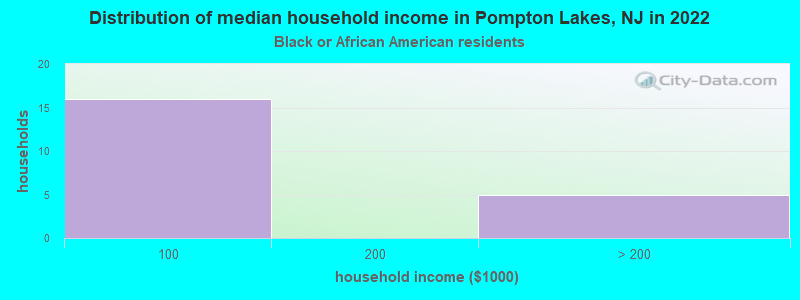
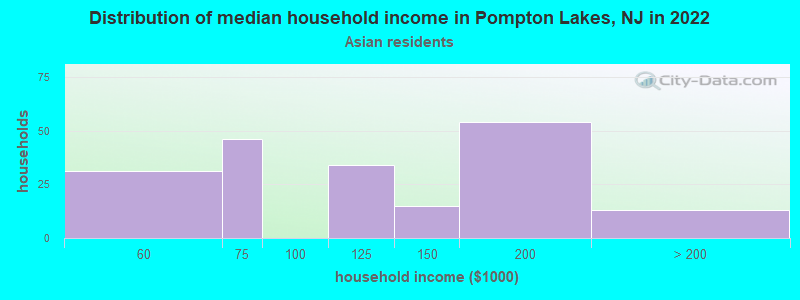
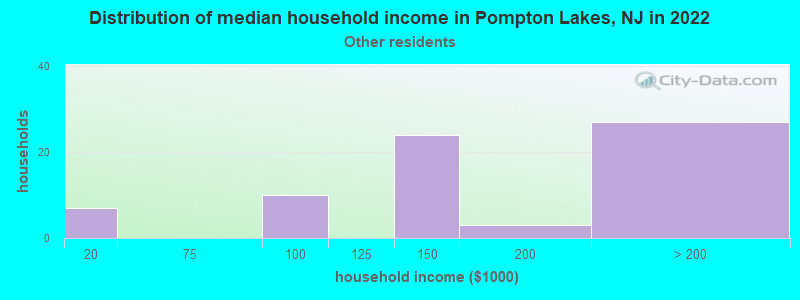
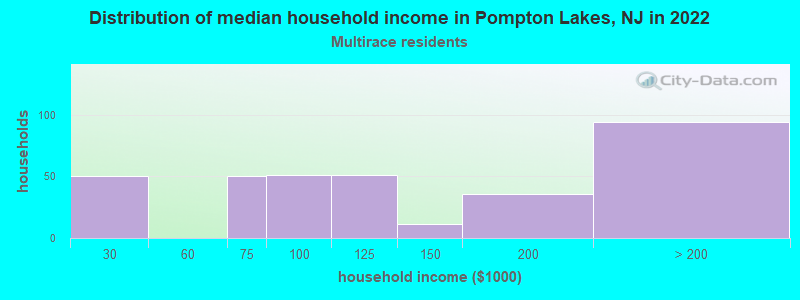
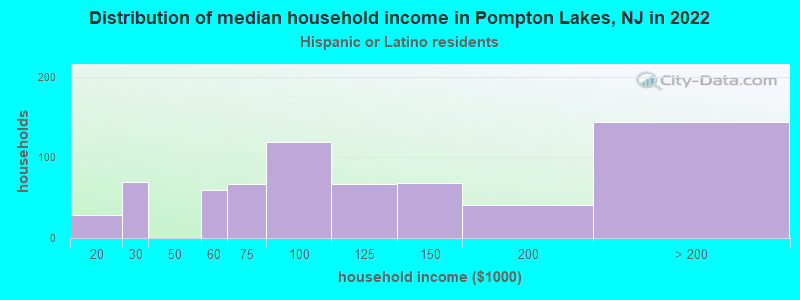
Income and house value in Pompton Lakes Median household income in 2022 $109,668 White non-Hispanic householders$140,351 Asian householders$119,697 Two or more races householders$89,601 Hispanic or Latino race householdersMedian 2022 house value $400,088 White Non-Hispanic householders$360,990 American Indian or Alaska Native householders $404,086 Asian householders$404,308 Some other race householders$305,453 Two or more races householders$402,087 Hispanic or Latino householders
Median age by race in Pompton Lakes
45.2 Median age for White residents41.7 48.1 32.9 Median age for Black or African American residents-709,876,542.5 32.3 -672,014,259.6 Median age for American Indian / Alaska Native residents-655,394,524.3 -944,444,443.5 25.5 Median age for Asian residents25.7 35.3 -804,177,544.9 Median age for Native Hawaiian / Pacific Islander residents-860,335,194.7 -713,070,378.3 40.9 Median age for Other race residents28.7 42.4 30.5 Median age for Two or more races residents28.1 31.2 44.2 Median age for White alone residents39.7 49.9 30.7 Median age for Hispanic or Latino residents33.6 28.8
Owner/renter occupied households by race in Pompton Lakes
House owners and renters - White residents 2,785 84.6% Owner occupied509 15.4% Renter occupiedHouse owners and renters - Black or African American residents 23 100.0% Owner occupiedHouse owners and renters - Asian residents 126 59.4% Owner occupied86 40.6% Renter occupiedHouse owners and renters - Other race residents 68 92.3% Owner occupied6 7.7% Renter occupiedHouse owners and renters - Two or more races residents 293 71.8% Owner occupied115 28.2% Renter occupiedHouse owners and renters - White alone residents 2,659 82.3% Owner occupied573 17.7% Renter occupiedHouse owners and renters - Hispanic or Latino residents 556 73.3% Owner occupied203 26.7% Renter occupied
Language usage in Pompton Lakes
English speakers - Total 71.6% of residents of Pompton Lakes speak English at home.
11.2% of residents speak Spanish at home 975 83.8% Speak English very well188 16.2% Speak English less than very well16.5% of residents speak other language at home 1,505 87.6% Speak English very well214 12.4% Speak English less than very well
English speakers - Born in the United States 71.8% of residents of Pompton Lakes speak English at home.
15.2% of residents speak Spanish at home 298 94.3% Speak English very well18 5.7% Speak English less than very well12.8% of residents speak other language at home 251 94.4% Speak English very well15 5.6% Speak English less than very well
English speakers - Native, born elsewhere 25.0% of residents of Pompton Lakes speak English at home.
25.4% of residents speak Spanish at home 37 64.9% Speak English very well20 35.1% Speak English less than very well49.6% of residents speak other language at home 67 60.4% Speak English very well44 39.6% Speak English less than very well
English speakers - Foreign-born 14.4% of residents of Pompton Lakes speak English at home.
24.5% of residents speak Spanish at home 244 63.9% Speak English very well138 36.1% Speak English less than very well59.3% of residents speak other language at home 773 83.7% Speak English very well151 16.3% Speak English less than very well
White (Caucasian) - Speak only English Native:
92.8% (6,298)Foreign-born:
17.1% (109)
White (Caucasian) - Speak another language Native:
9.1% (616)Foreign-born:
83.2% (530)
Black or African American - Speak another language Native:
16.7% (8)Foreign-born:
100.0% (4)
Asian - Speak only English Native:
6.4% (15)Foreign-born:
10.4% (38)
Asian - Speak another language Native:
76.9% (185)Foreign-born:
89.0% (322)
Other race - Speak only English Native:
50.7% (63)Foreign-born:
62.4% (54)
Other race - Speak another language Native:
56.4% (70)Foreign-born:
54.6% (48)
Two or more races - Speak only English Native:
54.4% (612)Foreign-born:
26.8% (36)
Two or more races - Speak another language Native:
41.2% (463)Foreign-born:
72.1% (97)
White alone - Speak only English Native:
90.5% (6,128)Foreign-born:
12.5% (98)
White alone - Speak another language Native:
9.4% (638)Foreign-born:
87.9% (691)
Hispanic or Latino - Speak only English Native:
51.6% (753)Foreign-born:
24.2% (92)
Hispanic or Latino - Speak another language Native:
49.9% (729)Foreign-born:
77.8% (295)
Foreign-born residents in Pompton Lakes 1,646 residents are foreign born (5.8% Europe , 4.7% Latin America , 3.8% Asia ).
This city:
15.1%New Jersey:
23.2%
Marital status for residents in Pompton Lakes Marital status - White (Caucasian) population 15 years and over
Males 35.8% Never married57.9% Now married1.5% Separated1.0% Widowed3.8% DivorcedFemales 27.3% Never married51.5% Now married1.3% Separated9.8% Widowed10.0% DivorcedWomen who gave birth in the past 12 months Now married:
100.0% (33)Unmarried:
0.0% (0)
Women who did not give birth in the past 12 months Now married:
43.9% (598)Unmarried:
56.1% (763)
Marital status - Black or African American population 15 years and over
Males 0.0% Never married100.0% Now married0.0% Separated0.0% Widowed0.0% DivorcedFemales 64.7% Never married20.6% Now married0.0% Separated0.0% Widowed14.7% DivorcedWomen who did not give birth in the past 12 months Now married:
24.1% (7)Unmarried:
75.9% (21)
Marital status - Asian population 15 years and over
Males 33.0% Never married67.0% Now married0.0% Separated0.0% Widowed0.0% DivorcedFemales 34.4% Never married40.4% Now married0.0% Separated11.3% Widowed13.9% DivorcedWomen who did not give birth in the past 12 months Now married:
47.5% (99)Unmarried:
52.5% (110)
Marital status - Other race population 15 years and over
Males 44.9% Never married55.1% Now married0.0% Separated0.0% Widowed0.0% DivorcedFemales 16.8% Never married56.1% Now married5.6% Separated5.6% Widowed15.9% DivorcedWomen who did not give birth in the past 12 months Now married:
64.1% (42)Unmarried:
35.9% (24)
Marital status - Two or more races population 15 years and over
Males 42.5% Never married52.8% Now married0.0% Separated0.0% Widowed4.7% DivorcedFemales 27.6% Never married35.6% Now married0.0% Separated20.3% Widowed16.5% DivorcedWomen who did not give birth in the past 12 months Now married:
43.2% (173)Unmarried:
56.8% (227)
Marital status - White alone, not Hispanic / Latino population 15 years and over
Males 34.4% Never married59.6% Now married1.7% Separated1.1% Widowed3.2% DivorcedFemales 25.2% Never married53.6% Now married1.5% Separated10.7% Widowed9.1% DivorcedWomen who gave birth in the past 12 months Now married:
100.0% (31)Unmarried:
0.0% (0)
Women who did not give birth in the past 12 months Now married:
48.7% (716)Unmarried:
51.3% (754)
Marital status - Hispanic or Latino population 15 years and over
Males 42.7% Never married50.8% Now married0.0% Separated0.0% Widowed6.5% DivorcedFemales 32.0% Never married35.0% Now married0.9% Separated11.2% Widowed20.9% DivorcedWomen who gave birth in the past 12 months Now married:
100.0% (11)Unmarried:
0.0% (0)
Women who did not give birth in the past 12 months Now married:
30.1% (132)Unmarried:
69.9% (307)
Ancestries in Pompton Lakes
1,224 21.6% Italian501 8.9% American416 7.4% Albanian397 7.0% Irish201 3.6% Palestinian183 3.2% German155 2.7% Polish150 2.7% Dutch78 1.4% Greek65 1.1% Egyptian59 1.0% English54 1.0% Russian49 0.9% European41 0.7% Portuguese36 0.6% Haitian35 0.6% Ukrainian21 0.4% Jamaican20 0.4% British18 0.3% Armenian16 0.3% Guyanese16 0.3% Swedish12 0.2% French11 0.2% Macedonian10 0.2% Austrian8 0.1% Finnish8 0.1% Hungarian7 0.1% Czech7 0.1% Eastern European7 0.1% Northern European6 0.1% Scotch-Irish6 0.1% Swiss1 0.02% Romanian
Children Nativity (place of birth) in Pompton Lakes
Children under 6 years - Living with two parents Both parents native 436 100.0% NativeBoth parents foreign-born 19 100.0% NativeOne native, one foreign-born parent 187 100.0% NativeChildren under 6 years - Living with one parent Native parent 69 100.0% NativeForeign-born parent 9 100.0% NativeChildren 6 to 17 years - Living with two parents Both parents native 717 100.0% NativeBoth parents foreign-born 132 100.0% NativeOne native, one foreign-born parent 293 100.0% NativeChildren 6 to 17 years - Living with one parent Native parent 362 100.0% NativeForeign-born parent 120 52.3% Native110 47.7% Foreign-born
Grandparents responsible for own grandchildren in Pompton Lakes
Grandparents (30 to 59 years) White / Caucasian 11 40.0% Responsible for grandchildren16 60.0% Not responsible for grandchildrenWhite alone, not Hispanic / Latino 13 37.7% Responsible for grandchildren21 62.3% Not responsible for grandchildren
Grandparents (60 years and over) White / Caucasian 26 100.0% Not responsible for grandchildrenWhite alone, not Hispanic / Latino 29 100.0% Not responsible for grandchildren