Races in Port La Belle, Florida (FL) Detailed Stats
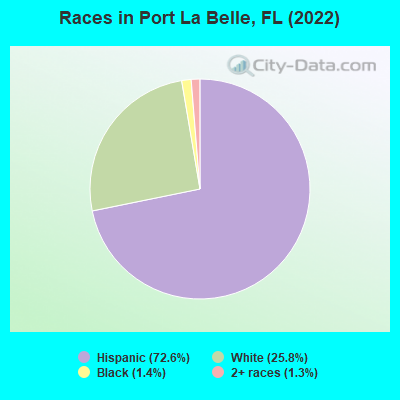
According to 2022 data, the most numerous races in Port La Belle, FL are White alone (1,556 residents), Hispanic (4,374 residents), and Black alone (82 residents). 32.3% of Port La Belle residents speak English at home. 42.6% of Port La Belle, FL residents are foreign-born (41.3% born in Latin America), which is 50.7% greater than the foreign-born rate of 21.0% across the entire state of Florida.
Race distribution in Port La Belle
2000 2022
10,458,509 65.4% White alone 2,682,715 16.8% Hispanic 2,264,268 14.2% Black alone 261,693 1.6% Asian alone 236,954 1.5% Two or more races 42,358 0.3% American Indian alone 28,994 0.2% Other race alone 6,887 0.04% Native Hawaiian and Other
11,309,403 50.8% White alone 6,025,039 27.1% Hispanic 3,241,015 14.6% Black alone 861,630 3.9% Two or more races 623,692 2.8% Asian alone 152,054 0.7% Other race alone 22,504 0.1% American Indian alone 9,486 0.04% Native Hawaiian and Other
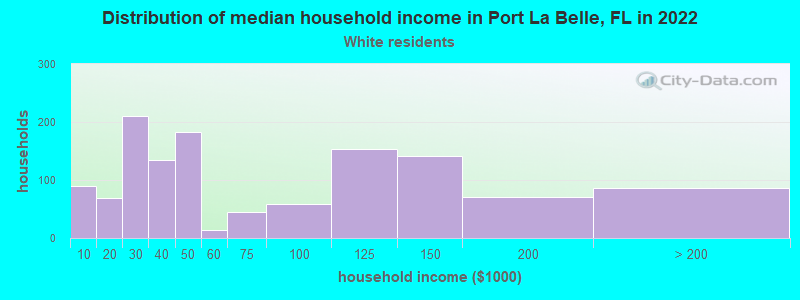
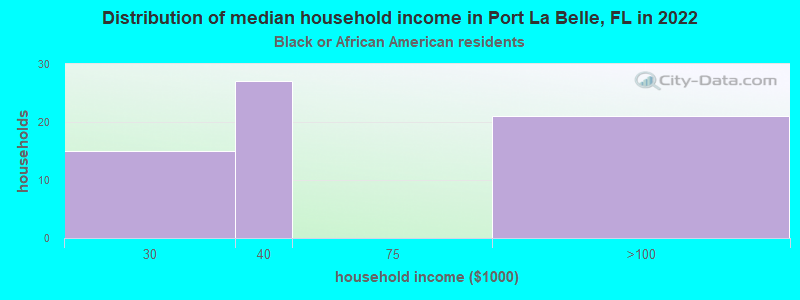
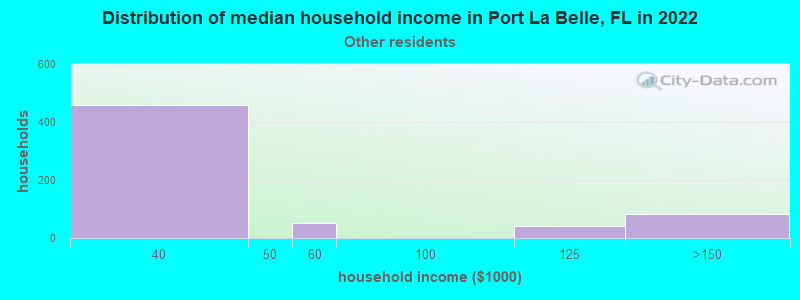
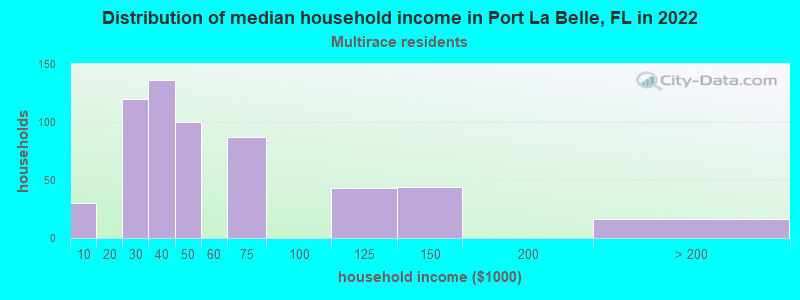
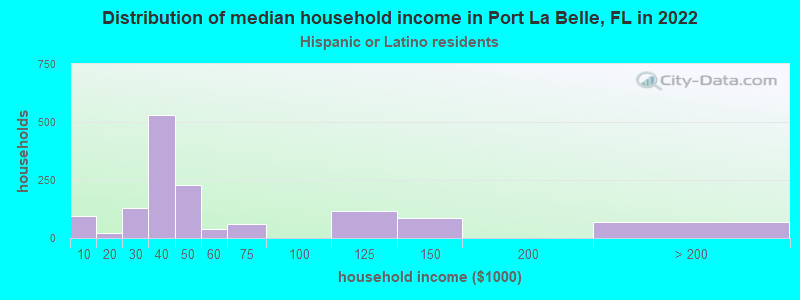
Income and house value in Port La Belle Median household income in 2022 $87,301 White non-Hispanic householders$39,231 Some other race householders$44,985 Two or more races householders$38,520 Hispanic or Latino race householdersMedian 2022 house value $190,267 White Non-Hispanic householders$216,048 Black or African American householdersover $1,000,000 American Indian or Alaska Native householders$238,198 Some other race householders$229,846 Two or more races householders$219,316 Hispanic or Latino householders
Median age by race in Port La Belle
32.1 Median age for White residents36.0 29.0 81.3 Median age for Black or African American residents-680,851,063.1 80.6 -598,566,307.6 Median age for American Indian / Alaska Native residents-611,418,047.3 -594,925,633.7 -679,966,749.1 Median age for Asian residents-680,591,818.3 -677,857,713.2 -679,849,340.2 Median age for Native Hawaiian / Pacific Islander residents-858,307,848.3 -443,298,968.6 52.4 Median age for Other race residents52.5 44.8 27.1 Median age for Two or more races residents26.7 27.9 35.3 Median age for White alone residents35.2 37.1 27.2 Median age for Hispanic or Latino residents31.0 26.9
Owner/renter occupied households by race in Port La Belle
House owners and renters - White residents 946 74.3% Owner occupied328 25.7% Renter occupiedHouse owners and renters - Black or African American residents 65 100.0% Owner occupiedHouse owners and renters - Other race residents 519 80.4% Owner occupied126 19.6% Renter occupiedHouse owners and renters - Two or more races residents 311 52.4% Owner occupied283 47.6% Renter occupiedHouse owners and renters - White alone residents 672 81.0% Owner occupied157 19.0% Renter occupiedHouse owners and renters - Hispanic or Latino residents 905 63.8% Owner occupied514 36.2% Renter occupied
Language usage in Port La Belle
English speakers - Total 32.3% of residents of Port La Belle speak English at home.
67.8% of residents speak Spanish at home 1,918 50.3% Speak English very well1,897 49.7% Speak English less than very well
English speakers - Born in the United States 65.6% of residents of Port La Belle speak English at home.
34.0% of residents speak Spanish at home 222 86.0% Speak English very well36 14.0% Speak English less than very well
English speakers - Native, born elsewhere 24.7% of residents of Port La Belle speak English at home.
74.4% of residents speak Spanish at home 148 60.7% Speak English very well96 39.3% Speak English less than very well
English speakers - Foreign-born 8.4% of residents of Port La Belle speak English at home.
91.5% of residents speak Spanish at home 725 30.9% Speak English very well1,622 69.1% Speak English less than very well
White (Caucasian) - Speak only English Native:
64.1% (1,332)Foreign-born:
8.8% (50)
White (Caucasian) - Speak another language Native:
24.2% (504)Foreign-born:
83.2% (469)
Black or African American - Speak only English Native:
99.8% (41)Foreign-born:
97.0% (40)
Other race - Speak another language Native:
42.8% (71)Foreign-born:
100.0% (969)
Two or more races - Speak only English Native:
16.4% (167)Foreign-born:
14.4% (178)
Two or more races - Speak another language Native:
87.3% (886)Foreign-born:
85.2% (1,055)
White alone - Speak another language Native:
1.0% (14)Foreign-born:
97.9% (12)
Hispanic or Latino - Speak only English Native:
10.6% (179)Foreign-born:
5.7% (140)
Hispanic or Latino - Speak another language Native:
87.1% (1,467)Foreign-born:
94.3% (2,328)
Foreign-born residents in Port La Belle 2,568 residents are foreign born (41.3% Latin America ).
This city:
42.6%Florida:
21.1%
Marital status for residents in Port La Belle Marital status - White (Caucasian) population 15 years and over
Males 50.9% Never married45.0% Now married0.0% Separated0.0% Widowed4.0% DivorcedFemales 27.5% Never married61.1% Now married0.0% Separated4.6% Widowed6.8% DivorcedWomen who gave birth in the past 12 months Now married:
31.9% (25)Unmarried:
68.1% (54)
Women who did not give birth in the past 12 months Now married:
58.7% (333)Unmarried:
41.3% (234)
Marital status - Black or African American population 15 years and over
Males 0.0% Never married100.0% Now married0.0% Separated0.0% Widowed0.0% DivorcedFemales 0.0% Never married31.1% Now married0.0% Separated68.9% Widowed0.0% DivorcedMarital status - Other race population 15 years and over
Males 6.9% Never married26.3% Now married0.0% Separated0.0% Widowed66.8% DivorcedFemales 32.6% Never married50.6% Now married0.0% Separated16.9% Widowed0.0% DivorcedWomen who did not give birth in the past 12 months Now married:
37.8% (49)Unmarried:
62.2% (80)
Marital status - Two or more races population 15 years and over
Males 54.7% Never married42.9% Now married2.4% Separated0.0% Widowed0.0% DivorcedFemales 50.4% Never married33.1% Now married0.0% Separated0.0% Widowed16.5% DivorcedWomen who did not give birth in the past 12 months Now married:
32.3% (271)Unmarried:
67.7% (568)
Marital status - White alone, not Hispanic / Latino population 15 years and over
Males 34.4% Never married56.2% Now married0.0% Separated0.0% Widowed9.4% DivorcedFemales 10.6% Never married71.8% Now married0.0% Separated5.5% Widowed12.2% DivorcedWomen who did not give birth in the past 12 months Now married:
73.2% (207)Unmarried:
26.8% (76)
Marital status - Hispanic or Latino population 15 years and over
Males 46.0% Never married36.3% Now married0.8% Separated0.0% Widowed16.9% DivorcedFemales 49.8% Never married41.1% Now married0.0% Separated3.8% Widowed5.3% DivorcedWomen who gave birth in the past 12 months Now married:
31.9% (30)Unmarried:
68.1% (64)
Women who did not give birth in the past 12 months Now married:
36.8% (378)Unmarried:
63.2% (651)
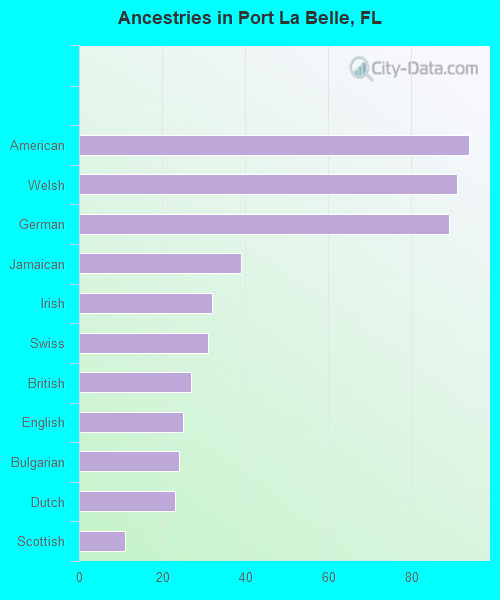
Ancestries in Port La Belle
94 2.5% American91 2.5% Welsh89 2.4% German39 1.1% Jamaican32 0.9% Irish31 0.8% Swiss27 0.7% British25 0.7% English24 0.6% Bulgarian23 0.6% Dutch11 0.3% Scottish
Children Nativity (place of birth) in Port La Belle
Children under 6 years - Living with two parents Both parents native 46 100.0% NativeBoth parents foreign-born 34 100.0% NativeOne native, one foreign-born parent 10 100.0% NativeChildren under 6 years - Living with one parent Native parent 161 100.0% NativeForeign-born parent 177 100.0% NativeChildren 6 to 17 years - Living with two parents Both parents native 224 100.0% NativeBoth parents foreign-born 425 100.0% NativeChildren 6 to 17 years - Living with one parent Foreign-born parent 488 59.6% Native330 40.4% Foreign-born
Grandparents responsible for own grandchildren in Port La Belle
Grandparents (30 to 59 years) White / Caucasian 12 100.0% Not responsible for grandchildrenWhite alone, not Hispanic / Latino 16 100.0% Not responsible for grandchildren
Grandparents (60 years and over)