Races in Portales, New Mexico (NM) Detailed Stats
Data:
Races - White alone (%)
Races - White alone (% change since 2000)
Races - Black alone (%)
Races - Black alone (% change since 2000)
Races - American Indian alone (%)
Races - American Indian alone (% change since 2000)
Races - Asian alone (%)
Races - Asian alone (% change since 2000)
Races - Hispanic (%)
Races - Hispanic (% change since 2000)
Races - Native Hawaiian and Other Pacific Islander alone (%)
Races - Native Hawaiian and Other Pacific Islander alone (% change since 2000)
Races - Two or more races(%)
Races - Two or more races(% change since 2000)
Races - Other race alone (%)
Races - Other race alone (% change since 2000)
Racial diversity
Place of birth - Born in state of residence (%)
Place of birth - Born in state of residence (%) - White
Place of birth - Born in state of residence (%) - Black or African American
Place of birth - Born in state of residence (%) - Asian
Place of birth - Born in state of residence (%) - Hispanic or Latino
Place of birth - Born in state of residence (%) - American Indian and Alaska Native
Place of birth - Born in state of residence (%) - Multirace
Place of birth - Born in state of residence (%) - Other Race
Place of birth - Born in other state (%)
Place of birth - Born in other state (%) - White
Place of birth - Born in other state (%) - Black or African American
Place of birth - Born in other state (%) - Asian
Place of birth - Born in other state (%) - Hispanic or Latino
Place of birth - Born in other state (%) - American Indian and Alaska Native
Place of birth - Born in other state (%) - Multirace
Place of birth - Born in other state (%) - Other Race
Place of birth - Native, outside of US (%)
Place of birth - Native, outside of US (%) - White
Place of birth - Native, outside of US (%) - Black or African American
Place of birth - Native, outside of US (%) - Asian
Place of birth - Native, outside of US (%) - Hispanic or Latino
Place of birth - Native, outside of US (%) - American Indian and Alaska Native
Place of birth - Native, outside of US (%) - Multirace
Place of birth - Native, outside of US (%) - Other Race
Place of birth - Foreign born (%)
Place of birth - Foreign born (%) - White
Place of birth - Foreign born (%) - Black or African American
Place of birth - Foreign born (%) - Asian
Place of birth - Foreign born (%) - Hispanic or Latino
Place of birth - Foreign born (%) - American Indian and Alaska Native
Place of birth - Foreign born (%) - Multirace
Place of birth - Foreign born (%) - Other Race
Residents speaking English at home (%)
Residents speaking English at home - Born in the United States (%)
Residents speaking English at home - Native, born elsewhere (%)
Residents speaking English at home - Foreign born (%)
Residents speaking Spanish at home (%)
Residents speaking Spanish at home - Born in the United States (%)
Residents speaking Spanish at home - Native, born elsewhere (%)
Residents speaking Spanish at home - Foreign born (%)
Residents speaking other language at home (%)
Residents speaking other language at home - Born in the United States (%)
Residents speaking other language at home - Native, born elsewhere (%)
Residents speaking other language at home - Foreign born (%)
Marital status - Never married (%)
Marital status - Now married (%)
Marital status - Separated (%)
Marital status - Widowed (%)
Marital status - Divorced (%)
Ancestries Reported - Arab (%)
Ancestries Reported - Czech (%)
Ancestries Reported - Danish (%)
Ancestries Reported - Dutch (%)
Ancestries Reported - English (%)
Ancestries Reported - French (%)
Ancestries Reported - French Canadian (%)
Ancestries Reported - German (%)
Ancestries Reported - Greek (%)
Ancestries Reported - Hungarian (%)
Ancestries Reported - Irish (%)
Ancestries Reported - Italian (%)
Ancestries Reported - Lithuanian (%)
Ancestries Reported - Norwegian (%)
Ancestries Reported - Polish (%)
Ancestries Reported - Portuguese (%)
Ancestries Reported - Russian (%)
Ancestries Reported - Scotch-Irish (%)
Ancestries Reported - Scottish (%)
Ancestries Reported - Slovak (%)
Ancestries Reported - Subsaharan African (%)
Ancestries Reported - Swedish (%)
Ancestries Reported - Swiss (%)
Ancestries Reported - Ukrainian (%)
Ancestries Reported - United States (%)
Ancestries Reported - Welsh (%)
Ancestries Reported - West Indian (%)
Ancestries Reported - Other (%)
Geographical mobility - Same house 1 year ago (%)
Geographical mobility - Same house 1 year ago (%) - White
Geographical mobility - Same house 1 year ago (%) - Black or African American
Geographical mobility - Same house 1 year ago (%) - Asian
Geographical mobility - Same house 1 year ago (%) - Hispanic or Latino
Geographical mobility - Same house 1 year ago (%) - American Indian and Alaska Native
Geographical mobility - Same house 1 year ago (%) - Multirace
Geographical mobility - Same house 1 year ago (%) - Other Race
Geographical mobility - Moved within same county (%)
Geographical mobility - Moved within same county (%) - White
Geographical mobility - Moved within same county (%) - Black or African American
Geographical mobility - Moved within same county (%) - Asian
Geographical mobility - Moved within same county (%) - Hispanic or Latino
Geographical mobility - Moved within same county (%) - American Indian and Alaska Native
Geographical mobility - Moved within same county (%) - Multirace
Geographical mobility - Moved within same county (%) - Other Race
Geographical mobility - Moved from different county within same state (%)
Geographical mobility - Moved from different county within same state (%) - White
Geographical mobility - Moved from different county within same state (%) - Black or African American
Geographical mobility - Moved from different county within same state (%) - Asian
Geographical mobility - Moved from different county within same state (%) - Hispanic or Latino
Geographical mobility - Moved from different county within same state (%) - American Indian and Alaska Native
Geographical mobility - Moved from different county within same state (%) - Multirace
Geographical mobility - Moved from different county within same state (%) - Other Race
Geographical mobility - Moved from different state (%)
Geographical mobility - Moved from different state (%) - White
Geographical mobility - Moved from different state (%) - Black or African American
Geographical mobility - Moved from different state (%) - Asian
Geographical mobility - Moved from different state (%) - Hispanic or Latino
Geographical mobility - Moved from different state (%) - American Indian and Alaska Native
Geographical mobility - Moved from different state (%) - Multirace
Geographical mobility - Moved from different state (%) - Other Race
Geographical mobility - Moved from abroad (%)
Geographical mobility - Moved from abroad (%) - White
Geographical mobility - Moved from abroad (%) - Black or African American
Geographical mobility - Moved from abroad (%) - Asian
Geographical mobility - Moved from abroad (%) - Hispanic or Latino
Geographical mobility - Moved from abroad (%) - American Indian and Alaska Native
Geographical mobility - Moved from abroad (%) - Multirace
Geographical mobility - Moved from abroad (%) - Other Race
Place of birth for the foreign-born population - Ireland (%)
Place of birth for the foreign-born population - Denmark (%)
Place of birth for the foreign-born population - Norway (%)
Place of birth for the foreign-born population - Sweden (%)
Place of birth for the foreign-born population - United Kingdom (%)
Place of birth for the foreign-born population - England (%)
Place of birth for the foreign-born population - Scotland (%)
Place of birth for the foreign-born population - Other Northern Europe (%)
Place of birth for the foreign-born population - Austria (%)
Place of birth for the foreign-born population - Belgium (%)
Place of birth for the foreign-born population - France (%)
Place of birth for the foreign-born population - Germany (%)
Place of birth for the foreign-born population - Netherlands (%)
Place of birth for the foreign-born population - Switzerland (%)
Place of birth for the foreign-born population - Other Western Europe (%)
Place of birth for the foreign-born population - Greece (%)
Place of birth for the foreign-born population - Italy (%)
Place of birth for the foreign-born population - Portugal (%)
Place of birth for the foreign-born population - Spain (%)
Place of birth for the foreign-born population - Other Southern Europe (%)
Place of birth for the foreign-born population - Albania (%)
Place of birth for the foreign-born population - Belarus (%)
Place of birth for the foreign-born population - Bosnia and Herzegovina (%)
Place of birth for the foreign-born population - Bulgaria (%)
Place of birth for the foreign-born population - Croatia (%)
Place of birth for the foreign-born population - Czechoslovakia (%)
Place of birth for the foreign-born population - Hungary (%)
Place of birth for the foreign-born population - Latvia (%)
Place of birth for the foreign-born population - Lithuania (%)
Place of birth for the foreign-born population - North Macedonia (Macedonia) (%)
Place of birth for the foreign-born population - Moldova (%)
Place of birth for the foreign-born population - Poland (%)
Place of birth for the foreign-born population - Romania (%)
Place of birth for the foreign-born population - Russia (%)
Place of birth for the foreign-born population - Serbia (%)
Place of birth for the foreign-born population - Ukraine (%)
Place of birth for the foreign-born population - Other Eastern Europe (%)
Place of birth for the foreign-born population - China (%)
Place of birth for the foreign-born population - Hong Kong (%)
Place of birth for the foreign-born population - Taiwan (%)
Place of birth for the foreign-born population - Japan (%)
Place of birth for the foreign-born population - Korea (%)
Place of birth for the foreign-born population - Other Eastern Asia (%)
Place of birth for the foreign-born population - Afghanistan (%)
Place of birth for the foreign-born population - Bangladesh (%)
Place of birth for the foreign-born population - India (%)
Place of birth for the foreign-born population - Iran (%)
Place of birth for the foreign-born population - Kazakhstan (%)
Place of birth for the foreign-born population - Nepal (%)
Place of birth for the foreign-born population - Pakistan (%)
Place of birth for the foreign-born population - Sri Lanka (%)
Place of birth for the foreign-born population - Uzbekistan (%)
Place of birth for the foreign-born population - Other South Central Asia (%)
Place of birth for the foreign-born population - Burma (%)
Place of birth for the foreign-born population - Cambodia (%)
Place of birth for the foreign-born population - Indonesia (%)
Place of birth for the foreign-born population - Laos (%)
Place of birth for the foreign-born population - Malaysia (%)
Place of birth for the foreign-born population - Philippines (%)
Place of birth for the foreign-born population - Singapore (%)
Place of birth for the foreign-born population - Thailand (%)
Place of birth for the foreign-born population - Vietnam (%)
Place of birth for the foreign-born population - Other South Eastern Asia (%)
Place of birth for the foreign-born population - Armenia (%)
Place of birth for the foreign-born population - Iraq (%)
Place of birth for the foreign-born population - Israel (%)
Place of birth for the foreign-born population - Jordan (%)
Place of birth for the foreign-born population - Kuwait (%)
Place of birth for the foreign-born population - Lebanon (%)
Place of birth for the foreign-born population - Saudi Arabia (%)
Place of birth for the foreign-born population - Syria (%)
Place of birth for the foreign-born population - Turkey (%)
Place of birth for the foreign-born population - Yemen (%)
Place of birth for the foreign-born population - Other Western Asia (%)
Place of birth for the foreign-born population - Eritrea (%)
Place of birth for the foreign-born population - Ethiopia (%)
Place of birth for the foreign-born population - Kenya (%)
Place of birth for the foreign-born population - Somalia (%)
Place of birth for the foreign-born population - Uganda (%)
Place of birth for the foreign-born population - Zimbabwe (%)
Place of birth for the foreign-born population - Other Eastern Africa (%)
Place of birth for the foreign-born population - Cameroon (%)
Place of birth for the foreign-born population - Congo (%)
Place of birth for the foreign-born population - Democratic Republic of Congo (Zaire) (%)
Place of birth for the foreign-born population - Other Middle Africa (%)
Place of birth for the foreign-born population - Egypt (%)
Place of birth for the foreign-born population - Morocco (%)
Place of birth for the foreign-born population - Sudan (%)
Place of birth for the foreign-born population - Other Northern Africa (%)
Place of birth for the foreign-born population - South Africa (%)
Place of birth for the foreign-born population - Other Southern Africa (%)
Place of birth for the foreign-born population - Cabo Verde (%)
Place of birth for the foreign-born population - Ghana (%)
Place of birth for the foreign-born population - Liberia (%)
Place of birth for the foreign-born population - Nigeria (%)
Place of birth for the foreign-born population - Senegal (%)
Place of birth for the foreign-born population - Sierra Leone (%)
Place of birth for the foreign-born population - Other Western Africa (%)
Place of birth for the foreign-born population - Australia (%)
Place of birth for the foreign-born population - New Zealand (%)
Place of birth for the foreign-born population - Fiji (%)
Place of birth for the foreign-born population - Micronesia (%)
Place of birth for the foreign-born population - Bahamas (%)
Place of birth for the foreign-born population - Barbados (%)
Place of birth for the foreign-born population - Cuba (%)
Place of birth for the foreign-born population - Dominica (%)
Place of birth for the foreign-born population - Dominican Republic (%)
Place of birth for the foreign-born population - Grenada (%)
Place of birth for the foreign-born population - Haiti (%)
Place of birth for the foreign-born population - Jamaica (%)
Place of birth for the foreign-born population - St. Vincent and the Grenadines (%)
Place of birth for the foreign-born population - Trinidad and Tobago (%)
Place of birth for the foreign-born population - West Indies (%)
Place of birth for the foreign-born population - Other Caribbean (%)
Place of birth for the foreign-born population - Belize (%)
Place of birth for the foreign-born population - Costa Rica (%)
Place of birth for the foreign-born population - El Salvador (%)
Place of birth for the foreign-born population - Guatemala (%)
Place of birth for the foreign-born population - Honduras (%)
Place of birth for the foreign-born population - Mexico (%)
Place of birth for the foreign-born population - Nicaragua (%)
Place of birth for the foreign-born population - Panama (%)
Place of birth for the foreign-born population - Other Central America (%)
Place of birth for the foreign-born population - Argentina (%)
Place of birth for the foreign-born population - Bolivia (%)
Place of birth for the foreign-born population - Brazil (%)
Place of birth for the foreign-born population - Chile (%)
Place of birth for the foreign-born population - Colombia (%)
Place of birth for the foreign-born population - Ecuador (%)
Place of birth for the foreign-born population - Guyana (%)
Place of birth for the foreign-born population - Peru (%)
Place of birth for the foreign-born population - Uruguay (%)
Place of birth for the foreign-born population - Venezuela (%)
Place of birth for the foreign-born population - Other South America (%)
Place of birth for the foreign-born population - Canada (%)
Place of birth for the foreign-born population - Other Northern America (%)
Place of birth for the foreign-born population - Other (%)
Latest news about races in Portales, NM collected exclusively by city-data.com from local newspapers, TV, and radio stations
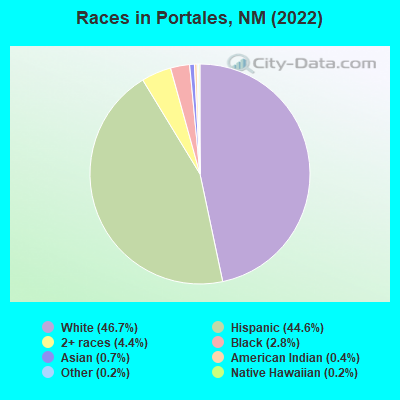
According to 2022 data, the most numerous races in Portales, NM are Hispanic (5,397 residents), White alone (5,648 residents), and American Indian alone (45 residents). 79.9% of Portales residents speak English at home. 6.2% of Portales, NM residents are foreign-born (5.1% born in Latin America, 0.9% born in Asia), which is 45.9% less than the foreign-born rate of 9.0% across the entire state of New Mexico.
Race distribution in Portales
2000 2022
813,495 44.7% White alone 765,386 42.1% Hispanic 161,460 8.9% American Indian alone 30,654 1.7% Black alone 25,793 1.4% Two or more races 18,257 1.0% Asian alone 3,009 0.2% Other race alone 992 0.05% Native Hawaiian and Other
1,059,867 50.2% Hispanic 735,478 34.8% White alone 171,808 8.1% American Indian alone 65,084 3.1% Two or more races 36,870 1.7% Black alone 35,870 1.7% Asian alone 7,582 0.4% Other race alone 785 0.04% Native Hawaiian and Other
Income and house value in Portales Median household income in 2022 $49,746 White non-Hispanic householders$67,997 Two or more races householders$64,061 Hispanic or Latino race householdersMedian 2022 house value $156,368 White Non-Hispanic householders$120,078 Black or African American householders $366,905 Asian householders$115,008 Some other race householders$125,681 Two or more races householders$120,344 Hispanic or Latino householders
Median age by race in Portales
29.0 Median age for White residents27.1 29.2 20.3 Median age for Black or African American residents19.2 -670,719,350.9 29.4 Median age for American Indian / Alaska Native residents-685,534,590.5 29.0 19.7 Median age for Asian residents-687,619,046.9 19.0 -658,511,722.1 Median age for Native Hawaiian / Pacific Islander residents-685,897,435.2 -659,380,691.5 38.4 Median age for Other race residents36.1 39.6 23.4 Median age for Two or more races residents21.4 23.4 30.0 Median age for White alone residents29.4 31.0 25.0 Median age for Hispanic or Latino residents24.9 25.0
Owner/renter occupied households by race in Portales
House owners and renters - White residents 1,410 52.9% Owner occupied1,253 47.1% Renter occupiedHouse owners and renters - Black or African American residents 3 100.0% Owner occupiedHouse owners and renters - American Indian / Alaska Native residents 14 22.9% Owner occupied48 77.1% Renter occupiedHouse owners and renters - Asian residents 19 100.0% Renter occupiedHouse owners and renters - Other race residents 433 49.6% Owner occupied439 50.4% Renter occupiedHouse owners and renters - Two or more races residents 402 69.5% Owner occupied176 30.5% Renter occupiedHouse owners and renters - White alone residents 1,199 56.1% Owner occupied937 43.9% Renter occupiedHouse owners and renters - Hispanic or Latino residents 989 50.8% Owner occupied959 49.2% Renter occupied
Language usage in Portales
English speakers - Total 79.9% of residents of Portales speak English at home.
19.4% of residents speak Spanish at home 1,876 84.5% Speak English very well345 15.5% Speak English less than very well1.4% of residents speak other language at home 157 98.1% Speak English very well3 1.9% Speak English less than very well
English speakers - Born in the United States 83.3% of residents of Portales speak English at home.
15.6% of residents speak Spanish at home 660 88.5% Speak English very well86 11.5% Speak English less than very well0.4% of residents speak other language at home 17 100.0% Speak English very well
English speakers - Native, born elsewhere 82.7% of residents of Portales speak English at home.
14.9% of residents speak Spanish at home 31 100.0% Speak English very well2.9% of residents speak other language at home 6 100.0% Speak English very well
English speakers - Foreign-born 3.4% of residents of Portales speak English at home.
74.4% of residents speak Spanish at home 362 65.8% Speak English very well188 34.2% Speak English less than very well15.8% of residents speak other language at home 114 97.4% Speak English very well3 2.6% Speak English less than very well
White (Caucasian) - Speak only English Native:
98.7% (6,252)Foreign-born:
15.0% (9)
White (Caucasian) - Speak another language Native:
5.2% (330)Foreign-born:
100.0% (59)
Asian - Speak another language Native:
97.7% (48)Foreign-born:
98.1% (76)
Other race - Speak another language Native:
51.5% (926)Foreign-born:
98.8% (584)
Two or more races - Speak only English Native:
71.7% (1,171)Foreign-born:
13.3% (21)
Two or more races - Speak another language Native:
27.9% (456)Foreign-born:
86.9% (137)
Hispanic or Latino - Speak only English Native:
65.2% (2,943)Foreign-born:
2.3% (14)
Hispanic or Latino - Speak another language Native:
35.0% (1,581)Foreign-born:
95.3% (581)
Foreign-born residents in Portales 746 residents are foreign born (5.1% Latin America , 0.9% Asia ).
This city:
6.2%New Mexico:
9.2%
Marital status for residents in Portales Marital status - White (Caucasian) population 15 years and over
Males 41.1% Never married42.2% Now married2.0% Separated9.0% Widowed5.7% DivorcedFemales 35.4% Never married38.0% Now married2.1% Separated7.2% Widowed17.3% DivorcedWomen who gave birth in the past 12 months Now married:
41.4% (22)Unmarried:
58.6% (31)
Women who did not give birth in the past 12 months Now married:
36.4% (638)Unmarried:
63.6% (1,113)
Marital status - Black or African American population 15 years and over
Males 100.0% Never married0.0% Now married0.0% Separated0.0% Widowed0.0% DivorcedFemales 61.4% Never married38.6% Now married0.0% Separated0.0% Widowed0.0% DivorcedWomen who did not give birth in the past 12 months Now married:
0.0% (0)Unmarried:
100.0% (122)
Marital status - American Indian / Alaska Native population 15 years and over
Males 0.0% Never married100.0% Now married0.0% Separated0.0% Widowed0.0% DivorcedFemales 22.0% Never married78.0% Now married0.0% Separated0.0% Widowed0.0% DivorcedWomen who did not give birth in the past 12 months Now married:
78.0% (47)Unmarried:
22.0% (13)
Marital status - Asian population 15 years and over
Males 100.0% Never married0.0% Now married0.0% Separated0.0% Widowed0.0% DivorcedFemales 94.9% Never married5.1% Now married0.0% Separated0.0% Widowed0.0% DivorcedWomen who did not give birth in the past 12 months Now married:
4.1% (5)Unmarried:
95.9% (113)
Marital status - Other race population 15 years and over
Males 50.2% Never married23.8% Now married7.9% Separated0.0% Widowed18.1% DivorcedFemales 32.7% Never married45.1% Now married0.0% Separated6.5% Widowed15.7% DivorcedWomen who gave birth in the past 12 months Now married:
0.0% (0)Unmarried:
100.0% (43)
Women who did not give birth in the past 12 months Now married:
45.5% (348)Unmarried:
54.5% (417)
Marital status - Two or more races population 15 years and over
Males 56.1% Never married31.0% Now married5.3% Separated0.0% Widowed7.6% DivorcedFemales 43.0% Never married32.4% Now married0.0% Separated11.9% Widowed12.7% DivorcedWomen who did not give birth in the past 12 months Now married:
34.1% (190)Unmarried:
65.9% (368)
Marital status - White alone, not Hispanic / Latino population 15 years and over
Males 38.9% Never married41.5% Now married2.0% Separated11.9% Widowed5.7% DivorcedFemales 33.3% Never married38.0% Now married2.6% Separated9.2% Widowed16.9% DivorcedWomen who gave birth in the past 12 months Now married:
25.5% (14)Unmarried:
74.5% (40)
Women who did not give birth in the past 12 months Now married:
35.4% (506)Unmarried:
64.6% (923)
Marital status - Hispanic or Latino population 15 years and over
Males 52.1% Never married33.1% Now married4.0% Separated0.0% Widowed10.9% DivorcedFemales 40.8% Never married39.4% Now married0.5% Separated4.2% Widowed15.2% DivorcedWomen who gave birth in the past 12 months Now married:
33.3% (15)Unmarried:
66.7% (30)
Women who did not give birth in the past 12 months Now married:
38.5% (663)Unmarried:
61.5% (1,059)
Ancestries in Portales
507 7.6% American329 4.9% Italian287 4.3% German219 3.3% English103 1.5% Irish90 1.3% European87 1.3% Scottish82 1.2% Scotch-Irish31 0.5% Welsh20 0.3% British19 0.3% Swedish18 0.3% Haitian10 0.1% Czechoslovakian9 0.1% Norwegian4 0.06% Polish
Geographical mobility in Portales Same house 1 year ago 4,631 70.9% White (Caucasian)2 0.6% Black or African American25 35.5% American Indian / Alaska Native107 84.9% Asian34 100.0% Native Hawaiian / Pacific Islander2,106 85.9% Other race1,560 84.6% Two or more races3,632 64.7% White alone, not Hispanic / Latino4,456 84.7% Hispanic or LatinoMoved within same county 898 13.7% White / Caucasian227 61.2% Black or African American6 4.7% Asian268 10.9% Other race26 1.4% Two or more races881 15.7% White alone, not Hispanic / Latino444 8.4% Hispanic or LatinoMoved within same state 221 3.4% White / Caucasian22 6.0% Black or African American36 1.5% Other race133 7.2% Two or more races182 3.2% White alone, not Hispanic / Latino218 4.1% Hispanic or LatinoMoved from different state 631 9.7% White / Caucasian73 19.8% Black or African American51 71.5% American Indian / Alaska Native15 11.7% Asian28 1.1% Other race129 7.0% Two or more races676 12.0% White alone, not Hispanic / Latino114 2.2% Hispanic or LatinoMoved from abroad 71 1.1% White101 1.8% White alone, not Hispanic / Latino
Children Nativity (place of birth) in Portales
Children under 6 years - Living with two parents Both parents native 397 100.0% NativeOne native, one foreign-born parent 61 100.0% NativeChildren under 6 years - Living with one parent Native parent 206 100.0% NativeForeign-born parent 67 100.0% NativeChildren 6 to 17 years - Living with two parents Both parents native 1,153 99.1% Native10 0.9% Foreign-bornOne native, one foreign-born parent 124 74.7% Native42 25.3% Foreign-bornChildren 6 to 17 years - Living with one parent Native parent 566 100.0% NativeForeign-born parent 37 49.7% Native38 50.3% Foreign-born
Grandparents responsible for own grandchildren in Portales
Grandparents (30 to 59 years) White / Caucasian 1 9.4% Responsible for grandchildren14 90.6% Not responsible for grandchildrenWhite alone, not Hispanic / Latino 1 29.8% Responsible for grandchildren3 70.2% Not responsible for grandchildrenHispanic or Latino 15 100.0% Not responsible for grandchildrenGrandparents (60 years and over) White / Caucasian 34 72.4% Responsible for grandchildren13 27.6% Not responsible for grandchildrenWhite alone, not Hispanic / Latino 22 67.3% Responsible for grandchildren11 32.7% Not responsible for grandchildrenHispanic or Latino 18 34.5% Responsible for grandchildren34 65.5% Not responsible for grandchildren