Races in Portland, Texas (TX) Detailed Stats
Data:
Races - White alone (%)
Races - White alone (% change since 2000)
Races - Black alone (%)
Races - Black alone (% change since 2000)
Races - American Indian alone (%)
Races - American Indian alone (% change since 2000)
Races - Asian alone (%)
Races - Asian alone (% change since 2000)
Races - Hispanic (%)
Races - Hispanic (% change since 2000)
Races - Native Hawaiian and Other Pacific Islander alone (%)
Races - Native Hawaiian and Other Pacific Islander alone (% change since 2000)
Races - Two or more races(%)
Races - Two or more races(% change since 2000)
Races - Other race alone (%)
Races - Other race alone (% change since 2000)
Racial diversity
Place of birth - Born in state of residence (%)
Place of birth - Born in state of residence (%) - White
Place of birth - Born in state of residence (%) - Black or African American
Place of birth - Born in state of residence (%) - Asian
Place of birth - Born in state of residence (%) - Hispanic or Latino
Place of birth - Born in state of residence (%) - American Indian and Alaska Native
Place of birth - Born in state of residence (%) - Multirace
Place of birth - Born in state of residence (%) - Other Race
Place of birth - Born in other state (%)
Place of birth - Born in other state (%) - White
Place of birth - Born in other state (%) - Black or African American
Place of birth - Born in other state (%) - Asian
Place of birth - Born in other state (%) - Hispanic or Latino
Place of birth - Born in other state (%) - American Indian and Alaska Native
Place of birth - Born in other state (%) - Multirace
Place of birth - Born in other state (%) - Other Race
Place of birth - Native, outside of US (%)
Place of birth - Native, outside of US (%) - White
Place of birth - Native, outside of US (%) - Black or African American
Place of birth - Native, outside of US (%) - Asian
Place of birth - Native, outside of US (%) - Hispanic or Latino
Place of birth - Native, outside of US (%) - American Indian and Alaska Native
Place of birth - Native, outside of US (%) - Multirace
Place of birth - Native, outside of US (%) - Other Race
Place of birth - Foreign born (%)
Place of birth - Foreign born (%) - White
Place of birth - Foreign born (%) - Black or African American
Place of birth - Foreign born (%) - Asian
Place of birth - Foreign born (%) - Hispanic or Latino
Place of birth - Foreign born (%) - American Indian and Alaska Native
Place of birth - Foreign born (%) - Multirace
Place of birth - Foreign born (%) - Other Race
Residents speaking English at home (%)
Residents speaking English at home - Born in the United States (%)
Residents speaking English at home - Native, born elsewhere (%)
Residents speaking English at home - Foreign born (%)
Residents speaking Spanish at home (%)
Residents speaking Spanish at home - Born in the United States (%)
Residents speaking Spanish at home - Native, born elsewhere (%)
Residents speaking Spanish at home - Foreign born (%)
Residents speaking other language at home (%)
Residents speaking other language at home - Born in the United States (%)
Residents speaking other language at home - Native, born elsewhere (%)
Residents speaking other language at home - Foreign born (%)
Marital status - Never married (%)
Marital status - Now married (%)
Marital status - Separated (%)
Marital status - Widowed (%)
Marital status - Divorced (%)
Ancestries Reported - Arab (%)
Ancestries Reported - Czech (%)
Ancestries Reported - Danish (%)
Ancestries Reported - Dutch (%)
Ancestries Reported - English (%)
Ancestries Reported - French (%)
Ancestries Reported - French Canadian (%)
Ancestries Reported - German (%)
Ancestries Reported - Greek (%)
Ancestries Reported - Hungarian (%)
Ancestries Reported - Irish (%)
Ancestries Reported - Italian (%)
Ancestries Reported - Lithuanian (%)
Ancestries Reported - Norwegian (%)
Ancestries Reported - Polish (%)
Ancestries Reported - Portuguese (%)
Ancestries Reported - Russian (%)
Ancestries Reported - Scotch-Irish (%)
Ancestries Reported - Scottish (%)
Ancestries Reported - Slovak (%)
Ancestries Reported - Subsaharan African (%)
Ancestries Reported - Swedish (%)
Ancestries Reported - Swiss (%)
Ancestries Reported - Ukrainian (%)
Ancestries Reported - United States (%)
Ancestries Reported - Welsh (%)
Ancestries Reported - West Indian (%)
Ancestries Reported - Other (%)
Geographical mobility - Same house 1 year ago (%)
Geographical mobility - Same house 1 year ago (%) - White
Geographical mobility - Same house 1 year ago (%) - Black or African American
Geographical mobility - Same house 1 year ago (%) - Asian
Geographical mobility - Same house 1 year ago (%) - Hispanic or Latino
Geographical mobility - Same house 1 year ago (%) - American Indian and Alaska Native
Geographical mobility - Same house 1 year ago (%) - Multirace
Geographical mobility - Same house 1 year ago (%) - Other Race
Geographical mobility - Moved within same county (%)
Geographical mobility - Moved within same county (%) - White
Geographical mobility - Moved within same county (%) - Black or African American
Geographical mobility - Moved within same county (%) - Asian
Geographical mobility - Moved within same county (%) - Hispanic or Latino
Geographical mobility - Moved within same county (%) - American Indian and Alaska Native
Geographical mobility - Moved within same county (%) - Multirace
Geographical mobility - Moved within same county (%) - Other Race
Geographical mobility - Moved from different county within same state (%)
Geographical mobility - Moved from different county within same state (%) - White
Geographical mobility - Moved from different county within same state (%) - Black or African American
Geographical mobility - Moved from different county within same state (%) - Asian
Geographical mobility - Moved from different county within same state (%) - Hispanic or Latino
Geographical mobility - Moved from different county within same state (%) - American Indian and Alaska Native
Geographical mobility - Moved from different county within same state (%) - Multirace
Geographical mobility - Moved from different county within same state (%) - Other Race
Geographical mobility - Moved from different state (%)
Geographical mobility - Moved from different state (%) - White
Geographical mobility - Moved from different state (%) - Black or African American
Geographical mobility - Moved from different state (%) - Asian
Geographical mobility - Moved from different state (%) - Hispanic or Latino
Geographical mobility - Moved from different state (%) - American Indian and Alaska Native
Geographical mobility - Moved from different state (%) - Multirace
Geographical mobility - Moved from different state (%) - Other Race
Geographical mobility - Moved from abroad (%)
Geographical mobility - Moved from abroad (%) - White
Geographical mobility - Moved from abroad (%) - Black or African American
Geographical mobility - Moved from abroad (%) - Asian
Geographical mobility - Moved from abroad (%) - Hispanic or Latino
Geographical mobility - Moved from abroad (%) - American Indian and Alaska Native
Geographical mobility - Moved from abroad (%) - Multirace
Geographical mobility - Moved from abroad (%) - Other Race
Place of birth for the foreign-born population - Ireland (%)
Place of birth for the foreign-born population - Denmark (%)
Place of birth for the foreign-born population - Norway (%)
Place of birth for the foreign-born population - Sweden (%)
Place of birth for the foreign-born population - United Kingdom (%)
Place of birth for the foreign-born population - England (%)
Place of birth for the foreign-born population - Scotland (%)
Place of birth for the foreign-born population - Other Northern Europe (%)
Place of birth for the foreign-born population - Austria (%)
Place of birth for the foreign-born population - Belgium (%)
Place of birth for the foreign-born population - France (%)
Place of birth for the foreign-born population - Germany (%)
Place of birth for the foreign-born population - Netherlands (%)
Place of birth for the foreign-born population - Switzerland (%)
Place of birth for the foreign-born population - Other Western Europe (%)
Place of birth for the foreign-born population - Greece (%)
Place of birth for the foreign-born population - Italy (%)
Place of birth for the foreign-born population - Portugal (%)
Place of birth for the foreign-born population - Spain (%)
Place of birth for the foreign-born population - Other Southern Europe (%)
Place of birth for the foreign-born population - Albania (%)
Place of birth for the foreign-born population - Belarus (%)
Place of birth for the foreign-born population - Bosnia and Herzegovina (%)
Place of birth for the foreign-born population - Bulgaria (%)
Place of birth for the foreign-born population - Croatia (%)
Place of birth for the foreign-born population - Czechoslovakia (%)
Place of birth for the foreign-born population - Hungary (%)
Place of birth for the foreign-born population - Latvia (%)
Place of birth for the foreign-born population - Lithuania (%)
Place of birth for the foreign-born population - North Macedonia (Macedonia) (%)
Place of birth for the foreign-born population - Moldova (%)
Place of birth for the foreign-born population - Poland (%)
Place of birth for the foreign-born population - Romania (%)
Place of birth for the foreign-born population - Russia (%)
Place of birth for the foreign-born population - Serbia (%)
Place of birth for the foreign-born population - Ukraine (%)
Place of birth for the foreign-born population - Other Eastern Europe (%)
Place of birth for the foreign-born population - China (%)
Place of birth for the foreign-born population - Hong Kong (%)
Place of birth for the foreign-born population - Taiwan (%)
Place of birth for the foreign-born population - Japan (%)
Place of birth for the foreign-born population - Korea (%)
Place of birth for the foreign-born population - Other Eastern Asia (%)
Place of birth for the foreign-born population - Afghanistan (%)
Place of birth for the foreign-born population - Bangladesh (%)
Place of birth for the foreign-born population - India (%)
Place of birth for the foreign-born population - Iran (%)
Place of birth for the foreign-born population - Kazakhstan (%)
Place of birth for the foreign-born population - Nepal (%)
Place of birth for the foreign-born population - Pakistan (%)
Place of birth for the foreign-born population - Sri Lanka (%)
Place of birth for the foreign-born population - Uzbekistan (%)
Place of birth for the foreign-born population - Other South Central Asia (%)
Place of birth for the foreign-born population - Burma (%)
Place of birth for the foreign-born population - Cambodia (%)
Place of birth for the foreign-born population - Indonesia (%)
Place of birth for the foreign-born population - Laos (%)
Place of birth for the foreign-born population - Malaysia (%)
Place of birth for the foreign-born population - Philippines (%)
Place of birth for the foreign-born population - Singapore (%)
Place of birth for the foreign-born population - Thailand (%)
Place of birth for the foreign-born population - Vietnam (%)
Place of birth for the foreign-born population - Other South Eastern Asia (%)
Place of birth for the foreign-born population - Armenia (%)
Place of birth for the foreign-born population - Iraq (%)
Place of birth for the foreign-born population - Israel (%)
Place of birth for the foreign-born population - Jordan (%)
Place of birth for the foreign-born population - Kuwait (%)
Place of birth for the foreign-born population - Lebanon (%)
Place of birth for the foreign-born population - Saudi Arabia (%)
Place of birth for the foreign-born population - Syria (%)
Place of birth for the foreign-born population - Turkey (%)
Place of birth for the foreign-born population - Yemen (%)
Place of birth for the foreign-born population - Other Western Asia (%)
Place of birth for the foreign-born population - Eritrea (%)
Place of birth for the foreign-born population - Ethiopia (%)
Place of birth for the foreign-born population - Kenya (%)
Place of birth for the foreign-born population - Somalia (%)
Place of birth for the foreign-born population - Uganda (%)
Place of birth for the foreign-born population - Zimbabwe (%)
Place of birth for the foreign-born population - Other Eastern Africa (%)
Place of birth for the foreign-born population - Cameroon (%)
Place of birth for the foreign-born population - Congo (%)
Place of birth for the foreign-born population - Democratic Republic of Congo (Zaire) (%)
Place of birth for the foreign-born population - Other Middle Africa (%)
Place of birth for the foreign-born population - Egypt (%)
Place of birth for the foreign-born population - Morocco (%)
Place of birth for the foreign-born population - Sudan (%)
Place of birth for the foreign-born population - Other Northern Africa (%)
Place of birth for the foreign-born population - South Africa (%)
Place of birth for the foreign-born population - Other Southern Africa (%)
Place of birth for the foreign-born population - Cabo Verde (%)
Place of birth for the foreign-born population - Ghana (%)
Place of birth for the foreign-born population - Liberia (%)
Place of birth for the foreign-born population - Nigeria (%)
Place of birth for the foreign-born population - Senegal (%)
Place of birth for the foreign-born population - Sierra Leone (%)
Place of birth for the foreign-born population - Other Western Africa (%)
Place of birth for the foreign-born population - Australia (%)
Place of birth for the foreign-born population - New Zealand (%)
Place of birth for the foreign-born population - Fiji (%)
Place of birth for the foreign-born population - Micronesia (%)
Place of birth for the foreign-born population - Bahamas (%)
Place of birth for the foreign-born population - Barbados (%)
Place of birth for the foreign-born population - Cuba (%)
Place of birth for the foreign-born population - Dominica (%)
Place of birth for the foreign-born population - Dominican Republic (%)
Place of birth for the foreign-born population - Grenada (%)
Place of birth for the foreign-born population - Haiti (%)
Place of birth for the foreign-born population - Jamaica (%)
Place of birth for the foreign-born population - St. Vincent and the Grenadines (%)
Place of birth for the foreign-born population - Trinidad and Tobago (%)
Place of birth for the foreign-born population - West Indies (%)
Place of birth for the foreign-born population - Other Caribbean (%)
Place of birth for the foreign-born population - Belize (%)
Place of birth for the foreign-born population - Costa Rica (%)
Place of birth for the foreign-born population - El Salvador (%)
Place of birth for the foreign-born population - Guatemala (%)
Place of birth for the foreign-born population - Honduras (%)
Place of birth for the foreign-born population - Mexico (%)
Place of birth for the foreign-born population - Nicaragua (%)
Place of birth for the foreign-born population - Panama (%)
Place of birth for the foreign-born population - Other Central America (%)
Place of birth for the foreign-born population - Argentina (%)
Place of birth for the foreign-born population - Bolivia (%)
Place of birth for the foreign-born population - Brazil (%)
Place of birth for the foreign-born population - Chile (%)
Place of birth for the foreign-born population - Colombia (%)
Place of birth for the foreign-born population - Ecuador (%)
Place of birth for the foreign-born population - Guyana (%)
Place of birth for the foreign-born population - Peru (%)
Place of birth for the foreign-born population - Uruguay (%)
Place of birth for the foreign-born population - Venezuela (%)
Place of birth for the foreign-born population - Other South America (%)
Place of birth for the foreign-born population - Canada (%)
Place of birth for the foreign-born population - Other Northern America (%)
Place of birth for the foreign-born population - Other (%)
Latest news about races in Portland, TX collected exclusively by city-data.com from local newspapers, TV, and radio stations
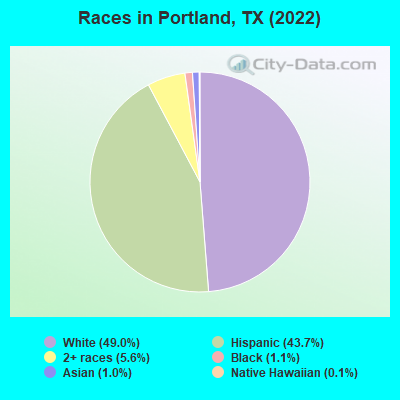
According to 2022 data, the most numerous races in Portland, TX are Hispanic (8,926 residents), White alone (10,007 residents), and Black alone (229 residents). 77.9% of Portland residents speak English at home. 5.3% of Portland, TX residents are foreign-born (3.9% born in Latin America, 0.9% born in Asia), which is 218.8% less than the foreign-born rate of 17.0% across the entire state of Texas.
Race distribution in Portland
2000 2022
10,933,313 52.4% White alone 6,669,666 32.0% Hispanic 2,364,255 11.3% Black alone 554,445 2.7% Asian alone 230,567 1.1% Two or more races 68,859 0.3% American Indian alone 19,958 0.10% Other race alone 10,757 0.05% Native Hawaiian and Other
12,070,642 40.2% Hispanic 11,683,430 38.9% White alone 3,508,706 11.7% Black alone 1,608,173 5.4% Asian alone 956,560 3.2% Two or more races 125,763 0.4% Other race alone 47,023 0.2% American Indian alone 29,275 0.10% Native Hawaiian and Other
Income and house value in Portland Median household income in 2022 $86,278 White non-Hispanic householders$59,892 Some other race householders$63,237 Two or more races householders$81,991 Hispanic or Latino race householdersMedian 2022 house value $244,212 White Non-Hispanic householders$312,634 Black or African American householders$281,844 American Indian or Alaska Native householders $242,107 Asian householders$192,107 Some other race householders$219,212 Two or more races householders$196,317 Hispanic or Latino householders
Median age by race in Portland
36.9 Median age for White residents35.4 39.7 62.3 Median age for Black or African American residents89.4 109.5 38.8 Median age for American Indian / Alaska Native residents-666,666,666.0 51.8 49.3 Median age for Asian residents29.9 53.3 52.3 Median age for Native Hawaiian / Pacific Islander residents55.2 -577,777,777.2 40.9 Median age for Other race residents36.2 67.4 22.6 Median age for Two or more races residents23.5 25.8 39.8 Median age for White alone residents35.3 41.9 30.5 Median age for Hispanic or Latino residents30.1 31.9
Owner/renter occupied households by race in Portland
House owners and renters - White residents 3,080 75.7% Owner occupied991 24.3% Renter occupiedHouse owners and renters - Black or African American residents 60 39.4% Owner occupied93 60.6% Renter occupiedHouse owners and renters - American Indian / Alaska Native residents 3 100.0% Renter occupiedHouse owners and renters - Asian residents 36 31.9% Owner occupied77 68.1% Renter occupiedHouse owners and renters - Native Hawaiian / Pacific Islander residents 37 100.0% Owner occupiedHouse owners and renters - Other race residents 464 86.6% Owner occupied71 13.4% Renter occupiedHouse owners and renters - Two or more races residents 811 49.5% Owner occupied828 50.5% Renter occupiedHouse owners and renters - White alone residents 3,005 72.6% Owner occupied1,133 27.4% Renter occupiedHouse owners and renters - Hispanic or Latino residents 1,576 64.3% Owner occupied876 35.7% Renter occupied
Language usage in Portland
English speakers - Total 77.9% of residents of Portland speak English at home.
19.1% of residents speak Spanish at home 3,216 87.5% Speak English very well461 12.5% Speak English less than very well2.8% of residents speak other language at home 253 46.3% Speak English very well294 53.7% Speak English less than very well
English speakers - Born in the United States 91.1% of residents of Portland speak English at home.
6.8% of residents speak Spanish at home 276 92.6% Speak English very well22 7.4% Speak English less than very well1.9% of residents speak other language at home 84 100.0% Speak English very well
English speakers - Native, born elsewhere 67.6% of residents of Portland speak English at home.
20.2% of residents speak Spanish at home 43 100.0% Speak English very well13.1% of residents speak other language at home 28 100.0% Speak English less than very well
English speakers - Foreign-born 20.3% of residents of Portland speak English at home.
48.5% of residents speak Spanish at home 246 50.0% Speak English very well246 50.0% Speak English less than very well30.2% of residents speak other language at home 50 16.3% Speak English very well257 83.7% Speak English less than very well
White (Caucasian) - Speak only English Native:
100.0% (9,210)Foreign-born:
33.1% (45)
White (Caucasian) - Speak another language Native:
11.6% (1,069)Foreign-born:
71.5% (97)
Black or African American - Speak only English Native:
88.2% (244)Foreign-born:
62.9% (31)
Black or African American - Speak another language Native:
11.7% (32)Foreign-born:
32.2% (16)
American Indian / Alaska Native - Speak another language Native:
4.7% (3)Foreign-born:
98.9% (91)
Asian - Speak only English Native:
54.7% (115)Foreign-born:
11.4% (22)
Asian - Speak another language Native:
45.4% (95)Foreign-born:
88.6% (172)
Other race - Speak only English Native:
61.3% (832)Foreign-born:
26.5% (14)
Other race - Speak another language Native:
36.8% (499)Foreign-born:
14.1% (8)
Two or more races - Speak only English Native:
66.5% (3,169)Foreign-born:
14.6% (127)
Two or more races - Speak another language Native:
34.9% (1,663)Foreign-born:
67.3% (584)
White alone - Speak only English Native:
96.5% (8,986)Foreign-born:
87.7% (54)
White alone - Speak another language Native:
3.4% (318)Foreign-born:
12.5% (8)
Hispanic or Latino - Speak only English Native:
69.2% (5,099)Foreign-born:
11.2% (86)
Hispanic or Latino - Speak another language Native:
33.0% (2,432)Foreign-born:
68.6% (527)
Foreign-born residents in Portland 1,089 residents are foreign born (3.9% Latin America , 0.9% Asia ).
This city:
5.3%Texas:
17.1%
Marital status for residents in Portland Marital status - White (Caucasian) population 15 years and over
Males 30.5% Never married53.4% Now married0.8% Separated2.6% Widowed12.7% DivorcedFemales 25.2% Never married51.7% Now married1.7% Separated9.7% Widowed11.7% DivorcedWomen who gave birth in the past 12 months Now married:
100.0% (109)Unmarried:
0.0% (0)
Women who did not give birth in the past 12 months Now married:
48.1% (968)Unmarried:
51.9% (1,045)
Marital status - Black or African American population 15 years and over
Males 14.4% Never married57.7% Now married8.8% Separated19.1% Widowed0.0% DivorcedFemales 34.9% Never married65.1% Now married0.0% Separated0.0% Widowed0.0% DivorcedWomen who gave birth in the past 12 months Now married:
0.0% (0)Unmarried:
100.0% (12)
Women who did not give birth in the past 12 months Now married:
48.0% (24)Unmarried:
52.0% (26)
Marital status - American Indian / Alaska Native population 15 years and over
Males 0.0% Never married100.0% Now married0.0% Separated0.0% Widowed0.0% DivorcedFemales 18.2% Never married81.8% Now married0.0% Separated0.0% Widowed0.0% DivorcedWomen who gave birth in the past 12 months Now married:
100.0% (30)Unmarried:
0.0% (0)
Women who did not give birth in the past 12 months Now married:
0.0% (0)Unmarried:
100.0% (26)
Marital status - Asian population 15 years and over
Males 31.5% Never married64.6% Now married0.0% Separated0.0% Widowed3.8% DivorcedFemales 9.4% Never married78.7% Now married0.0% Separated2.4% Widowed9.4% DivorcedWomen who gave birth in the past 12 months Now married:
0.0% (0)Unmarried:
100.0% (13)
Women who did not give birth in the past 12 months Now married:
76.5% (42)Unmarried:
23.5% (13)
Marital status - Native Hawaiian / Pacific Islander population 15 years and over
Males 0.0% Never married100.0% Now married0.0% Separated0.0% Widowed0.0% DivorcedFemales 0.0% Never married100.0% Now married0.0% Separated0.0% Widowed0.0% DivorcedWomen who did not give birth in the past 12 months Now married:
100.0% (16)Unmarried:
0.0% (0)
Marital status - Other race population 15 years and over
Males 38.7% Never married60.7% Now married0.0% Separated0.6% Widowed0.0% DivorcedFemales 14.6% Never married76.6% Now married0.0% Separated0.0% Widowed8.8% DivorcedWomen who gave birth in the past 12 months Now married:
100.0% (10)Unmarried:
0.0% (0)
Women who did not give birth in the past 12 months Now married:
79.0% (191)Unmarried:
21.0% (51)
Marital status - Two or more races population 15 years and over
Males 46.0% Never married35.2% Now married0.0% Separated0.0% Widowed18.8% DivorcedFemales 33.8% Never married40.6% Now married3.6% Separated4.4% Widowed17.5% DivorcedWomen who gave birth in the past 12 months Now married:
100.0% (277)Unmarried:
0.0% (0)
Women who did not give birth in the past 12 months Now married:
38.3% (632)Unmarried:
61.7% (1,018)
Marital status - White alone, not Hispanic / Latino population 15 years and over
Males 28.0% Never married59.9% Now married0.3% Separated3.9% Widowed7.8% DivorcedFemales 16.9% Never married54.6% Now married1.3% Separated13.1% Widowed14.0% DivorcedWomen who gave birth in the past 12 months Now married:
100.0% (143)Unmarried:
0.0% (0)
Women who did not give birth in the past 12 months Now married:
57.9% (1,167)Unmarried:
42.1% (849)
Marital status - Hispanic or Latino population 15 years and over
Males 38.7% Never married42.4% Now married1.1% Separated0.2% Widowed17.7% DivorcedFemales 37.3% Never married48.8% Now married2.9% Separated3.0% Widowed8.1% DivorcedWomen who gave birth in the past 12 months Now married:
100.0% (178)Unmarried:
0.0% (0)
Women who did not give birth in the past 12 months Now married:
39.5% (820)Unmarried:
60.5% (1,256)
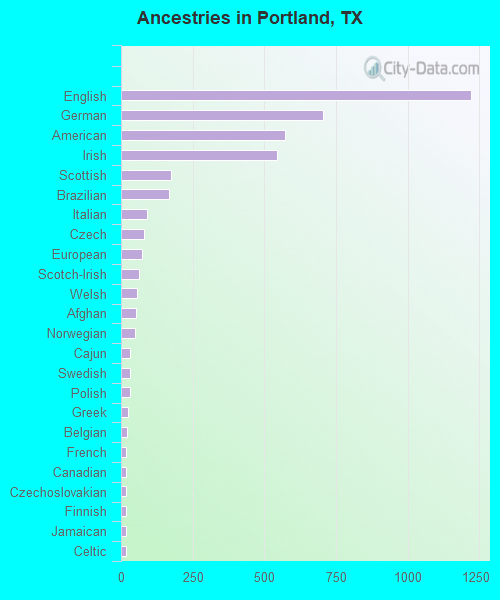
Ancestries in Portland
1,223 10.5% English705 6.1% German574 4.9% American543 4.7% Irish176 1.5% Scottish168 1.4% Brazilian91 0.8% Italian79 0.7% Czech74 0.6% European63 0.5% Scotch-Irish56 0.5% Welsh54 0.5% Afghan48 0.4% Norwegian31 0.3% Cajun31 0.3% Swedish30 0.3% Polish23 0.2% Greek21 0.2% Belgian19 0.2% French18 0.2% Canadian18 0.2% Czechoslovakian18 0.2% Finnish17 0.1% Jamaican16 0.1% Celtic10 0.09% Danish9 0.08% Ukrainian9 0.08% Slovak9 0.08% French Canadian8 0.07% African7 0.06% British6 0.05% Swiss6 0.05% Nigerian4 0.03% Croatian3 0.03% Lebanese3 0.03% West Indian
Geographical mobility in Portland Same house 1 year ago 8,675 87.9% White (Caucasian)206 63.1% Black or African American20 13.2% American Indian / Alaska Native219 55.4% Asian81 98.2% Native Hawaiian / Pacific Islander773 80.7% Other race2,580 55.0% Two or more races8,834 89.1% White alone, not Hispanic / Latino5,946 68.9% Hispanic or LatinoMoved within same county 1,040 10.5% White / Caucasian61 41.1% American Indian / Alaska Native132 33.4% Asian86 9.0% Other race1,622 34.6% Two or more races273 2.8% White alone, not Hispanic / Latino2,098 24.3% Hispanic or LatinoMoved within same state 990 10.0% White / Caucasian110 33.6% Black or African American47 32.0% American Indian / Alaska Native13 3.3% Asian90 9.4% Other race96 2.0% Two or more races364 3.7% White alone, not Hispanic / Latino266 3.1% Hispanic or LatinoMoved from different state 130 1.3% White / Caucasian115 1.2% White alone, not Hispanic / Latino13 0.1% Hispanic or LatinoMoved from abroad 17 0.2% White14 4.4% Black or African American15 3.8% Asian443 9.5% Two or more races25 0.3% White alone, not Hispanic / Latino264 3.1% Hispanic or Latino
Children Nativity (place of birth) in Portland
Children under 6 years - Living with two parents Both parents native 915 100.0% NativeBoth parents foreign-born 10 11.6% Native80 88.4% Foreign-bornOne native, one foreign-born parent 46 100.0% NativeChildren under 6 years - Living with one parent Native parent 675 100.0% NativeChildren 6 to 17 years - Living with two parents Both parents native 1,917 100.0% Native1 0.0% Foreign-bornBoth parents foreign-born 28 19.8% Native113 80.2% Foreign-bornOne native, one foreign-born parent 153 100.0% NativeChildren 6 to 17 years - Living with one parent Native parent 1,153 100.0% Native
Grandparents responsible for own grandchildren in Portland
Grandparents (30 to 59 years) White / Caucasian 10 10.4% Responsible for grandchildren87 89.6% Not responsible for grandchildrenTwo or more races 163 100.0% Responsible for grandchildrenWhite alone, not Hispanic / Latino 25 100.0% Not responsible for grandchildrenHispanic or Latino 111 50.5% Responsible for grandchildren109 49.5% Not responsible for grandchildrenGrandparents (60 years and over) White / Caucasian 22 23.0% Responsible for grandchildren72 77.0% Not responsible for grandchildrenTwo or more races 60 100.0% Not responsible for grandchildrenWhite alone, not Hispanic / Latino 26 30.6% Responsible for grandchildren58 69.4% Not responsible for grandchildrenHispanic or Latino 12 14.1% Responsible for grandchildren75 85.9% Not responsible for grandchildren