Races in Pottstown, Pennsylvania (PA) Detailed Stats
Data:
Races - White alone (%)
Races - White alone (% change since 2000)
Races - Black alone (%)
Races - Black alone (% change since 2000)
Races - American Indian alone (%)
Races - American Indian alone (% change since 2000)
Races - Asian alone (%)
Races - Asian alone (% change since 2000)
Races - Hispanic (%)
Races - Hispanic (% change since 2000)
Races - Native Hawaiian and Other Pacific Islander alone (%)
Races - Native Hawaiian and Other Pacific Islander alone (% change since 2000)
Races - Two or more races(%)
Races - Two or more races(% change since 2000)
Races - Other race alone (%)
Races - Other race alone (% change since 2000)
Racial diversity
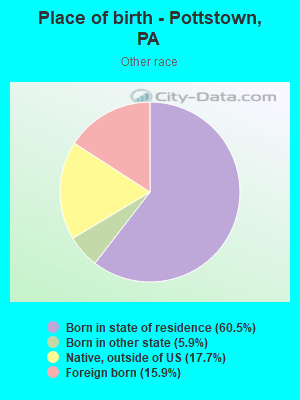
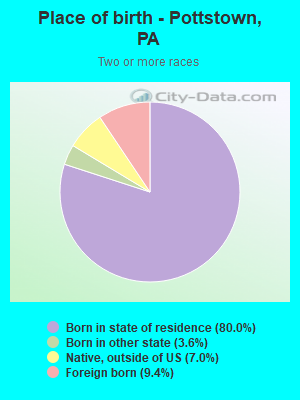
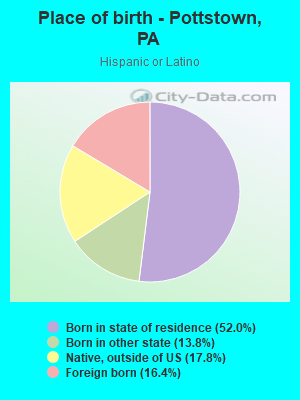
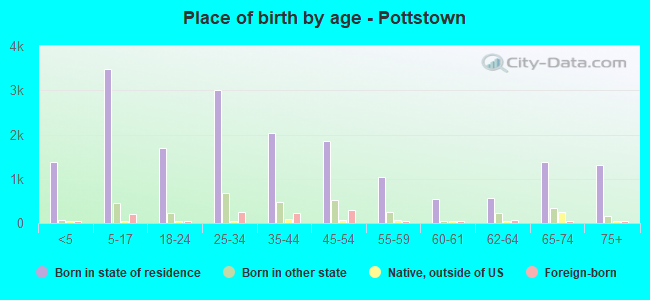
Place of birth - Born in state of residence (%)
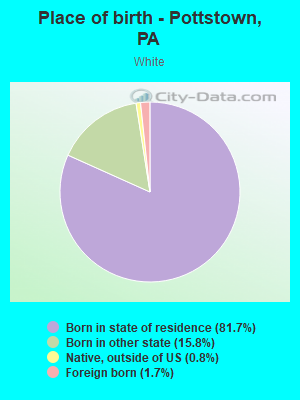
Place of birth - Born in state of residence (%) - White
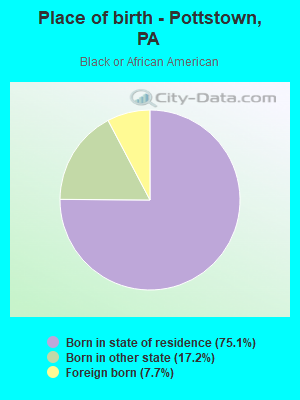
Place of birth - Born in state of residence (%) - Black or African American
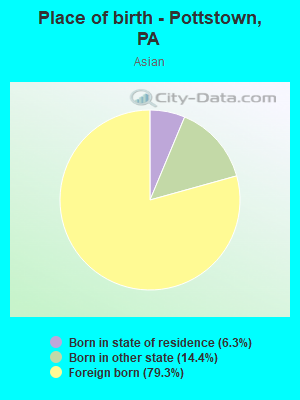
Place of birth - Born in state of residence (%) - Asian
Place of birth - Born in state of residence (%) - Hispanic or Latino
Place of birth - Born in state of residence (%) - American Indian and Alaska Native
Place of birth - Born in state of residence (%) - Multirace
Place of birth - Born in state of residence (%) - Other Race
Place of birth - Born in other state (%)
Place of birth - Born in other state (%) - White
Place of birth - Born in other state (%) - Black or African American
Place of birth - Born in other state (%) - Asian
Place of birth - Born in other state (%) - Hispanic or Latino
Place of birth - Born in other state (%) - American Indian and Alaska Native
Place of birth - Born in other state (%) - Multirace
Place of birth - Born in other state (%) - Other Race
Place of birth - Native, outside of US (%)
Place of birth - Native, outside of US (%) - White
Place of birth - Native, outside of US (%) - Black or African American
Place of birth - Native, outside of US (%) - Asian
Place of birth - Native, outside of US (%) - Hispanic or Latino
Place of birth - Native, outside of US (%) - American Indian and Alaska Native
Place of birth - Native, outside of US (%) - Multirace
Place of birth - Native, outside of US (%) - Other Race
Place of birth - Foreign born (%)
Place of birth - Foreign born (%) - White
Place of birth - Foreign born (%) - Black or African American
Place of birth - Foreign born (%) - Asian
Place of birth - Foreign born (%) - Hispanic or Latino
Place of birth - Foreign born (%) - American Indian and Alaska Native
Place of birth - Foreign born (%) - Multirace
Place of birth - Foreign born (%) - Other Race
Residents speaking English at home (%)
Residents speaking English at home - Born in the United States (%)
Residents speaking English at home - Native, born elsewhere (%)
Residents speaking English at home - Foreign born (%)
Residents speaking Spanish at home (%)
Residents speaking Spanish at home - Born in the United States (%)
Residents speaking Spanish at home - Native, born elsewhere (%)
Residents speaking Spanish at home - Foreign born (%)
Residents speaking other language at home (%)
Residents speaking other language at home - Born in the United States (%)
Residents speaking other language at home - Native, born elsewhere (%)
Residents speaking other language at home - Foreign born (%)
Marital status - Never married (%)
Marital status - Now married (%)
Marital status - Separated (%)
Marital status - Widowed (%)
Marital status - Divorced (%)
Ancestries Reported - Arab (%)
Ancestries Reported - Czech (%)
Ancestries Reported - Danish (%)
Ancestries Reported - Dutch (%)
Ancestries Reported - English (%)
Ancestries Reported - French (%)
Ancestries Reported - French Canadian (%)
Ancestries Reported - German (%)
Ancestries Reported - Greek (%)
Ancestries Reported - Hungarian (%)
Ancestries Reported - Irish (%)
Ancestries Reported - Italian (%)
Ancestries Reported - Lithuanian (%)
Ancestries Reported - Norwegian (%)
Ancestries Reported - Polish (%)
Ancestries Reported - Portuguese (%)
Ancestries Reported - Russian (%)
Ancestries Reported - Scotch-Irish (%)
Ancestries Reported - Scottish (%)
Ancestries Reported - Slovak (%)
Ancestries Reported - Subsaharan African (%)
Ancestries Reported - Swedish (%)
Ancestries Reported - Swiss (%)
Ancestries Reported - Ukrainian (%)
Ancestries Reported - United States (%)
Ancestries Reported - Welsh (%)
Ancestries Reported - West Indian (%)
Ancestries Reported - Other (%)
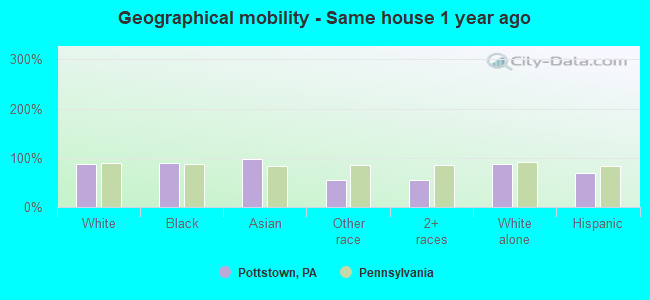
Geographical mobility - Same house 1 year ago (%)
Geographical mobility - Same house 1 year ago (%) - White
Geographical mobility - Same house 1 year ago (%) - Black or African American
Geographical mobility - Same house 1 year ago (%) - Asian
Geographical mobility - Same house 1 year ago (%) - Hispanic or Latino
Geographical mobility - Same house 1 year ago (%) - American Indian and Alaska Native
Geographical mobility - Same house 1 year ago (%) - Multirace
Geographical mobility - Same house 1 year ago (%) - Other Race
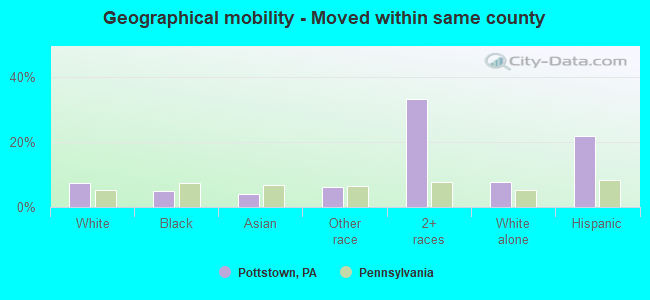
Geographical mobility - Moved within same county (%)
Geographical mobility - Moved within same county (%) - White
Geographical mobility - Moved within same county (%) - Black or African American
Geographical mobility - Moved within same county (%) - Asian
Geographical mobility - Moved within same county (%) - Hispanic or Latino
Geographical mobility - Moved within same county (%) - American Indian and Alaska Native
Geographical mobility - Moved within same county (%) - Multirace
Geographical mobility - Moved within same county (%) - Other Race
Geographical mobility - Moved from different county within same state (%)
Geographical mobility - Moved from different county within same state (%) - White
Geographical mobility - Moved from different county within same state (%) - Black or African American
Geographical mobility - Moved from different county within same state (%) - Asian
Geographical mobility - Moved from different county within same state (%) - Hispanic or Latino
Geographical mobility - Moved from different county within same state (%) - American Indian and Alaska Native
Geographical mobility - Moved from different county within same state (%) - Multirace
Geographical mobility - Moved from different county within same state (%) - Other Race
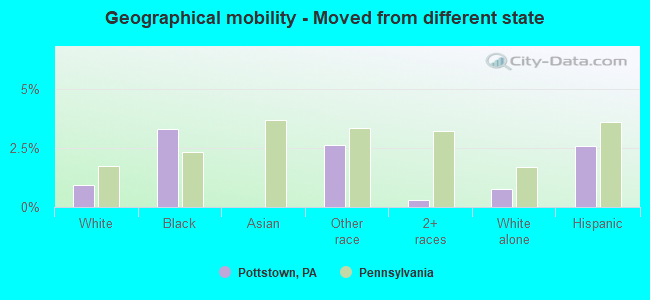
Geographical mobility - Moved from different state (%)
Geographical mobility - Moved from different state (%) - White
Geographical mobility - Moved from different state (%) - Black or African American
Geographical mobility - Moved from different state (%) - Asian
Geographical mobility - Moved from different state (%) - Hispanic or Latino
Geographical mobility - Moved from different state (%) - American Indian and Alaska Native
Geographical mobility - Moved from different state (%) - Multirace
Geographical mobility - Moved from different state (%) - Other Race
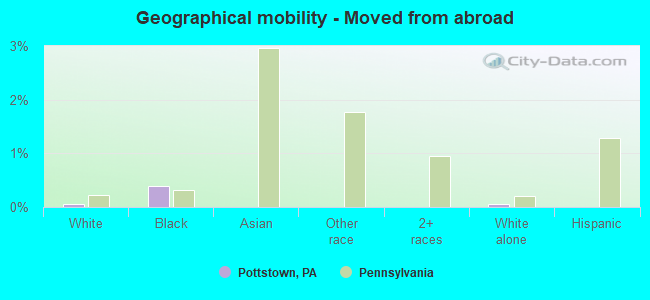
Geographical mobility - Moved from abroad (%)
Geographical mobility - Moved from abroad (%) - White
Geographical mobility - Moved from abroad (%) - Black or African American
Geographical mobility - Moved from abroad (%) - Asian
Geographical mobility - Moved from abroad (%) - Hispanic or Latino
Geographical mobility - Moved from abroad (%) - American Indian and Alaska Native
Geographical mobility - Moved from abroad (%) - Multirace
Geographical mobility - Moved from abroad (%) - Other Race
Place of birth for the foreign-born population - Ireland (%)
Place of birth for the foreign-born population - Denmark (%)
Place of birth for the foreign-born population - Norway (%)
Place of birth for the foreign-born population - Sweden (%)
Place of birth for the foreign-born population - United Kingdom (%)
Place of birth for the foreign-born population - England (%)
Place of birth for the foreign-born population - Scotland (%)
Place of birth for the foreign-born population - Other Northern Europe (%)
Place of birth for the foreign-born population - Austria (%)
Place of birth for the foreign-born population - Belgium (%)
Place of birth for the foreign-born population - France (%)
Place of birth for the foreign-born population - Germany (%)
Place of birth for the foreign-born population - Netherlands (%)
Place of birth for the foreign-born population - Switzerland (%)
Place of birth for the foreign-born population - Other Western Europe (%)
Place of birth for the foreign-born population - Greece (%)
Place of birth for the foreign-born population - Italy (%)
Place of birth for the foreign-born population - Portugal (%)
Place of birth for the foreign-born population - Spain (%)
Place of birth for the foreign-born population - Other Southern Europe (%)
Place of birth for the foreign-born population - Albania (%)
Place of birth for the foreign-born population - Belarus (%)
Place of birth for the foreign-born population - Bosnia and Herzegovina (%)
Place of birth for the foreign-born population - Bulgaria (%)
Place of birth for the foreign-born population - Croatia (%)
Place of birth for the foreign-born population - Czechoslovakia (%)
Place of birth for the foreign-born population - Hungary (%)
Place of birth for the foreign-born population - Latvia (%)
Place of birth for the foreign-born population - Lithuania (%)
Place of birth for the foreign-born population - North Macedonia (Macedonia) (%)
Place of birth for the foreign-born population - Moldova (%)
Place of birth for the foreign-born population - Poland (%)
Place of birth for the foreign-born population - Romania (%)
Place of birth for the foreign-born population - Russia (%)
Place of birth for the foreign-born population - Serbia (%)
Place of birth for the foreign-born population - Ukraine (%)
Place of birth for the foreign-born population - Other Eastern Europe (%)
Place of birth for the foreign-born population - China (%)
Place of birth for the foreign-born population - Hong Kong (%)
Place of birth for the foreign-born population - Taiwan (%)
Place of birth for the foreign-born population - Japan (%)
Place of birth for the foreign-born population - Korea (%)
Place of birth for the foreign-born population - Other Eastern Asia (%)
Place of birth for the foreign-born population - Afghanistan (%)
Place of birth for the foreign-born population - Bangladesh (%)
Place of birth for the foreign-born population - India (%)
Place of birth for the foreign-born population - Iran (%)
Place of birth for the foreign-born population - Kazakhstan (%)
Place of birth for the foreign-born population - Nepal (%)
Place of birth for the foreign-born population - Pakistan (%)
Place of birth for the foreign-born population - Sri Lanka (%)
Place of birth for the foreign-born population - Uzbekistan (%)
Place of birth for the foreign-born population - Other South Central Asia (%)
Place of birth for the foreign-born population - Burma (%)
Place of birth for the foreign-born population - Cambodia (%)
Place of birth for the foreign-born population - Indonesia (%)
Place of birth for the foreign-born population - Laos (%)
Place of birth for the foreign-born population - Malaysia (%)
Place of birth for the foreign-born population - Philippines (%)
Place of birth for the foreign-born population - Singapore (%)
Place of birth for the foreign-born population - Thailand (%)
Place of birth for the foreign-born population - Vietnam (%)
Place of birth for the foreign-born population - Other South Eastern Asia (%)
Place of birth for the foreign-born population - Armenia (%)
Place of birth for the foreign-born population - Iraq (%)
Place of birth for the foreign-born population - Israel (%)
Place of birth for the foreign-born population - Jordan (%)
Place of birth for the foreign-born population - Kuwait (%)
Place of birth for the foreign-born population - Lebanon (%)
Place of birth for the foreign-born population - Saudi Arabia (%)
Place of birth for the foreign-born population - Syria (%)
Place of birth for the foreign-born population - Turkey (%)
Place of birth for the foreign-born population - Yemen (%)
Place of birth for the foreign-born population - Other Western Asia (%)
Place of birth for the foreign-born population - Eritrea (%)
Place of birth for the foreign-born population - Ethiopia (%)
Place of birth for the foreign-born population - Kenya (%)
Place of birth for the foreign-born population - Somalia (%)
Place of birth for the foreign-born population - Uganda (%)
Place of birth for the foreign-born population - Zimbabwe (%)
Place of birth for the foreign-born population - Other Eastern Africa (%)
Place of birth for the foreign-born population - Cameroon (%)
Place of birth for the foreign-born population - Congo (%)
Place of birth for the foreign-born population - Democratic Republic of Congo (Zaire) (%)
Place of birth for the foreign-born population - Other Middle Africa (%)
Place of birth for the foreign-born population - Egypt (%)
Place of birth for the foreign-born population - Morocco (%)
Place of birth for the foreign-born population - Sudan (%)
Place of birth for the foreign-born population - Other Northern Africa (%)
Place of birth for the foreign-born population - South Africa (%)
Place of birth for the foreign-born population - Other Southern Africa (%)
Place of birth for the foreign-born population - Cabo Verde (%)
Place of birth for the foreign-born population - Ghana (%)
Place of birth for the foreign-born population - Liberia (%)
Place of birth for the foreign-born population - Nigeria (%)
Place of birth for the foreign-born population - Senegal (%)
Place of birth for the foreign-born population - Sierra Leone (%)
Place of birth for the foreign-born population - Other Western Africa (%)
Place of birth for the foreign-born population - Australia (%)
Place of birth for the foreign-born population - New Zealand (%)
Place of birth for the foreign-born population - Fiji (%)
Place of birth for the foreign-born population - Micronesia (%)
Place of birth for the foreign-born population - Bahamas (%)
Place of birth for the foreign-born population - Barbados (%)
Place of birth for the foreign-born population - Cuba (%)
Place of birth for the foreign-born population - Dominica (%)
Place of birth for the foreign-born population - Dominican Republic (%)
Place of birth for the foreign-born population - Grenada (%)
Place of birth for the foreign-born population - Haiti (%)
Place of birth for the foreign-born population - Jamaica (%)
Place of birth for the foreign-born population - St. Vincent and the Grenadines (%)
Place of birth for the foreign-born population - Trinidad and Tobago (%)
Place of birth for the foreign-born population - West Indies (%)
Place of birth for the foreign-born population - Other Caribbean (%)
Place of birth for the foreign-born population - Belize (%)
Place of birth for the foreign-born population - Costa Rica (%)
Place of birth for the foreign-born population - El Salvador (%)
Place of birth for the foreign-born population - Guatemala (%)
Place of birth for the foreign-born population - Honduras (%)
Place of birth for the foreign-born population - Mexico (%)
Place of birth for the foreign-born population - Nicaragua (%)
Place of birth for the foreign-born population - Panama (%)
Place of birth for the foreign-born population - Other Central America (%)
Place of birth for the foreign-born population - Argentina (%)
Place of birth for the foreign-born population - Bolivia (%)
Place of birth for the foreign-born population - Brazil (%)
Place of birth for the foreign-born population - Chile (%)
Place of birth for the foreign-born population - Colombia (%)
Place of birth for the foreign-born population - Ecuador (%)
Place of birth for the foreign-born population - Guyana (%)
Place of birth for the foreign-born population - Peru (%)
Place of birth for the foreign-born population - Uruguay (%)
Place of birth for the foreign-born population - Venezuela (%)
Place of birth for the foreign-born population - Other South America (%)
Place of birth for the foreign-born population - Canada (%)
Place of birth for the foreign-born population - Other Northern America (%)
Place of birth for the foreign-born population - Other (%)
Latest news about races in Pottstown, PA collected exclusively by city-data.com from local newspapers, TV, and radio stations
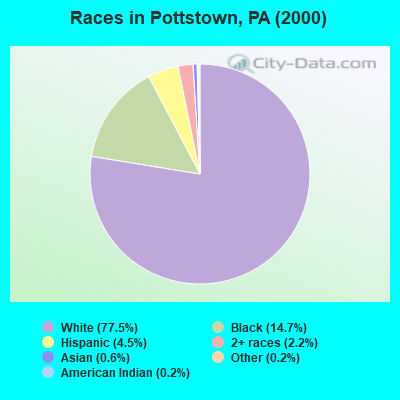
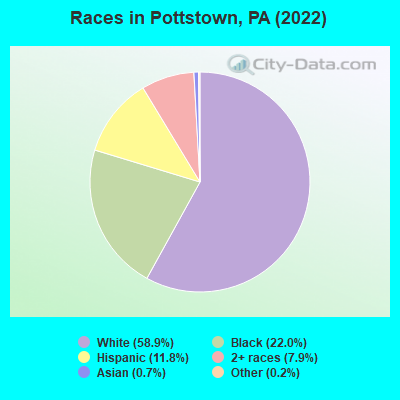
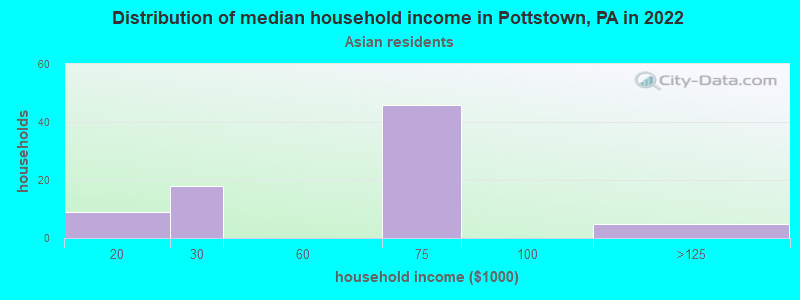
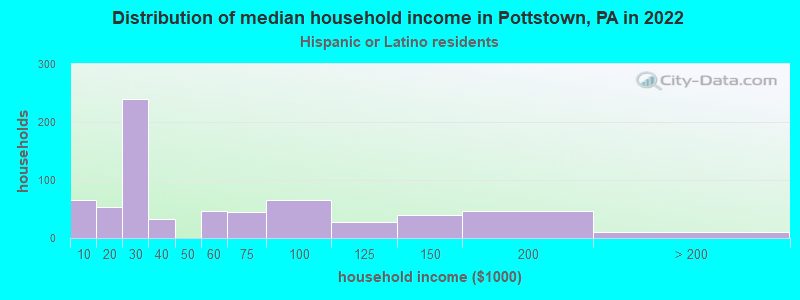
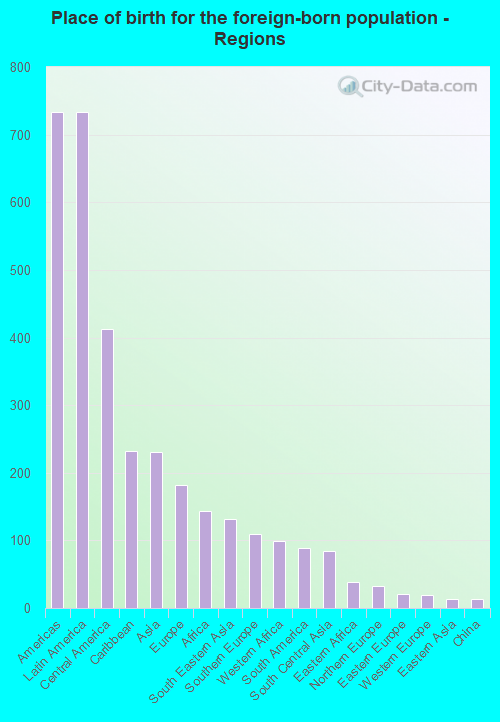
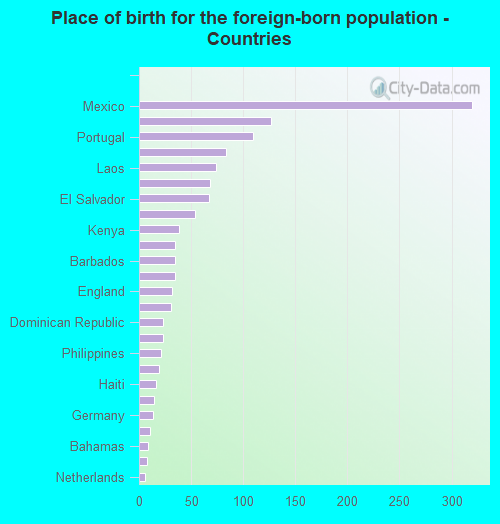
According to 2022 data, the most numerous races in Pottstown, PA are White alone (13,895 residents), Black alone (5,192 residents), and Hispanic (2,786 residents). 91.4% of Pottstown residents speak English at home. 5.5% of Pottstown, PA residents are foreign-born (3.0% born in Latin America, 0.9% born in Asia, 0.8% born in Europe, 0.6% born in Africa), which is 27.9% less than the foreign-born rate of 7.0% across the entire state of Pennsylvania.
Race distribution in Pottstown
2000 2022
10,322,455 84.1% White alone 1,202,437 9.8% Black alone 394,088 3.2% Hispanic 218,296 1.8% Asian alone 113,097 0.9% Two or more races 13,086 0.1% Other race alone 14,904 0.1% American Indian alone 2,691 0.02% Native Hawaiian and Other
9,487,228 73.1% White alone 1,311,581 10.1% Black alone 1,115,997 8.6% Hispanic 493,942 3.8% Two or more races 487,124 3.8% Asian alone 63,582 0.5% Other race alone 10,130 0.08% American Indian alone 2,424 0.02% Native Hawaiian and Other
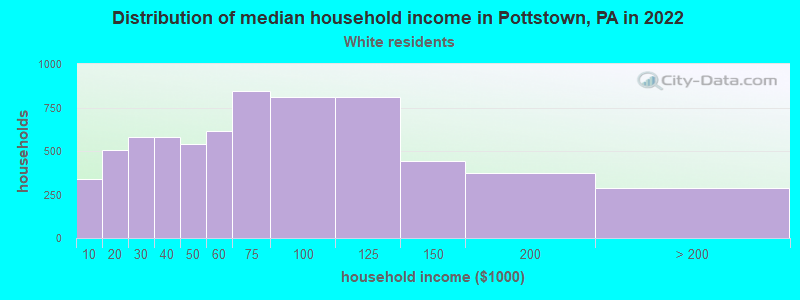
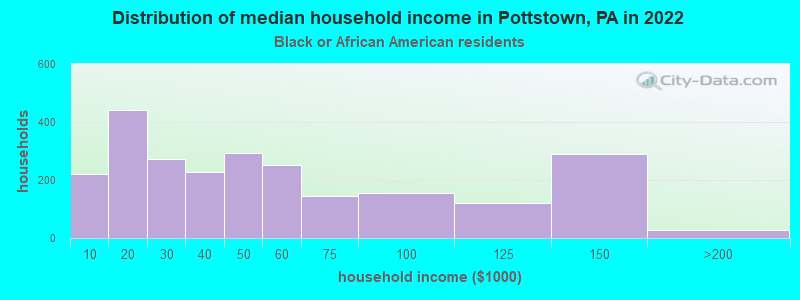
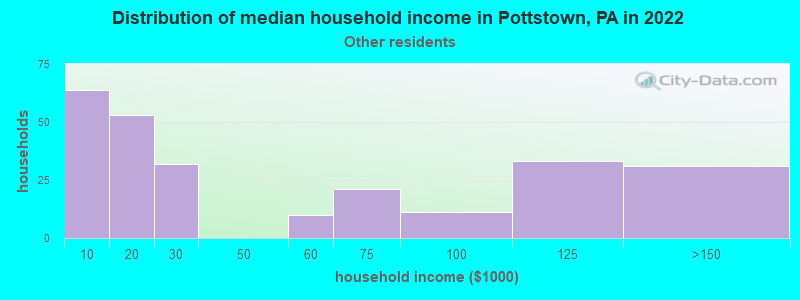
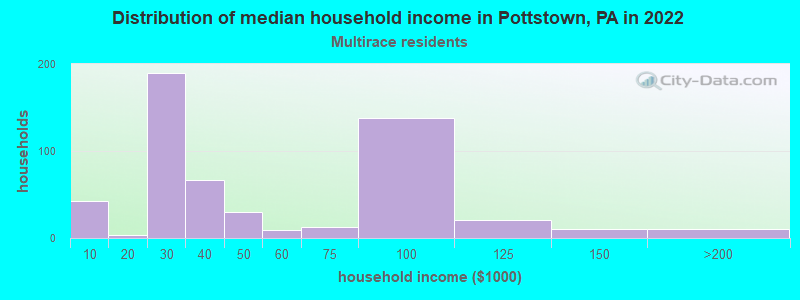
Income and house value in Pottstown Median household income in 2022 $62,315 White non-Hispanic householders$38,019 Black householders$73,891 Asian householders$34,421 Hispanic or Latino race householdersMedian 2022 house value $171,769 White Non-Hispanic householders$164,945 Black or African American householders$185,222 American Indian or Alaska Native householders $146,228 Asian householders$203,160 Some other race householders$135,505 Two or more races householders$174,109 Hispanic or Latino householders
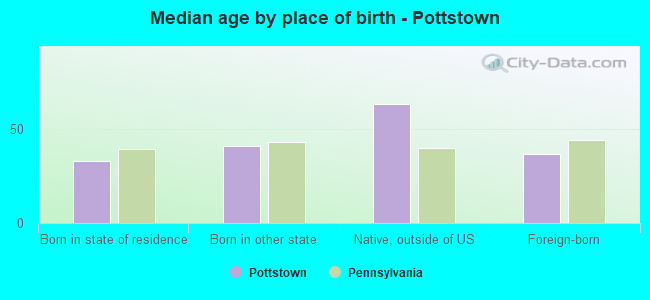
Median age by race in Pottstown
42.6 Median age for White residents42.0 44.6 30.8 Median age for Black or African American residents26.1 34.4 -626,180,836.1 Median age for American Indian / Alaska Native residents-1,098,934,549.9 -577,519,379.3 46.7 Median age for Asian residents47.0 31.4 -680,432,644.4 Median age for Native Hawaiian / Pacific Islander residents-649,523,808.9 -747,474,746.7 23.9 Median age for Other race residents25.7 15.7 12.0 Median age for Two or more races residents10.9 13.1 43.0 Median age for White alone residents41.9 45.2 20.5 Median age for Hispanic or Latino residents22.7 20.7
Owner/renter occupied households by race in Pottstown
House owners and renters - White residents 3,974 58.5% Owner occupied2,813 41.5% Renter occupiedHouse owners and renters - Black or African American residents 655 27.4% Owner occupied1,734 72.6% Renter occupiedHouse owners and renters - Asian residents 20 25.2% Owner occupied58 74.8% Renter occupiedHouse owners and renters - Other race residents 81 37.1% Owner occupied137 62.9% Renter occupiedHouse owners and renters - Two or more races residents 251 47.3% Owner occupied280 52.7% Renter occupiedHouse owners and renters - White alone residents 3,840 58.1% Owner occupied2,770 41.9% Renter occupiedHouse owners and renters - Hispanic or Latino residents 332 51.5% Owner occupied312 48.5% Renter occupied
Language usage in Pottstown
English speakers - Total 91.4% of residents of Pottstown speak English at home.
6.0% of residents speak Spanish at home 878 66.3% Speak English very well446 33.7% Speak English less than very well2.5% of residents speak other language at home 418 74.6% Speak English very well142 25.4% Speak English less than very well
English speakers - Born in the United States 93.6% of residents of Pottstown speak English at home.
5.6% of residents speak Spanish at home 183 95.3% Speak English very well9 4.7% Speak English less than very well0.3% of residents speak other language at home 9 100.0% Speak English less than very well
English speakers - Native, born elsewhere 12.9% of residents of Pottstown speak English at home.
89.5% of residents speak Spanish at home 316 70.2% Speak English very well134 29.8% Speak English less than very well
English speakers - Foreign-born 46.7% of residents of Pottstown speak English at home.
17.1% of residents speak Spanish at home 128 60.4% Speak English very well84 39.6% Speak English less than very well34.3% of residents speak other language at home 321 75.7% Speak English very well103 24.3% Speak English less than very well
White (Caucasian) - Speak only English Native:
97.4% (13,393)Foreign-born:
54.0% (129)
White (Caucasian) - Speak another language Native:
2.7% (367)Foreign-born:
48.2% (115)
Black or African American - Speak only English Native:
98.2% (4,387)Foreign-born:
56.3% (233)
Black or African American - Speak another language Native:
1.6% (73)Foreign-born:
43.7% (181)
Other race - Speak only English Native:
20.6% (143)Foreign-born:
23.4% (45)
Other race - Speak another language Native:
90.6% (629)Foreign-born:
92.5% (176)
Two or more races - Speak only English Native:
83.6% (2,120)Foreign-born:
91.2% (271)
Two or more races - Speak another language Native:
16.6% (420)Foreign-born:
6.7% (20)
White alone - Speak only English Native:
98.7% (13,121)Foreign-born:
62.6% (109)
White alone - Speak another language Native:
1.2% (158)Foreign-born:
36.3% (63)
Hispanic or Latino - Speak only English Native:
45.7% (878)Foreign-born:
41.8% (194)
Hispanic or Latino - Speak another language Native:
54.0% (1,037)Foreign-born:
51.0% (237)
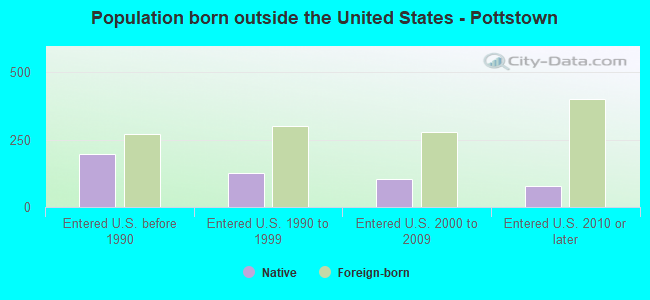
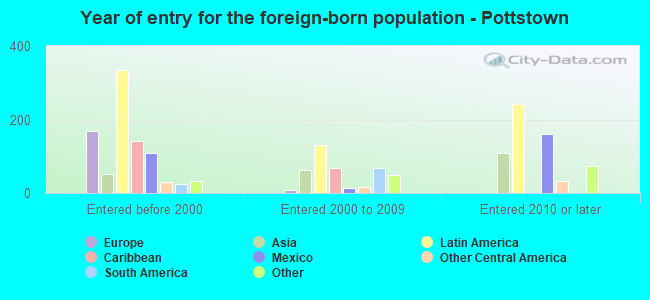
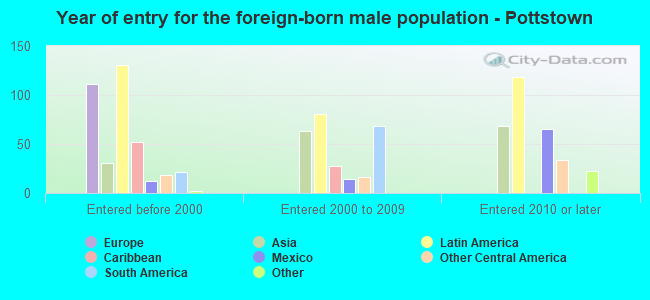
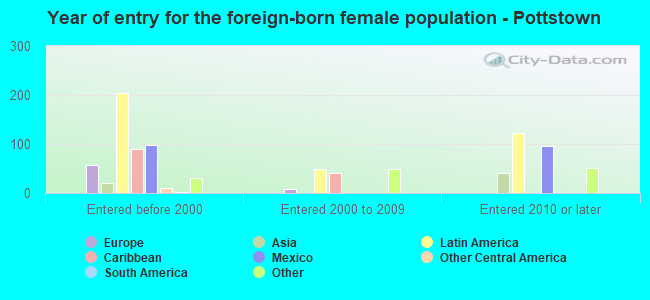
Foreign-born residents in Pottstown 1,291 residents are foreign born (3.0% Latin America , 0.9% Asia , 0.8% Europe , 0.6% Africa ).
This city:
5.5%Pennsylvania:
7.3%
Marital status for residents in Pottstown Marital status - White (Caucasian) population 15 years and over
Males 41.9% Never married40.2% Now married2.5% Separated1.1% Widowed14.2% DivorcedFemales 32.0% Never married39.0% Now married2.2% Separated11.9% Widowed14.9% DivorcedWomen who gave birth in the past 12 months Now married:
37.1% (42)Unmarried:
62.9% (71)
Women who did not give birth in the past 12 months Now married:
37.3% (1,262)Unmarried:
62.7% (2,117)
Marital status - Black or African American population 15 years and over
Males 48.9% Never married29.6% Now married5.6% Separated2.8% Widowed13.1% DivorcedFemales 53.7% Never married16.0% Now married11.3% Separated9.0% Widowed10.1% DivorcedWomen who gave birth in the past 12 months Now married:
0.0% (0)Unmarried:
100.0% (156)
Women who did not give birth in the past 12 months Now married:
24.0% (292)Unmarried:
76.0% (924)
Marital status - Asian population 15 years and over
Males 0.0% Never married80.6% Now married0.0% Separated0.0% Widowed19.4% DivorcedFemales 8.1% Never married91.9% Now married0.0% Separated0.0% Widowed0.0% DivorcedWomen who did not give birth in the past 12 months Now married:
87.5% (36)Unmarried:
12.5% (5)
Marital status - Other race population 15 years and over
Males 35.0% Never married53.3% Now married3.2% Separated6.2% Widowed2.2% DivorcedFemales 39.6% Never married60.4% Now married0.0% Separated0.0% Widowed0.0% DivorcedWomen who gave birth in the past 12 months Now married:
74.1% (51)Unmarried:
25.9% (18)
Women who did not give birth in the past 12 months Now married:
55.2% (100)Unmarried:
44.8% (81)
Marital status - Two or more races population 15 years and over
Males 55.3% Never married39.0% Now married2.6% Separated1.7% Widowed1.4% DivorcedFemales 45.2% Never married25.7% Now married0.0% Separated5.4% Widowed23.6% DivorcedWomen who gave birth in the past 12 months Now married:
0.0% (0)Unmarried:
100.0% (100)
Women who did not give birth in the past 12 months Now married:
20.6% (117)Unmarried:
79.4% (452)
Marital status - White alone, not Hispanic / Latino population 15 years and over
Males 41.6% Never married40.6% Now married1.9% Separated1.2% Widowed14.7% DivorcedFemales 31.7% Never married38.7% Now married2.2% Separated12.3% Widowed15.1% DivorcedWomen who gave birth in the past 12 months Now married:
41.7% (42)Unmarried:
58.3% (59)
Women who did not give birth in the past 12 months Now married:
36.6% (1,181)Unmarried:
63.4% (2,049)
Marital status - Hispanic or Latino population 15 years and over
Males 44.6% Never married41.7% Now married6.1% Separated2.5% Widowed5.1% DivorcedFemales 42.0% Never married51.6% Now married0.7% Separated0.0% Widowed5.7% DivorcedWomen who gave birth in the past 12 months Now married:
34.8% (43)Unmarried:
65.2% (80)
Women who did not give birth in the past 12 months Now married:
48.4% (217)Unmarried:
51.6% (231)
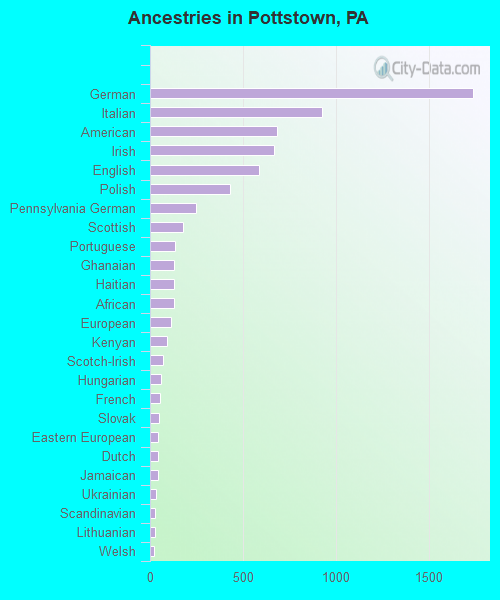
Ancestries in Pottstown
1,738 15.1% German928 8.1% Italian682 5.9% American665 5.8% Irish589 5.1% English429 3.7% Polish245 2.1% Pennsylvania German178 1.5% Scottish132 1.1% Portuguese131 1.1% Ghanaian130 1.1% Haitian129 1.1% African113 1.0% European90 0.8% Kenyan71 0.6% Scotch-Irish61 0.5% Hungarian56 0.5% French47 0.4% Slovak45 0.4% Eastern European44 0.4% Dutch44 0.4% Jamaican34 0.3% Ukrainian29 0.3% Scandinavian25 0.2% Lithuanian23 0.2% Welsh21 0.2% Czechoslovakian20 0.2% Egyptian18 0.2% Greek18 0.2% Russian16 0.1% Trinidadian and Tobagonian15 0.1% Syrian13 0.1% Swedish11 0.10% Slavic9 0.08% British9 0.08% Northern European4 0.03% Swiss
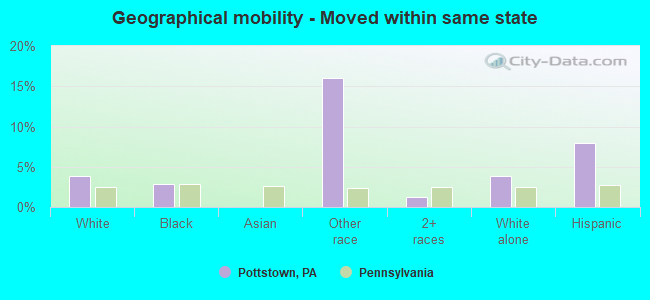
Geographical mobility in Pottstown Same house 1 year ago 12,625 88.0% White (Caucasian)4,730 88.8% Black or African American185 97.1% Asian503 54.8% Other race1,738 55.8% Two or more races12,159 87.9% White alone, not Hispanic / Latino1,759 68.5% Hispanic or LatinoMoved within same county 1,070 7.5% White / Caucasian270 5.1% Black or African American7 3.9% Asian57 6.2% Other race1,033 33.2% Two or more races1,053 7.6% White alone, not Hispanic / Latino560 21.8% Hispanic or LatinoMoved within same state 545 3.8% White / Caucasian150 2.8% Black or African American147 16.0% Other race37 1.2% Two or more races535 3.9% White alone, not Hispanic / Latino203 7.9% Hispanic or LatinoMoved from different state 132 0.9% White / Caucasian176 3.3% Black or African American24 2.6% Other race9 0.3% Two or more races107 0.8% White alone, not Hispanic / Latino66 2.6% Hispanic or LatinoMoved from abroad 7 0.0% White21 0.4% Black or African American8 0.1% White alone, not Hispanic / Latino
Children Nativity (place of birth) in Pottstown
Children under 6 years - Living with two parents Both parents native 540 100.0% NativeBoth parents foreign-born 35 100.0% NativeOne native, one foreign-born parent 19 100.0% NativeChildren under 6 years - Living with one parent Native parent 975 100.0% NativeForeign-born parent 125 100.0% NativeChildren 6 to 17 years - Living with two parents Both parents native 1,056 100.0% NativeBoth parents foreign-born 48 100.0% NativeOne native, one foreign-born parent 107 100.0% NativeChildren 6 to 17 years - Living with one parent Native parent 1,915 89.4% Native226 10.6% Foreign-bornForeign-born parent 259 64.8% Native140 35.2% Foreign-born
Grandparents responsible for own grandchildren in Pottstown
Grandparents (30 to 59 years) White / Caucasian 16 37.4% Responsible for grandchildren27 62.6% Not responsible for grandchildrenBlack or African American 79 100.0% Responsible for grandchildrenOther race 23 100.0% Responsible for grandchildrenTwo or more races 78 97.5% Responsible for grandchildren2 2.5% Not responsible for grandchildrenWhite alone, not Hispanic / Latino 17 40.8% Responsible for grandchildren25 59.2% Not responsible for grandchildrenHispanic or Latino 35 87.9% Responsible for grandchildren5 12.1% Not responsible for grandchildrenGrandparents (60 years and over) White / Caucasian 111 37.3% Responsible for grandchildren187 62.7% Not responsible for grandchildrenBlack or African American 17 19.2% Responsible for grandchildren74 80.8% Not responsible for grandchildrenOther race 25 100.0% Not responsible for grandchildrenWhite alone, not Hispanic / Latino 111 36.9% Responsible for grandchildren190 63.1% Not responsible for grandchildrenHispanic or Latino 26 100.0% Not responsible for grandchildren