Races in Quemado, New Mexico (NM) Detailed Stats
Ancestries, Foreign-born residents, place of birth

Data:
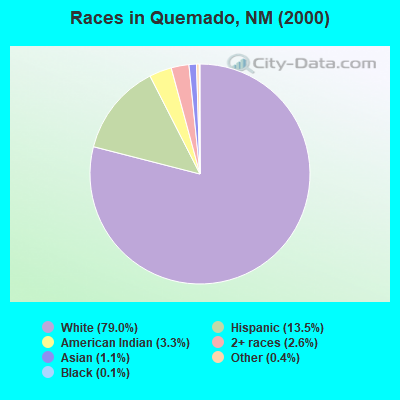
Race distribution in Quemado

- 1,26079.0%White alone
- 21513.5%Hispanic
- 523.3%American Indian alone
- 422.6%Two or more races
- 171.1%Asian alone
- 70.4%Other race alone
- 20.1%Black alone
2000
2022
-
- 813,49544.7%White alone
- 765,38642.1%Hispanic
- 161,4608.9%American Indian alone
- 30,6541.7%Black alone
- 25,7931.4%Two or more races
- 18,2571.0%Asian alone
- 3,0090.2%Other race alone
- 9920.05%Native Hawaiian and Other
Pacific Islander alone
-
- 1,059,86750.2%Hispanic
- 735,47834.8%White alone
- 171,8088.1%American Indian alone
- 65,0843.1%Two or more races
- 36,8701.7%Black alone
- 35,8701.7%Asian alone
- 7,5820.4%Other race alone
- 7850.04%Native Hawaiian and Other
Pacific Islander alone
Income and house value in Quemado
- Median household income in 2022
- $39,806White non-Hispanic householders
- $19,402American Indian and Alaska Native householders
- $35,678Some other race householders
- $77,605Two or more races householders
- $40,695Hispanic or Latino race householders
- Median 2022 house value
- $184,259White Non-Hispanic householders
- $97,549American Indian or Alaska Native householders
- $78,039Some other race householders
- $596,135Two or more races householders
- $83,675Hispanic or Latino householders