Races in Quinault Reservation, Washington (WA) Detailed Stats
Ancestries, Foreign-born residents, place of birth
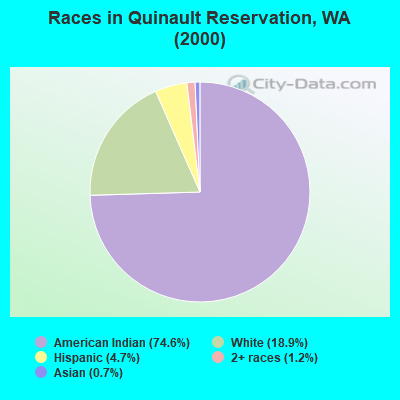
Race distribution in Quinault Reservation

- 87074.6%American Indian alone
- 22018.9%White alone
- 554.7%Hispanic
- 141.2%Two or more races
- 80.7%Asian alone
2000
2022
-
- 4,652,49078.9%White alone
- 441,5097.5%Hispanic
- 319,4015.4%Asian alone
- 184,6313.1%Black alone
- 175,9263.0%Two or more races
- 85,3961.4%American Indian alone
- 22,7790.4%Native Hawaiian and Other
Pacific Islander alone - 11,9890.2%Other race alone

-
- 4,941,45663.5%White alone
- 1,093,31314.0%Hispanic
- 755,8329.7%Asian alone
- 523,4486.7%Two or more races
- 299,5373.8%Black alone
- 69,0240.9%American Indian alone
- 52,2310.7%Native Hawaiian and Other
Pacific Islander alone - 50,9450.7%Other race alone

Income and house value in Quinault Reservation
- Median household income in 2022
- $65,921White non-Hispanic householders
- $44,127American Indian and Alaska Native householders
- $68,455Asian householders
- $45,040Some other race householders
- $52,040Two or more races householders
- $55,590Hispanic or Latino race householders
- Median 2022 house value
- $345,609White Non-Hispanic householders
- $225,691American Indian or Alaska Native householders
- $442,058Some other race householders
- $602,807Two or more races householders
- $415,374Hispanic or Latino householders
Household income for White non-Hispanic householders

Household income for American Indian and Alaska Native householders

Household income for Asian householders

Household income for Two or more races householders

Household income for Hispanic or Latino race householders
