Races in Randallstown, Maryland (MD) Detailed Stats
Data:
Races - White alone (%)
Races - White alone (% change since 2000)
Races - Black alone (%)
Races - Black alone (% change since 2000)
Races - American Indian alone (%)
Races - American Indian alone (% change since 2000)
Races - Asian alone (%)
Races - Asian alone (% change since 2000)
Races - Hispanic (%)
Races - Hispanic (% change since 2000)
Races - Native Hawaiian and Other Pacific Islander alone (%)
Races - Native Hawaiian and Other Pacific Islander alone (% change since 2000)
Races - Two or more races(%)
Races - Two or more races(% change since 2000)
Races - Other race alone (%)
Races - Other race alone (% change since 2000)
Racial diversity
Place of birth - Born in state of residence (%)
Place of birth - Born in state of residence (%) - White
Place of birth - Born in state of residence (%) - Black or African American
Place of birth - Born in state of residence (%) - Asian
Place of birth - Born in state of residence (%) - Hispanic or Latino
Place of birth - Born in state of residence (%) - American Indian and Alaska Native
Place of birth - Born in state of residence (%) - Multirace
Place of birth - Born in state of residence (%) - Other Race
Place of birth - Born in other state (%)
Place of birth - Born in other state (%) - White
Place of birth - Born in other state (%) - Black or African American
Place of birth - Born in other state (%) - Asian
Place of birth - Born in other state (%) - Hispanic or Latino
Place of birth - Born in other state (%) - American Indian and Alaska Native
Place of birth - Born in other state (%) - Multirace
Place of birth - Born in other state (%) - Other Race
Place of birth - Native, outside of US (%)
Place of birth - Native, outside of US (%) - White
Place of birth - Native, outside of US (%) - Black or African American
Place of birth - Native, outside of US (%) - Asian
Place of birth - Native, outside of US (%) - Hispanic or Latino
Place of birth - Native, outside of US (%) - American Indian and Alaska Native
Place of birth - Native, outside of US (%) - Multirace
Place of birth - Native, outside of US (%) - Other Race
Place of birth - Foreign born (%)
Place of birth - Foreign born (%) - White
Place of birth - Foreign born (%) - Black or African American
Place of birth - Foreign born (%) - Asian
Place of birth - Foreign born (%) - Hispanic or Latino
Place of birth - Foreign born (%) - American Indian and Alaska Native
Place of birth - Foreign born (%) - Multirace
Place of birth - Foreign born (%) - Other Race
Residents speaking English at home (%)
Residents speaking English at home - Born in the United States (%)
Residents speaking English at home - Native, born elsewhere (%)
Residents speaking English at home - Foreign born (%)
Residents speaking Spanish at home (%)
Residents speaking Spanish at home - Born in the United States (%)
Residents speaking Spanish at home - Native, born elsewhere (%)
Residents speaking Spanish at home - Foreign born (%)
Residents speaking other language at home (%)
Residents speaking other language at home - Born in the United States (%)
Residents speaking other language at home - Native, born elsewhere (%)
Residents speaking other language at home - Foreign born (%)
Marital status - Never married (%)
Marital status - Now married (%)
Marital status - Separated (%)
Marital status - Widowed (%)
Marital status - Divorced (%)
Ancestries Reported - Arab (%)
Ancestries Reported - Czech (%)
Ancestries Reported - Danish (%)
Ancestries Reported - Dutch (%)
Ancestries Reported - English (%)
Ancestries Reported - French (%)
Ancestries Reported - French Canadian (%)
Ancestries Reported - German (%)
Ancestries Reported - Greek (%)
Ancestries Reported - Hungarian (%)
Ancestries Reported - Irish (%)
Ancestries Reported - Italian (%)
Ancestries Reported - Lithuanian (%)
Ancestries Reported - Norwegian (%)
Ancestries Reported - Polish (%)
Ancestries Reported - Portuguese (%)
Ancestries Reported - Russian (%)
Ancestries Reported - Scotch-Irish (%)
Ancestries Reported - Scottish (%)
Ancestries Reported - Slovak (%)
Ancestries Reported - Subsaharan African (%)
Ancestries Reported - Swedish (%)
Ancestries Reported - Swiss (%)
Ancestries Reported - Ukrainian (%)
Ancestries Reported - United States (%)
Ancestries Reported - Welsh (%)
Ancestries Reported - West Indian (%)
Ancestries Reported - Other (%)
Geographical mobility - Same house 1 year ago (%)
Geographical mobility - Same house 1 year ago (%) - White
Geographical mobility - Same house 1 year ago (%) - Black or African American
Geographical mobility - Same house 1 year ago (%) - Asian
Geographical mobility - Same house 1 year ago (%) - Hispanic or Latino
Geographical mobility - Same house 1 year ago (%) - American Indian and Alaska Native
Geographical mobility - Same house 1 year ago (%) - Multirace
Geographical mobility - Same house 1 year ago (%) - Other Race
Geographical mobility - Moved within same county (%)
Geographical mobility - Moved within same county (%) - White
Geographical mobility - Moved within same county (%) - Black or African American
Geographical mobility - Moved within same county (%) - Asian
Geographical mobility - Moved within same county (%) - Hispanic or Latino
Geographical mobility - Moved within same county (%) - American Indian and Alaska Native
Geographical mobility - Moved within same county (%) - Multirace
Geographical mobility - Moved within same county (%) - Other Race
Geographical mobility - Moved from different county within same state (%)
Geographical mobility - Moved from different county within same state (%) - White
Geographical mobility - Moved from different county within same state (%) - Black or African American
Geographical mobility - Moved from different county within same state (%) - Asian
Geographical mobility - Moved from different county within same state (%) - Hispanic or Latino
Geographical mobility - Moved from different county within same state (%) - American Indian and Alaska Native
Geographical mobility - Moved from different county within same state (%) - Multirace
Geographical mobility - Moved from different county within same state (%) - Other Race
Geographical mobility - Moved from different state (%)
Geographical mobility - Moved from different state (%) - White
Geographical mobility - Moved from different state (%) - Black or African American
Geographical mobility - Moved from different state (%) - Asian
Geographical mobility - Moved from different state (%) - Hispanic or Latino
Geographical mobility - Moved from different state (%) - American Indian and Alaska Native
Geographical mobility - Moved from different state (%) - Multirace
Geographical mobility - Moved from different state (%) - Other Race
Geographical mobility - Moved from abroad (%)
Geographical mobility - Moved from abroad (%) - White
Geographical mobility - Moved from abroad (%) - Black or African American
Geographical mobility - Moved from abroad (%) - Asian
Geographical mobility - Moved from abroad (%) - Hispanic or Latino
Geographical mobility - Moved from abroad (%) - American Indian and Alaska Native
Geographical mobility - Moved from abroad (%) - Multirace
Geographical mobility - Moved from abroad (%) - Other Race
Place of birth for the foreign-born population - Ireland (%)
Place of birth for the foreign-born population - Denmark (%)
Place of birth for the foreign-born population - Norway (%)
Place of birth for the foreign-born population - Sweden (%)
Place of birth for the foreign-born population - United Kingdom (%)
Place of birth for the foreign-born population - England (%)
Place of birth for the foreign-born population - Scotland (%)
Place of birth for the foreign-born population - Other Northern Europe (%)
Place of birth for the foreign-born population - Austria (%)
Place of birth for the foreign-born population - Belgium (%)
Place of birth for the foreign-born population - France (%)
Place of birth for the foreign-born population - Germany (%)
Place of birth for the foreign-born population - Netherlands (%)
Place of birth for the foreign-born population - Switzerland (%)
Place of birth for the foreign-born population - Other Western Europe (%)
Place of birth for the foreign-born population - Greece (%)
Place of birth for the foreign-born population - Italy (%)
Place of birth for the foreign-born population - Portugal (%)
Place of birth for the foreign-born population - Spain (%)
Place of birth for the foreign-born population - Other Southern Europe (%)
Place of birth for the foreign-born population - Albania (%)
Place of birth for the foreign-born population - Belarus (%)
Place of birth for the foreign-born population - Bosnia and Herzegovina (%)
Place of birth for the foreign-born population - Bulgaria (%)
Place of birth for the foreign-born population - Croatia (%)
Place of birth for the foreign-born population - Czechoslovakia (%)
Place of birth for the foreign-born population - Hungary (%)
Place of birth for the foreign-born population - Latvia (%)
Place of birth for the foreign-born population - Lithuania (%)
Place of birth for the foreign-born population - North Macedonia (Macedonia) (%)
Place of birth for the foreign-born population - Moldova (%)
Place of birth for the foreign-born population - Poland (%)
Place of birth for the foreign-born population - Romania (%)
Place of birth for the foreign-born population - Russia (%)
Place of birth for the foreign-born population - Serbia (%)
Place of birth for the foreign-born population - Ukraine (%)
Place of birth for the foreign-born population - Other Eastern Europe (%)
Place of birth for the foreign-born population - China (%)
Place of birth for the foreign-born population - Hong Kong (%)
Place of birth for the foreign-born population - Taiwan (%)
Place of birth for the foreign-born population - Japan (%)
Place of birth for the foreign-born population - Korea (%)
Place of birth for the foreign-born population - Other Eastern Asia (%)
Place of birth for the foreign-born population - Afghanistan (%)
Place of birth for the foreign-born population - Bangladesh (%)
Place of birth for the foreign-born population - India (%)
Place of birth for the foreign-born population - Iran (%)
Place of birth for the foreign-born population - Kazakhstan (%)
Place of birth for the foreign-born population - Nepal (%)
Place of birth for the foreign-born population - Pakistan (%)
Place of birth for the foreign-born population - Sri Lanka (%)
Place of birth for the foreign-born population - Uzbekistan (%)
Place of birth for the foreign-born population - Other South Central Asia (%)
Place of birth for the foreign-born population - Burma (%)
Place of birth for the foreign-born population - Cambodia (%)
Place of birth for the foreign-born population - Indonesia (%)
Place of birth for the foreign-born population - Laos (%)
Place of birth for the foreign-born population - Malaysia (%)
Place of birth for the foreign-born population - Philippines (%)
Place of birth for the foreign-born population - Singapore (%)
Place of birth for the foreign-born population - Thailand (%)
Place of birth for the foreign-born population - Vietnam (%)
Place of birth for the foreign-born population - Other South Eastern Asia (%)
Place of birth for the foreign-born population - Armenia (%)
Place of birth for the foreign-born population - Iraq (%)
Place of birth for the foreign-born population - Israel (%)
Place of birth for the foreign-born population - Jordan (%)
Place of birth for the foreign-born population - Kuwait (%)
Place of birth for the foreign-born population - Lebanon (%)
Place of birth for the foreign-born population - Saudi Arabia (%)
Place of birth for the foreign-born population - Syria (%)
Place of birth for the foreign-born population - Turkey (%)
Place of birth for the foreign-born population - Yemen (%)
Place of birth for the foreign-born population - Other Western Asia (%)
Place of birth for the foreign-born population - Eritrea (%)
Place of birth for the foreign-born population - Ethiopia (%)
Place of birth for the foreign-born population - Kenya (%)
Place of birth for the foreign-born population - Somalia (%)
Place of birth for the foreign-born population - Uganda (%)
Place of birth for the foreign-born population - Zimbabwe (%)
Place of birth for the foreign-born population - Other Eastern Africa (%)
Place of birth for the foreign-born population - Cameroon (%)
Place of birth for the foreign-born population - Congo (%)
Place of birth for the foreign-born population - Democratic Republic of Congo (Zaire) (%)
Place of birth for the foreign-born population - Other Middle Africa (%)
Place of birth for the foreign-born population - Egypt (%)
Place of birth for the foreign-born population - Morocco (%)
Place of birth for the foreign-born population - Sudan (%)
Place of birth for the foreign-born population - Other Northern Africa (%)
Place of birth for the foreign-born population - South Africa (%)
Place of birth for the foreign-born population - Other Southern Africa (%)
Place of birth for the foreign-born population - Cabo Verde (%)
Place of birth for the foreign-born population - Ghana (%)
Place of birth for the foreign-born population - Liberia (%)
Place of birth for the foreign-born population - Nigeria (%)
Place of birth for the foreign-born population - Senegal (%)
Place of birth for the foreign-born population - Sierra Leone (%)
Place of birth for the foreign-born population - Other Western Africa (%)
Place of birth for the foreign-born population - Australia (%)
Place of birth for the foreign-born population - New Zealand (%)
Place of birth for the foreign-born population - Fiji (%)
Place of birth for the foreign-born population - Micronesia (%)
Place of birth for the foreign-born population - Bahamas (%)
Place of birth for the foreign-born population - Barbados (%)
Place of birth for the foreign-born population - Cuba (%)
Place of birth for the foreign-born population - Dominica (%)
Place of birth for the foreign-born population - Dominican Republic (%)
Place of birth for the foreign-born population - Grenada (%)
Place of birth for the foreign-born population - Haiti (%)
Place of birth for the foreign-born population - Jamaica (%)
Place of birth for the foreign-born population - St. Vincent and the Grenadines (%)
Place of birth for the foreign-born population - Trinidad and Tobago (%)
Place of birth for the foreign-born population - West Indies (%)
Place of birth for the foreign-born population - Other Caribbean (%)
Place of birth for the foreign-born population - Belize (%)
Place of birth for the foreign-born population - Costa Rica (%)
Place of birth for the foreign-born population - El Salvador (%)
Place of birth for the foreign-born population - Guatemala (%)
Place of birth for the foreign-born population - Honduras (%)
Place of birth for the foreign-born population - Mexico (%)
Place of birth for the foreign-born population - Nicaragua (%)
Place of birth for the foreign-born population - Panama (%)
Place of birth for the foreign-born population - Other Central America (%)
Place of birth for the foreign-born population - Argentina (%)
Place of birth for the foreign-born population - Bolivia (%)
Place of birth for the foreign-born population - Brazil (%)
Place of birth for the foreign-born population - Chile (%)
Place of birth for the foreign-born population - Colombia (%)
Place of birth for the foreign-born population - Ecuador (%)
Place of birth for the foreign-born population - Guyana (%)
Place of birth for the foreign-born population - Peru (%)
Place of birth for the foreign-born population - Uruguay (%)
Place of birth for the foreign-born population - Venezuela (%)
Place of birth for the foreign-born population - Other South America (%)
Place of birth for the foreign-born population - Canada (%)
Place of birth for the foreign-born population - Other Northern America (%)
Place of birth for the foreign-born population - Other (%)
Latest news about races in Randallstown, MD collected exclusively by city-data.com from local newspapers, TV, and radio stations
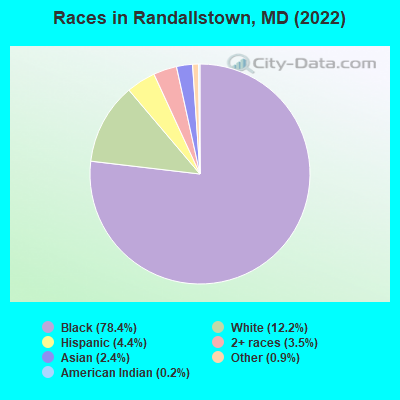
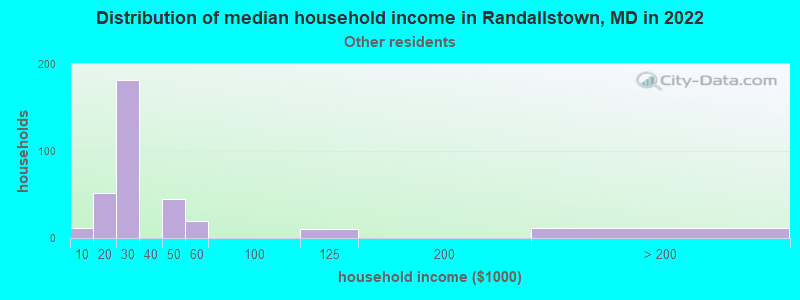
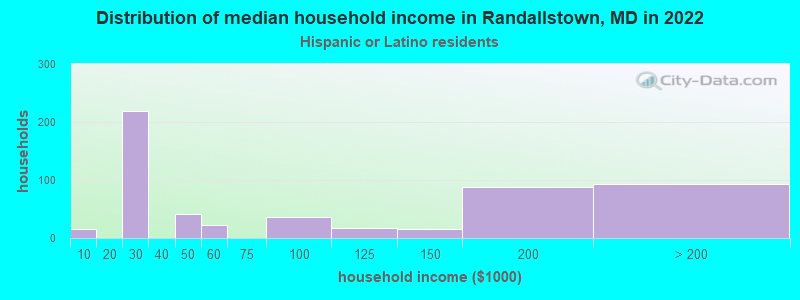
According to 2022 data, the most numerous races in Randallstown, MD are White alone (4,396 residents), Black alone (28,259 residents), and Hispanic (1,577 residents). 86.2% of Randallstown residents speak English at home. 15.5% of Randallstown, MD residents are foreign-born (8.2% born in Africa, 3.6% born in Latin America, 2.3% born in Asia), which is 3.2% less than the foreign-born rate of 16.0% across the entire state of Maryland.
Race distribution in Randallstown
2000 2022
3,286,547 62.1% White alone 1,464,735 27.7% Black alone 227,916 4.3% Hispanic 209,738 4.0% Asian alone 82,946 1.6% Two or more races 13,312 0.3% American Indian alone 9,379 0.2% Other race alone 1,913 0.04% Native Hawaiian and Other
2,906,492 47.1% White alone 1,800,914 29.2% Black alone 705,842 11.4% Hispanic 401,818 6.5% Asian alone 291,317 4.7% Two or more races 46,930 0.8% Other race alone 8,930 0.1% American Indian alone 2,417 0.04% Native Hawaiian and Other
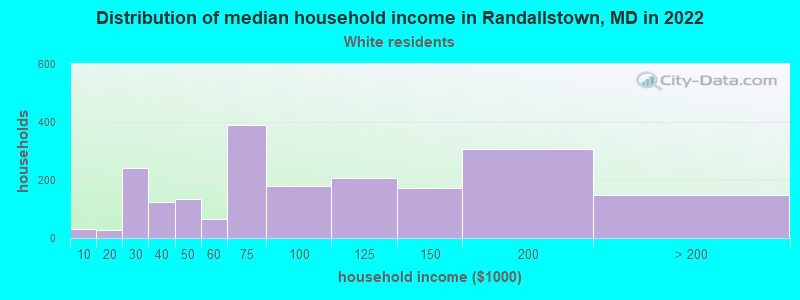
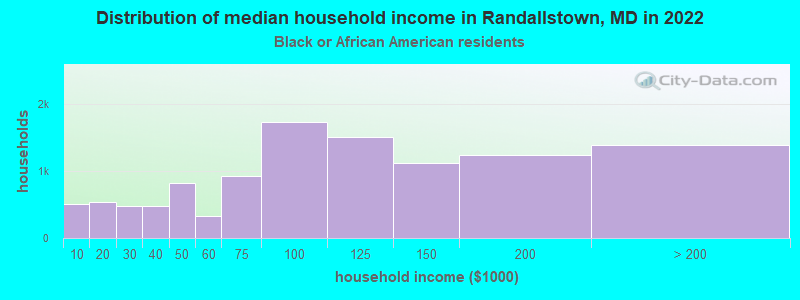
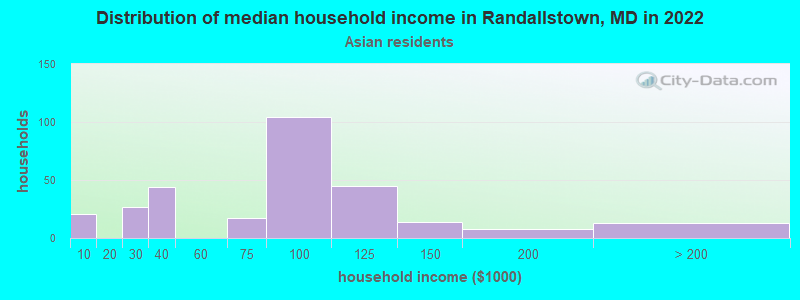
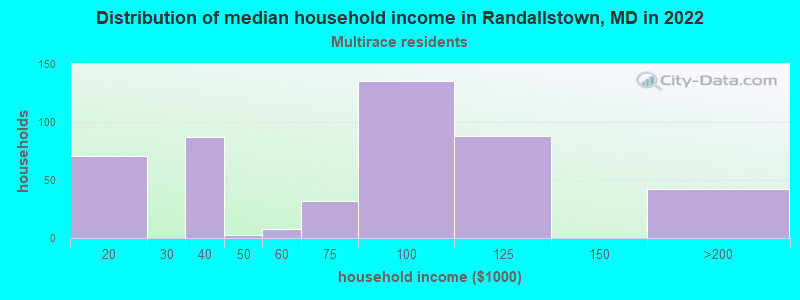
Income and house value in Randallstown Median household income in 2022 $71,743 White non-Hispanic householders$94,166 Black householders$83,368 Asian householders$21,555 Some other race householders$93,423 Two or more races householdersMedian 2022 house value $290,907 White Non-Hispanic householders$310,011 Black or African American householders$205,545 American Indian or Alaska Native householders $276,398 Asian householders$304,691 Some other race householders$292,116 Two or more races householders$331,291 Hispanic or Latino householders
Median age by race in Randallstown
54.6 Median age for White residents52.3 55.7 46.4 Median age for Black or African American residents45.1 47.1 87.7 Median age for American Indian / Alaska Native residents-867,632,849.4 78.0 37.9 Median age for Asian residents44.6 38.0 -1,541,125,539.6 Median age for Native Hawaiian / Pacific Islander residents-790,901,136.6 -760,942,760.2 42.0 Median age for Other race residents46.9 43.4 30.9 Median age for Two or more races residents26.0 38.2 55.1 Median age for White alone residents52.5 57.9 25.0 Median age for Hispanic or Latino residents24.4 39.3
Owner/renter occupied households by race in Randallstown
House owners and renters - White residents 1,469 72.8% Owner occupied550 27.2% Renter occupiedHouse owners and renters - Black or African American residents 9,334 79.6% Owner occupied2,390 20.4% Renter occupiedHouse owners and renters - American Indian / Alaska Native residents 45 100.0% Renter occupiedHouse owners and renters - Asian residents 217 78.0% Owner occupied61 22.0% Renter occupiedHouse owners and renters - Native Hawaiian / Pacific Islander residents 5 100.0% Owner occupiedHouse owners and renters - Other race residents 234 59.0% Owner occupied163 41.0% Renter occupiedHouse owners and renters - Two or more races residents 279 53.8% Owner occupied240 46.2% Renter occupiedHouse owners and renters - White alone residents 1,364 72.0% Owner occupied530 28.0% Renter occupiedHouse owners and renters - Hispanic or Latino residents 455 81.0% Owner occupied107 19.0% Renter occupied
Language usage in Randallstown
English speakers - Total 86.2% of residents of Randallstown speak English at home.
2.6% of residents speak Spanish at home 479 52.5% Speak English very well433 47.5% Speak English less than very well11.2% of residents speak other language at home 2,501 64.6% Speak English very well1,372 35.4% Speak English less than very well
English speakers - Born in the United States 96.9% of residents of Randallstown speak English at home.
2.9% of residents speak Spanish at home 176 80.7% Speak English very well42 19.3% Speak English less than very well1.0% of residents speak other language at home 76 100.0% Speak English very well
English speakers - Native, born elsewhere 89.4% of residents of Randallstown speak English at home.
10.9% of residents speak Spanish at home 16 22.2% Speak English very well56 77.8% Speak English less than very well7.4% of residents speak other language at home 49 100.0% Speak English less than very well
English speakers - Foreign-born 41.0% of residents of Randallstown speak English at home.
6.3% of residents speak Spanish at home 132 38.2% Speak English very well214 61.8% Speak English less than very well54.6% of residents speak other language at home 1,923 64.1% Speak English very well1,079 35.9% Speak English less than very well
White (Caucasian) - Speak only English Native:
94.8% (3,937)Foreign-born:
9.5% (33)
White (Caucasian) - Speak another language Native:
4.5% (188)Foreign-born:
88.8% (308)
Black or African American - Speak only English Native:
96.1% (22,857)Foreign-born:
47.5% (1,810)
Black or African American - Speak another language Native:
3.6% (845)Foreign-born:
53.0% (2,019)
Asian - Speak only English Native:
77.9% (93)Foreign-born:
51.5% (377)
Asian - Speak another language Native:
22.7% (27)Foreign-born:
53.7% (394)
Other race - Speak another language Native:
48.3% (284)Foreign-born:
100.0% (385)
Two or more races - Speak only English Native:
100.0% (1,216)Foreign-born:
82.7% (164)
Two or more races - Speak another language Native:
3.4% (41)Foreign-born:
35.3% (70)
White alone - Speak only English Native:
96.2% (3,812)Foreign-born:
9.4% (33)
White alone - Speak another language Native:
3.5% (139)Foreign-born:
91.7% (317)
Hispanic or Latino - Speak another language Native:
44.5% (539)Foreign-born:
100.0% (360)
Foreign-born residents in Randallstown 5,588 residents are foreign born (8.2% Africa , 3.6% Latin America , 2.3% Asia ).
This city:
15.5%Maryland:
15.7%
Marital status for residents in Randallstown Marital status - White (Caucasian) population 15 years and over
Males 37.1% Never married49.2% Now married0.6% Separated5.3% Widowed7.8% DivorcedFemales 30.5% Never married40.4% Now married4.6% Separated19.5% Widowed4.9% DivorcedWomen who gave birth in the past 12 months Now married:
81.6% (37)Unmarried:
18.4% (8)
Women who did not give birth in the past 12 months Now married:
29.9% (258)Unmarried:
70.1% (603)
Marital status - Black or African American population 15 years and over
Males 41.8% Never married47.1% Now married2.7% Separated3.2% Widowed5.2% DivorcedFemales 34.7% Never married35.5% Now married6.4% Separated7.8% Widowed15.6% DivorcedWomen who gave birth in the past 12 months Now married:
72.5% (200)Unmarried:
27.5% (76)
Women who did not give birth in the past 12 months Now married:
30.0% (1,766)Unmarried:
70.0% (4,112)
Marital status - American Indian / Alaska Native population 15 years and over
Males 0.0% Never married0.0% Now married0.0% Separated0.0% Widowed100.0% DivorcedFemales 0.0% Never married0.0% Now married0.0% Separated45.7% Widowed54.3% DivorcedMarital status - Asian population 15 years and over
Males 18.2% Never married68.7% Now married0.0% Separated0.0% Widowed13.1% DivorcedFemales 31.4% Never married43.0% Now married0.0% Separated9.9% Widowed15.6% DivorcedWomen who gave birth in the past 12 months Now married:
0.0% (0)Unmarried:
100.0% (22)
Women who did not give birth in the past 12 months Now married:
31.3% (84)Unmarried:
68.7% (185)
Marital status - Other race population 15 years and over
Males 7.3% Never married68.4% Now married3.6% Separated0.0% Widowed20.7% DivorcedFemales 12.9% Never married51.0% Now married0.0% Separated21.6% Widowed14.5% DivorcedWomen who gave birth in the past 12 months Now married:
100.0% (16)Unmarried:
0.0% (0)
Women who did not give birth in the past 12 months Now married:
63.0% (185)Unmarried:
37.0% (108)
Marital status - Two or more races population 15 years and over
Males 94.3% Never married5.7% Now married0.0% Separated0.0% Widowed0.0% DivorcedFemales 41.4% Never married50.9% Now married0.6% Separated0.0% Widowed7.1% DivorcedWomen who gave birth in the past 12 months Now married:
100.0% (8)Unmarried:
0.0% (0)
Women who did not give birth in the past 12 months Now married:
39.9% (137)Unmarried:
60.1% (207)
Marital status - White alone, not Hispanic / Latino population 15 years and over
Males 34.0% Never married52.2% Now married0.7% Separated5.8% Widowed7.4% DivorcedFemales 29.1% Never married40.5% Now married4.8% Separated20.4% Widowed5.1% DivorcedWomen who gave birth in the past 12 months Now married:
81.6% (38)Unmarried:
18.4% (8)
Women who did not give birth in the past 12 months Now married:
30.6% (242)Unmarried:
69.4% (549)
Marital status - Hispanic or Latino population 15 years and over
Males 49.2% Never married35.1% Now married1.6% Separated0.0% Widowed14.1% DivorcedFemales 27.6% Never married37.2% Now married13.9% Separated12.3% Widowed9.1% DivorcedWomen who gave birth in the past 12 months Now married:
100.0% (12)Unmarried:
0.0% (0)
Women who did not give birth in the past 12 months Now married:
49.8% (165)Unmarried:
50.2% (166)
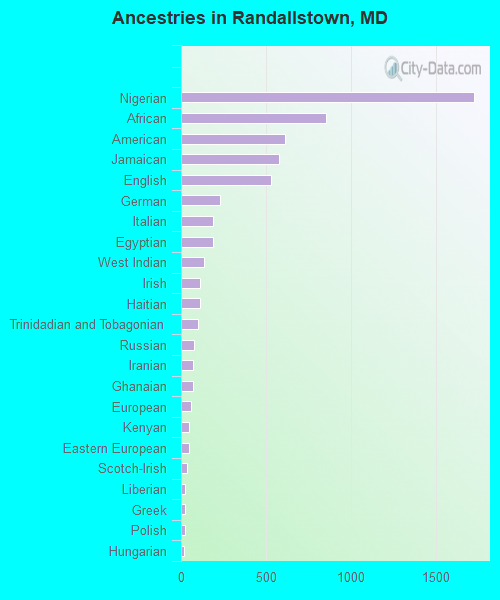
Ancestries in Randallstown
1,726 7.8% Nigerian851 3.8% African612 2.8% American576 2.6% Jamaican531 2.4% English229 1.0% German188 0.8% Italian187 0.8% Egyptian133 0.6% West Indian112 0.5% Irish109 0.5% Haitian102 0.5% Trinidadian and Tobagonian79 0.4% Russian73 0.3% Iranian68 0.3% Ghanaian61 0.3% European50 0.2% Kenyan48 0.2% Eastern European36 0.2% Scotch-Irish22 0.10% Liberian21 0.09% Greek21 0.09% Polish18 0.08% Hungarian15 0.07% Czech15 0.07% U.S. Virgin Islander10 0.05% French8 0.04% Czechoslovakian6 0.03% British West Indian4 0.02% Scottish3 0.01% Welsh2 0.01% Israeli
Geographical mobility in Randallstown Same house 1 year ago 3,883 85.5% White (Caucasian)26,992 93.6% Black or African American89 98.9% American Indian / Alaska Native696 81.0% Asian5 100.0% Native Hawaiian / Pacific Islander874 100.0% Other race1,407 100.0% Two or more races3,721 85.6% White alone, not Hispanic / Latino1,594 100.0% Hispanic or LatinoMoved within same county 286 6.3% White / Caucasian1,232 4.3% Black or African American17 2.0% Asian285 6.5% White alone, not Hispanic / Latino15 1.0% Hispanic or LatinoMoved within same state 246 5.4% White / Caucasian308 1.1% Black or African American117 13.6% Asian31 2.2% Two or more races220 5.1% White alone, not Hispanic / Latino25 1.6% Hispanic or LatinoMoved from different state 98 2.2% White / Caucasian76 0.3% Black or African American2 0.2% Two or more races98 2.3% White alone, not Hispanic / LatinoMoved from abroad 15 0.3% White599 2.1% Black or African American44 5.1% Asian15 0.3% White alone, not Hispanic / Latino
Children Nativity (place of birth) in Randallstown
Children under 6 years - Living with two parents Both parents native 573 98.2% Native10 1.8% Foreign-bornBoth parents foreign-born 316 86.7% Native48 13.3% Foreign-bornOne native, one foreign-born parent 77 100.0% NativeChildren under 6 years - Living with one parent Native parent 631 100.0% NativeForeign-born parent 200 100.0% NativeChildren 6 to 17 years - Living with two parents Both parents native 1,377 100.0% NativeBoth parents foreign-born 556 57.3% Native413 42.7% Foreign-bornOne native, one foreign-born parent 647 100.0% NativeChildren 6 to 17 years - Living with one parent Native parent 1,188 100.0% NativeForeign-born parent 318 58.2% Native228 41.8% Foreign-born
Grandparents responsible for own grandchildren in Randallstown
Grandparents (30 to 59 years) Black or African American 51 35.8% Responsible for grandchildren91 64.2% Not responsible for grandchildrenAsian 6 100.0% Not responsible for grandchildrenGrandparents (60 years and over) Black or African American 40 9.9% Responsible for grandchildren369 90.1% Not responsible for grandchildrenAsian 40 100.0% Not responsible for grandchildren