Races in Rialto, California (CA) Detailed Stats
Data:
Races - White alone (%)
Races - White alone (% change since 2000)
Races - Black alone (%)
Races - Black alone (% change since 2000)
Races - American Indian alone (%)
Races - American Indian alone (% change since 2000)
Races - Asian alone (%)
Races - Asian alone (% change since 2000)
Races - Hispanic (%)
Races - Hispanic (% change since 2000)
Races - Native Hawaiian and Other Pacific Islander alone (%)
Races - Native Hawaiian and Other Pacific Islander alone (% change since 2000)
Races - Two or more races(%)
Races - Two or more races(% change since 2000)
Races - Other race alone (%)
Races - Other race alone (% change since 2000)
Racial diversity
Place of birth - Born in state of residence (%)
Place of birth - Born in state of residence (%) - White
Place of birth - Born in state of residence (%) - Black or African American
Place of birth - Born in state of residence (%) - Asian
Place of birth - Born in state of residence (%) - Hispanic or Latino
Place of birth - Born in state of residence (%) - American Indian and Alaska Native
Place of birth - Born in state of residence (%) - Multirace
Place of birth - Born in state of residence (%) - Other Race
Place of birth - Born in other state (%)
Place of birth - Born in other state (%) - White
Place of birth - Born in other state (%) - Black or African American
Place of birth - Born in other state (%) - Asian
Place of birth - Born in other state (%) - Hispanic or Latino
Place of birth - Born in other state (%) - American Indian and Alaska Native
Place of birth - Born in other state (%) - Multirace
Place of birth - Born in other state (%) - Other Race
Place of birth - Native, outside of US (%)
Place of birth - Native, outside of US (%) - White
Place of birth - Native, outside of US (%) - Black or African American
Place of birth - Native, outside of US (%) - Asian
Place of birth - Native, outside of US (%) - Hispanic or Latino
Place of birth - Native, outside of US (%) - American Indian and Alaska Native
Place of birth - Native, outside of US (%) - Multirace
Place of birth - Native, outside of US (%) - Other Race
Place of birth - Foreign born (%)
Place of birth - Foreign born (%) - White
Place of birth - Foreign born (%) - Black or African American
Place of birth - Foreign born (%) - Asian
Place of birth - Foreign born (%) - Hispanic or Latino
Place of birth - Foreign born (%) - American Indian and Alaska Native
Place of birth - Foreign born (%) - Multirace
Place of birth - Foreign born (%) - Other Race
Residents speaking English at home (%)
Residents speaking English at home - Born in the United States (%)
Residents speaking English at home - Native, born elsewhere (%)
Residents speaking English at home - Foreign born (%)
Residents speaking Spanish at home (%)
Residents speaking Spanish at home - Born in the United States (%)
Residents speaking Spanish at home - Native, born elsewhere (%)
Residents speaking Spanish at home - Foreign born (%)
Residents speaking other language at home (%)
Residents speaking other language at home - Born in the United States (%)
Residents speaking other language at home - Native, born elsewhere (%)
Residents speaking other language at home - Foreign born (%)
Marital status - Never married (%)
Marital status - Now married (%)
Marital status - Separated (%)
Marital status - Widowed (%)
Marital status - Divorced (%)
Ancestries Reported - Arab (%)
Ancestries Reported - Czech (%)
Ancestries Reported - Danish (%)
Ancestries Reported - Dutch (%)
Ancestries Reported - English (%)
Ancestries Reported - French (%)
Ancestries Reported - French Canadian (%)
Ancestries Reported - German (%)
Ancestries Reported - Greek (%)
Ancestries Reported - Hungarian (%)
Ancestries Reported - Irish (%)
Ancestries Reported - Italian (%)
Ancestries Reported - Lithuanian (%)
Ancestries Reported - Norwegian (%)
Ancestries Reported - Polish (%)
Ancestries Reported - Portuguese (%)
Ancestries Reported - Russian (%)
Ancestries Reported - Scotch-Irish (%)
Ancestries Reported - Scottish (%)
Ancestries Reported - Slovak (%)
Ancestries Reported - Subsaharan African (%)
Ancestries Reported - Swedish (%)
Ancestries Reported - Swiss (%)
Ancestries Reported - Ukrainian (%)
Ancestries Reported - United States (%)
Ancestries Reported - Welsh (%)
Ancestries Reported - West Indian (%)
Ancestries Reported - Other (%)
Geographical mobility - Same house 1 year ago (%)
Geographical mobility - Same house 1 year ago (%) - White
Geographical mobility - Same house 1 year ago (%) - Black or African American
Geographical mobility - Same house 1 year ago (%) - Asian
Geographical mobility - Same house 1 year ago (%) - Hispanic or Latino
Geographical mobility - Same house 1 year ago (%) - American Indian and Alaska Native
Geographical mobility - Same house 1 year ago (%) - Multirace
Geographical mobility - Same house 1 year ago (%) - Other Race
Geographical mobility - Moved within same county (%)
Geographical mobility - Moved within same county (%) - White
Geographical mobility - Moved within same county (%) - Black or African American
Geographical mobility - Moved within same county (%) - Asian
Geographical mobility - Moved within same county (%) - Hispanic or Latino
Geographical mobility - Moved within same county (%) - American Indian and Alaska Native
Geographical mobility - Moved within same county (%) - Multirace
Geographical mobility - Moved within same county (%) - Other Race
Geographical mobility - Moved from different county within same state (%)
Geographical mobility - Moved from different county within same state (%) - White
Geographical mobility - Moved from different county within same state (%) - Black or African American
Geographical mobility - Moved from different county within same state (%) - Asian
Geographical mobility - Moved from different county within same state (%) - Hispanic or Latino
Geographical mobility - Moved from different county within same state (%) - American Indian and Alaska Native
Geographical mobility - Moved from different county within same state (%) - Multirace
Geographical mobility - Moved from different county within same state (%) - Other Race
Geographical mobility - Moved from different state (%)
Geographical mobility - Moved from different state (%) - White
Geographical mobility - Moved from different state (%) - Black or African American
Geographical mobility - Moved from different state (%) - Asian
Geographical mobility - Moved from different state (%) - Hispanic or Latino
Geographical mobility - Moved from different state (%) - American Indian and Alaska Native
Geographical mobility - Moved from different state (%) - Multirace
Geographical mobility - Moved from different state (%) - Other Race
Geographical mobility - Moved from abroad (%)
Geographical mobility - Moved from abroad (%) - White
Geographical mobility - Moved from abroad (%) - Black or African American
Geographical mobility - Moved from abroad (%) - Asian
Geographical mobility - Moved from abroad (%) - Hispanic or Latino
Geographical mobility - Moved from abroad (%) - American Indian and Alaska Native
Geographical mobility - Moved from abroad (%) - Multirace
Geographical mobility - Moved from abroad (%) - Other Race
Place of birth for the foreign-born population - Ireland (%)
Place of birth for the foreign-born population - Denmark (%)
Place of birth for the foreign-born population - Norway (%)
Place of birth for the foreign-born population - Sweden (%)
Place of birth for the foreign-born population - United Kingdom (%)
Place of birth for the foreign-born population - England (%)
Place of birth for the foreign-born population - Scotland (%)
Place of birth for the foreign-born population - Other Northern Europe (%)
Place of birth for the foreign-born population - Austria (%)
Place of birth for the foreign-born population - Belgium (%)
Place of birth for the foreign-born population - France (%)
Place of birth for the foreign-born population - Germany (%)
Place of birth for the foreign-born population - Netherlands (%)
Place of birth for the foreign-born population - Switzerland (%)
Place of birth for the foreign-born population - Other Western Europe (%)
Place of birth for the foreign-born population - Greece (%)
Place of birth for the foreign-born population - Italy (%)
Place of birth for the foreign-born population - Portugal (%)
Place of birth for the foreign-born population - Spain (%)
Place of birth for the foreign-born population - Other Southern Europe (%)
Place of birth for the foreign-born population - Albania (%)
Place of birth for the foreign-born population - Belarus (%)
Place of birth for the foreign-born population - Bosnia and Herzegovina (%)
Place of birth for the foreign-born population - Bulgaria (%)
Place of birth for the foreign-born population - Croatia (%)
Place of birth for the foreign-born population - Czechoslovakia (%)
Place of birth for the foreign-born population - Hungary (%)
Place of birth for the foreign-born population - Latvia (%)
Place of birth for the foreign-born population - Lithuania (%)
Place of birth for the foreign-born population - North Macedonia (Macedonia) (%)
Place of birth for the foreign-born population - Moldova (%)
Place of birth for the foreign-born population - Poland (%)
Place of birth for the foreign-born population - Romania (%)
Place of birth for the foreign-born population - Russia (%)
Place of birth for the foreign-born population - Serbia (%)
Place of birth for the foreign-born population - Ukraine (%)
Place of birth for the foreign-born population - Other Eastern Europe (%)
Place of birth for the foreign-born population - China (%)
Place of birth for the foreign-born population - Hong Kong (%)
Place of birth for the foreign-born population - Taiwan (%)
Place of birth for the foreign-born population - Japan (%)
Place of birth for the foreign-born population - Korea (%)
Place of birth for the foreign-born population - Other Eastern Asia (%)
Place of birth for the foreign-born population - Afghanistan (%)
Place of birth for the foreign-born population - Bangladesh (%)
Place of birth for the foreign-born population - India (%)
Place of birth for the foreign-born population - Iran (%)
Place of birth for the foreign-born population - Kazakhstan (%)
Place of birth for the foreign-born population - Nepal (%)
Place of birth for the foreign-born population - Pakistan (%)
Place of birth for the foreign-born population - Sri Lanka (%)
Place of birth for the foreign-born population - Uzbekistan (%)
Place of birth for the foreign-born population - Other South Central Asia (%)
Place of birth for the foreign-born population - Burma (%)
Place of birth for the foreign-born population - Cambodia (%)
Place of birth for the foreign-born population - Indonesia (%)
Place of birth for the foreign-born population - Laos (%)
Place of birth for the foreign-born population - Malaysia (%)
Place of birth for the foreign-born population - Philippines (%)
Place of birth for the foreign-born population - Singapore (%)
Place of birth for the foreign-born population - Thailand (%)
Place of birth for the foreign-born population - Vietnam (%)
Place of birth for the foreign-born population - Other South Eastern Asia (%)
Place of birth for the foreign-born population - Armenia (%)
Place of birth for the foreign-born population - Iraq (%)
Place of birth for the foreign-born population - Israel (%)
Place of birth for the foreign-born population - Jordan (%)
Place of birth for the foreign-born population - Kuwait (%)
Place of birth for the foreign-born population - Lebanon (%)
Place of birth for the foreign-born population - Saudi Arabia (%)
Place of birth for the foreign-born population - Syria (%)
Place of birth for the foreign-born population - Turkey (%)
Place of birth for the foreign-born population - Yemen (%)
Place of birth for the foreign-born population - Other Western Asia (%)
Place of birth for the foreign-born population - Eritrea (%)
Place of birth for the foreign-born population - Ethiopia (%)
Place of birth for the foreign-born population - Kenya (%)
Place of birth for the foreign-born population - Somalia (%)
Place of birth for the foreign-born population - Uganda (%)
Place of birth for the foreign-born population - Zimbabwe (%)
Place of birth for the foreign-born population - Other Eastern Africa (%)
Place of birth for the foreign-born population - Cameroon (%)
Place of birth for the foreign-born population - Congo (%)
Place of birth for the foreign-born population - Democratic Republic of Congo (Zaire) (%)
Place of birth for the foreign-born population - Other Middle Africa (%)
Place of birth for the foreign-born population - Egypt (%)
Place of birth for the foreign-born population - Morocco (%)
Place of birth for the foreign-born population - Sudan (%)
Place of birth for the foreign-born population - Other Northern Africa (%)
Place of birth for the foreign-born population - South Africa (%)
Place of birth for the foreign-born population - Other Southern Africa (%)
Place of birth for the foreign-born population - Cabo Verde (%)
Place of birth for the foreign-born population - Ghana (%)
Place of birth for the foreign-born population - Liberia (%)
Place of birth for the foreign-born population - Nigeria (%)
Place of birth for the foreign-born population - Senegal (%)
Place of birth for the foreign-born population - Sierra Leone (%)
Place of birth for the foreign-born population - Other Western Africa (%)
Place of birth for the foreign-born population - Australia (%)
Place of birth for the foreign-born population - New Zealand (%)
Place of birth for the foreign-born population - Fiji (%)
Place of birth for the foreign-born population - Micronesia (%)
Place of birth for the foreign-born population - Bahamas (%)
Place of birth for the foreign-born population - Barbados (%)
Place of birth for the foreign-born population - Cuba (%)
Place of birth for the foreign-born population - Dominica (%)
Place of birth for the foreign-born population - Dominican Republic (%)
Place of birth for the foreign-born population - Grenada (%)
Place of birth for the foreign-born population - Haiti (%)
Place of birth for the foreign-born population - Jamaica (%)
Place of birth for the foreign-born population - St. Vincent and the Grenadines (%)
Place of birth for the foreign-born population - Trinidad and Tobago (%)
Place of birth for the foreign-born population - West Indies (%)
Place of birth for the foreign-born population - Other Caribbean (%)
Place of birth for the foreign-born population - Belize (%)
Place of birth for the foreign-born population - Costa Rica (%)
Place of birth for the foreign-born population - El Salvador (%)
Place of birth for the foreign-born population - Guatemala (%)
Place of birth for the foreign-born population - Honduras (%)
Place of birth for the foreign-born population - Mexico (%)
Place of birth for the foreign-born population - Nicaragua (%)
Place of birth for the foreign-born population - Panama (%)
Place of birth for the foreign-born population - Other Central America (%)
Place of birth for the foreign-born population - Argentina (%)
Place of birth for the foreign-born population - Bolivia (%)
Place of birth for the foreign-born population - Brazil (%)
Place of birth for the foreign-born population - Chile (%)
Place of birth for the foreign-born population - Colombia (%)
Place of birth for the foreign-born population - Ecuador (%)
Place of birth for the foreign-born population - Guyana (%)
Place of birth for the foreign-born population - Peru (%)
Place of birth for the foreign-born population - Uruguay (%)
Place of birth for the foreign-born population - Venezuela (%)
Place of birth for the foreign-born population - Other South America (%)
Place of birth for the foreign-born population - Canada (%)
Place of birth for the foreign-born population - Other Northern America (%)
Place of birth for the foreign-born population - Other (%)
Latest news about races in Rialto, CA collected exclusively by city-data.com from local newspapers, TV, and radio stations
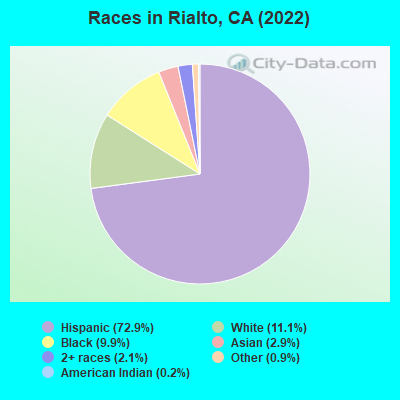
According to 2022 data, the most numerous races in Rialto, CA are Hispanic (75,389 residents), White alone (7,848 residents), and Asian alone (2,468 residents). 41.1% of Rialto residents speak English at home. 27.3% of Rialto, CA residents are foreign-born (24.6% born in Latin America), which is 4.6% greater than the foreign-born rate of 26.0% across the entire state of California.
Race distribution in Rialto
2000 2022
47,050 51.2% Hispanic 19,954 21.7% Black alone 19,713 21.5% White alone 2,162 2.4% Asian alone 2,089 2.3% Two or more races 341 0.4% Native Hawaiian and Other 370 0.4% American Indian alone 194 0.2% Other race alone
75,389 72.7% Hispanic 16,116 15.5% Black alone 7,848 7.6% White alone 2,468 2.4% Asian alone 2,352 2.3% Two or more races 268 0.3% Other race alone 216 0.2% American Indian alone
2000 2022
15,816,790 46.7% White alone 10,966,556 32.4% Hispanic 3,648,860 10.8% Asian alone 2,181,926 6.4% Black alone 903,115 2.7% Two or more races 178,984 0.5% American Indian alone 103,736 0.3% Native Hawaiian and Other 71,681 0.2% Other race alone
15,732,184 40.3% Hispanic 13,160,426 33.7% White alone 5,957,867 15.3% Asian alone 2,025,218 5.2% Black alone 1,663,222 4.3% Two or more races 251,618 0.6% Other race alone 135,777 0.3% Native Hawaiian and Other 103,030 0.3% American Indian alone
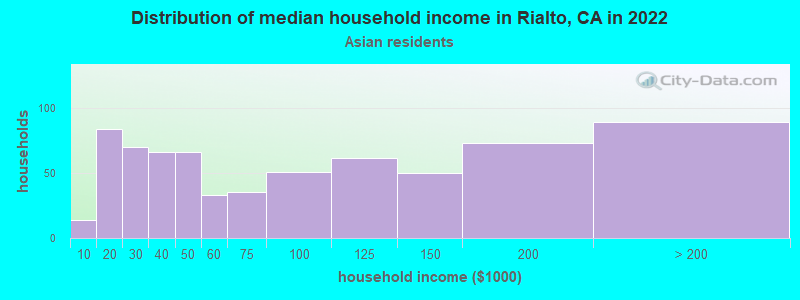
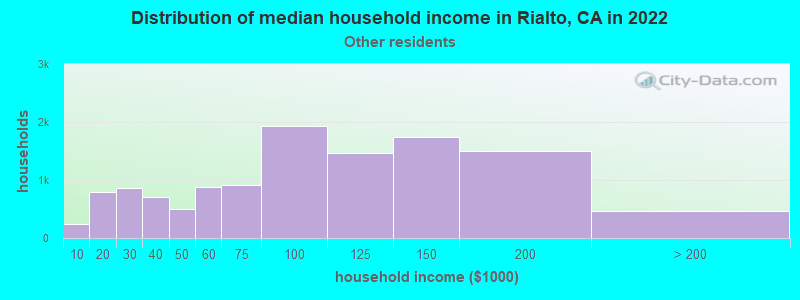
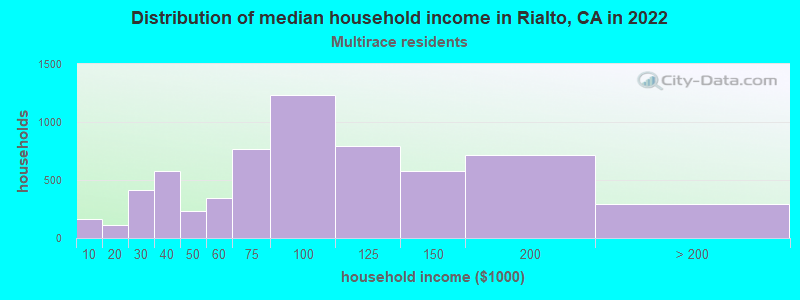
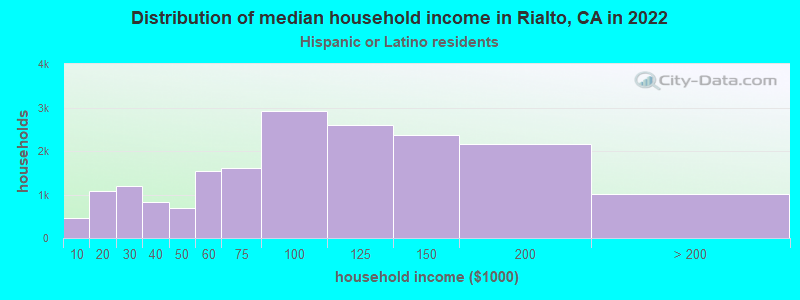
Income and house value in Rialto Median household income in 2022 $102,591 White non-Hispanic householders$86,718 Black householders$91,342 American Indian and Alaska Native householders$96,904 Asian householders$156,198 Native Hawaiian and other Pacific Islander householders$76,521 Some other race householders$121,656 Two or more races householders$85,603 Hispanic or Latino race householdersMedian 2022 house value $413,199 White Non-Hispanic householders$462,149 Black or African American householders$313,858 American Indian or Alaska Native householders $467,188 Asian householders$428,676 Native Hawaiian and other Pacific Islander householders$399,161 Some other race householders$472,227 Two or more races householders$402,761 Hispanic or Latino householders
Median age by race in Rialto
30.2 Median age for White residents29.1 31.4 37.4 Median age for Black or African American residents37.7 37.0 32.3 Median age for American Indian / Alaska Native residents39.0 31.3 55.9 Median age for Asian residents55.6 55.8 13.2 Median age for Native Hawaiian / Pacific Islander residents29.3 Median age for Other race residents29.6 29.1 30.4 Median age for Two or more races residents29.2 49.4 52.1 Median age for White alone residents52.9 51.6 28.7 Median age for Hispanic or Latino residents27.9 29.6
Owner/renter occupied households by race in Rialto
House owners and renters - White residents 8,025 62.5% Owner occupied4,813 37.5% Renter occupiedHouse owners and renters - Black or African American residents 2,802 53.0% Owner occupied2,487 47.0% Renter occupiedHouse owners and renters - American Indian / Alaska Native residents 154 62.5% Owner occupied93 37.5% Renter occupiedHouse owners and renters - Asian residents 854 80.7% Owner occupied205 19.3% Renter occupiedHouse owners and renters - Other race residents 2,191 69.5% Owner occupied960 30.5% Renter occupiedHouse owners and renters - Two or more races residents 1,612 65.4% Owner occupied852 34.6% Renter occupiedHouse owners and renters - White alone residents 2,153 72.1% Owner occupied834 27.9% Renter occupiedHouse owners and renters - Hispanic or Latino residents 10,305 63.3% Owner occupied5,965 36.7% Renter occupied
Language usage in Rialto
English speakers - Total 41.1% of residents of Rialto speak English at home.
55.3% of residents speak Spanish at home 34,209 64.4% Speak English very well18,891 35.6% Speak English less than very well3.0% of residents speak other language at home 1,607 56.6% Speak English very well1,232 43.4% Speak English less than very well
English speakers - Born in the United States 82.3% of residents of Rialto speak English at home.
16.1% of residents speak Spanish at home 929 73.7% Speak English very well332 26.3% Speak English less than very well1.3% of residents speak other language at home 97 91.5% Speak English very well9 8.5% Speak English less than very well
English speakers - Native, born elsewhere 51.2% of residents of Rialto speak English at home.
48.3% of residents speak Spanish at home 355 71.1% Speak English very well144 28.9% Speak English less than very well1.8% of residents speak other language at home 9 47.4% Speak English very well10 52.6% Speak English less than very well
English speakers - Foreign-born 6.0% of residents of Rialto speak English at home.
82.9% of residents speak Spanish at home 7,198 31.2% Speak English very well15,893 68.8% Speak English less than very well8.5% of residents speak other language at home 1,209 51.2% Speak English very well1,154 48.8% Speak English less than very well
White (Caucasian) - Speak only English Native:
40.6% (14,049)Foreign-born:
3.0% (407)
White (Caucasian) - Speak another language Native:
46.5% (16,070)Foreign-born:
92.4% (12,717)
Black or African American - Speak only English Native:
96.5% (11,795)Foreign-born:
38.0% (208)
Black or African American - Speak another language Native:
3.2% (390)Foreign-born:
56.6% (310)
American Indian / Alaska Native - Speak only English Native:
56.5% (319)Foreign-born:
18.5% (32)
American Indian / Alaska Native - Speak another language Native:
50.5% (285)Foreign-born:
81.6% (140)
Asian - Speak only English Native:
70.2% (475)Foreign-born:
8.5% (172)
Asian - Speak another language Native:
31.5% (213)Foreign-born:
91.2% (1,835)
Other race - Speak only English Native:
44.5% (3,619)Foreign-born:
16.1% (551)
Other race - Speak another language Native:
57.3% (4,660)Foreign-born:
87.0% (2,977)
Two or more races - Speak only English Native:
58.5% (4,713)Foreign-born:
11.2% (362)
Two or more races - Speak another language Native:
51.7% (4,161)Foreign-born:
87.0% (2,801)
White alone - Speak only English Native:
92.4% (7,516)Foreign-born:
26.4% (158)
White alone - Speak another language Native:
8.6% (702)Foreign-born:
75.4% (450)
Hispanic or Latino - Speak only English Native:
32.9% (15,222)Foreign-born:
3.6% (812)
Hispanic or Latino - Speak another language Native:
66.3% (30,636)Foreign-born:
95.9% (21,630)
Foreign-born residents in Rialto 28,550 residents are foreign born (24.6% Latin America ).
This city:
27.3%California:
100.0%
Marital status for residents in Rialto Marital status - White (Caucasian) population 15 years and over
Males 44.3% Never married48.6% Now married1.6% Separated1.2% Widowed4.4% DivorcedFemales 38.2% Never married42.8% Now married5.9% Separated5.9% Widowed7.2% DivorcedWomen who gave birth in the past 12 months Now married:
78.3% (632)Unmarried:
21.7% (176)
Women who did not give birth in the past 12 months Now married:
43.4% (5,745)Unmarried:
56.6% (7,496)
Marital status - Black or African American population 15 years and over
Males 55.7% Never married35.6% Now married1.2% Separated2.2% Widowed5.3% DivorcedFemales 53.5% Never married24.8% Now married1.9% Separated6.8% Widowed12.9% DivorcedWomen who gave birth in the past 12 months Now married:
30.6% (31)Unmarried:
69.4% (70)
Women who did not give birth in the past 12 months Now married:
25.6% (829)Unmarried:
74.4% (2,413)
Marital status - American Indian / Alaska Native population 15 years and over
Males 38.7% Never married58.6% Now married0.0% Separated0.0% Widowed2.7% DivorcedFemales 46.7% Never married37.5% Now married2.2% Separated10.3% Widowed3.3% DivorcedWomen who did not give birth in the past 12 months Now married:
35.8% (100)Unmarried:
64.2% (179)
Marital status - Asian population 15 years and over
Males 31.5% Never married62.4% Now married1.5% Separated1.8% Widowed2.7% DivorcedFemales 19.6% Never married59.0% Now married2.5% Separated11.0% Widowed7.9% DivorcedWomen who gave birth in the past 12 months Now married:
88.4% (64)Unmarried:
11.6% (8)
Women who did not give birth in the past 12 months Now married:
43.6% (235)Unmarried:
56.4% (304)
Marital status - Other race population 15 years and over
Males 42.1% Never married43.6% Now married2.2% Separated2.6% Widowed9.5% DivorcedFemales 48.9% Never married36.4% Now married3.8% Separated4.0% Widowed6.9% DivorcedWomen who gave birth in the past 12 months Now married:
35.1% (77)Unmarried:
64.9% (143)
Women who did not give birth in the past 12 months Now married:
32.1% (1,132)Unmarried:
67.9% (2,397)
Marital status - Two or more races population 15 years and over
Males 60.3% Never married35.6% Now married3.1% Separated0.7% Widowed0.2% DivorcedFemales 48.2% Never married35.9% Now married1.6% Separated4.2% Widowed10.1% DivorcedWomen who gave birth in the past 12 months Now married:
100.0% (31)Unmarried:
0.0% (0)
Women who did not give birth in the past 12 months Now married:
29.3% (781)Unmarried:
70.7% (1,887)
Marital status - White alone, not Hispanic / Latino population 15 years and over
Males 29.6% Never married52.3% Now married2.5% Separated2.2% Widowed13.4% DivorcedFemales 38.3% Never married35.3% Now married2.3% Separated8.7% Widowed15.5% DivorcedWomen who gave birth in the past 12 months Now married:
77.8% (43)Unmarried:
22.2% (12)
Women who did not give birth in the past 12 months Now married:
46.8% (941)Unmarried:
53.2% (1,070)
Marital status - Hispanic or Latino population 15 years and over
Males 46.0% Never married47.3% Now married1.5% Separated1.3% Widowed3.9% DivorcedFemales 40.3% Never married43.1% Now married5.9% Separated4.9% Widowed5.8% DivorcedWomen who gave birth in the past 12 months Now married:
70.2% (834)Unmarried:
29.8% (355)
Women who did not give birth in the past 12 months Now married:
41.5% (7,914)Unmarried:
58.5% (11,165)
Ancestries in Rialto
543 0.7% German521 0.7% English516 0.7% American468 0.6% African329 0.4% Irish302 0.4% Nigerian211 0.3% Italian131 0.2% French80 0.1% European77 0.1% Scotch-Irish74 0.1% Scottish64 0.09% Polish63 0.09% Norwegian62 0.08% Jamaican61 0.08% Belizean59 0.08% Jordanian47 0.06% Ukrainian38 0.05% Scandinavian36 0.05% Afghan35 0.05% French Canadian34 0.05% Dutch33 0.04% British30 0.04% Czech28 0.04% Syrian23 0.03% Haitian22 0.03% Portuguese22 0.03% West Indian21 0.03% Hungarian19 0.03% Belgian18 0.02% Ugandan18 0.02% Trinidadian and Tobagonian15 0.02% Sierra Leonean13 0.02% Guyanese12 0.02% Egyptian11 0.01% Northern European10 0.01% Canadian9 0.01% Romanian9 0.01% Greek9 0.01% Slavic8 0.01% Finnish6 0.01% Arab5 0.01% Slovak4 0.01% Croatian4 0.01% Welsh4 0.01% Palestinian
Geographical mobility in Rialto Same house 1 year ago 48,784 91.8% White (Caucasian)12,392 94.6% Black or African American828 93.0% American Indian / Alaska Native2,294 81.8% Asian18,786 92.5% Other race9,766 94.1% Two or more races8,665 92.8% White alone, not Hispanic / Latino69,283 90.0% Hispanic or LatinoMoved within same county 3,016 5.7% White / Caucasian616 4.7% Black or African American57 6.4% American Indian / Alaska Native380 13.5% Asian868 4.3% Other race632 6.1% Two or more races387 4.1% White alone, not Hispanic / Latino5,346 6.9% Hispanic or LatinoMoved within same state 1,115 2.1% White / Caucasian288 2.2% Black or African American15 1.7% American Indian / Alaska Native161 5.8% Asian588 2.9% Other race144 1.4% Two or more races281 3.0% White alone, not Hispanic / Latino1,826 2.4% Hispanic or LatinoMoved from different state 164 0.3% White / Caucasian94 0.7% Black or African American82 0.4% Other race29 0.3% Two or more races61 0.6% White alone, not Hispanic / Latino223 0.3% Hispanic or LatinoMoved from abroad 135 0.3% White7 0.1% Black or African American21 0.8% Asian85 0.4% Other race4 0.0% White alone, not Hispanic / Latino262 0.3% Hispanic or Latino
Children Nativity (place of birth) in Rialto
Children under 6 years - Living with two parents Both parents native 1,817 100.0% NativeBoth parents foreign-born 785 100.0% NativeOne native, one foreign-born parent 1,654 100.0% NativeChildren under 6 years - Living with one parent Native parent 3,021 100.0% NativeForeign-born parent 1,503 100.0% NativeChildren 6 to 17 years - Living with two parents Both parents native 2,462 100.0% NativeBoth parents foreign-born 2,805 93.4% Native199 6.6% Foreign-bornOne native, one foreign-born parent 3,475 100.0% NativeChildren 6 to 17 years - Living with one parent Native parent 5,482 100.0% NativeForeign-born parent 3,230 53.6% Native2,793 46.4% Foreign-born
Grandparents responsible for own grandchildren in Rialto
Grandparents (30 to 59 years) White / Caucasian 112 8.9% Responsible for grandchildren1,146 91.1% Not responsible for grandchildrenBlack or African American 41 20.3% Responsible for grandchildren163 79.7% Not responsible for grandchildrenAmerican Indian / Alaska Native 20 100.0% Not responsible for grandchildrenAsian 37 100.0% Not responsible for grandchildrenOther race 102 16.6% Responsible for grandchildren515 83.4% Not responsible for grandchildrenTwo or more races 46 19.9% Responsible for grandchildren186 80.1% Not responsible for grandchildrenWhite alone, not Hispanic / Latino 21 39.4% Responsible for grandchildren32 60.6% Not responsible for grandchildrenHispanic or Latino 163 6.7% Responsible for grandchildren2,253 93.3% Not responsible for grandchildrenGrandparents (60 years and over) White / Caucasian 118 7.7% Responsible for grandchildren1,419 92.3% Not responsible for grandchildrenBlack or African American 276 51.9% Responsible for grandchildren256 48.1% Not responsible for grandchildrenAmerican Indian / Alaska Native 11 12.4% Responsible for grandchildren79 87.6% Not responsible for grandchildrenAsian 7 5.7% Responsible for grandchildren122 94.3% Not responsible for grandchildrenOther race 32 5.7% Responsible for grandchildren532 94.3% Not responsible for grandchildrenTwo or more races 255 100.0% Not responsible for grandchildrenWhite alone, not Hispanic / Latino 22 9.6% Responsible for grandchildren204 90.4% Not responsible for grandchildrenHispanic or Latino 66 2.9% Responsible for grandchildren2,232 97.1% Not responsible for grandchildren