Races in Rincon, Georgia (GA) Detailed Stats
Data:
Races - White alone (%)
Races - White alone (% change since 2000)
Races - Black alone (%)
Races - Black alone (% change since 2000)
Races - American Indian alone (%)
Races - American Indian alone (% change since 2000)
Races - Asian alone (%)
Races - Asian alone (% change since 2000)
Races - Hispanic (%)
Races - Hispanic (% change since 2000)
Races - Native Hawaiian and Other Pacific Islander alone (%)
Races - Native Hawaiian and Other Pacific Islander alone (% change since 2000)
Races - Two or more races(%)
Races - Two or more races(% change since 2000)
Races - Other race alone (%)
Races - Other race alone (% change since 2000)
Racial diversity
Place of birth - Born in state of residence (%)
Place of birth - Born in state of residence (%) - White
Place of birth - Born in state of residence (%) - Black or African American
Place of birth - Born in state of residence (%) - Asian
Place of birth - Born in state of residence (%) - Hispanic or Latino
Place of birth - Born in state of residence (%) - American Indian and Alaska Native
Place of birth - Born in state of residence (%) - Multirace
Place of birth - Born in state of residence (%) - Other Race
Place of birth - Born in other state (%)
Place of birth - Born in other state (%) - White
Place of birth - Born in other state (%) - Black or African American
Place of birth - Born in other state (%) - Asian
Place of birth - Born in other state (%) - Hispanic or Latino
Place of birth - Born in other state (%) - American Indian and Alaska Native
Place of birth - Born in other state (%) - Multirace
Place of birth - Born in other state (%) - Other Race
Place of birth - Native, outside of US (%)
Place of birth - Native, outside of US (%) - White
Place of birth - Native, outside of US (%) - Black or African American
Place of birth - Native, outside of US (%) - Asian
Place of birth - Native, outside of US (%) - Hispanic or Latino
Place of birth - Native, outside of US (%) - American Indian and Alaska Native
Place of birth - Native, outside of US (%) - Multirace
Place of birth - Native, outside of US (%) - Other Race
Place of birth - Foreign born (%)
Place of birth - Foreign born (%) - White
Place of birth - Foreign born (%) - Black or African American
Place of birth - Foreign born (%) - Asian
Place of birth - Foreign born (%) - Hispanic or Latino
Place of birth - Foreign born (%) - American Indian and Alaska Native
Place of birth - Foreign born (%) - Multirace
Place of birth - Foreign born (%) - Other Race
Residents speaking English at home (%)
Residents speaking English at home - Born in the United States (%)
Residents speaking English at home - Native, born elsewhere (%)
Residents speaking English at home - Foreign born (%)
Residents speaking Spanish at home (%)
Residents speaking Spanish at home - Born in the United States (%)
Residents speaking Spanish at home - Native, born elsewhere (%)
Residents speaking Spanish at home - Foreign born (%)
Residents speaking other language at home (%)
Residents speaking other language at home - Born in the United States (%)
Residents speaking other language at home - Native, born elsewhere (%)
Residents speaking other language at home - Foreign born (%)
Marital status - Never married (%)
Marital status - Now married (%)
Marital status - Separated (%)
Marital status - Widowed (%)
Marital status - Divorced (%)
Ancestries Reported - Arab (%)
Ancestries Reported - Czech (%)
Ancestries Reported - Danish (%)
Ancestries Reported - Dutch (%)
Ancestries Reported - English (%)
Ancestries Reported - French (%)
Ancestries Reported - French Canadian (%)
Ancestries Reported - German (%)
Ancestries Reported - Greek (%)
Ancestries Reported - Hungarian (%)
Ancestries Reported - Irish (%)
Ancestries Reported - Italian (%)
Ancestries Reported - Lithuanian (%)
Ancestries Reported - Norwegian (%)
Ancestries Reported - Polish (%)
Ancestries Reported - Portuguese (%)
Ancestries Reported - Russian (%)
Ancestries Reported - Scotch-Irish (%)
Ancestries Reported - Scottish (%)
Ancestries Reported - Slovak (%)
Ancestries Reported - Subsaharan African (%)
Ancestries Reported - Swedish (%)
Ancestries Reported - Swiss (%)
Ancestries Reported - Ukrainian (%)
Ancestries Reported - United States (%)
Ancestries Reported - Welsh (%)
Ancestries Reported - West Indian (%)
Ancestries Reported - Other (%)
Geographical mobility - Same house 1 year ago (%)
Geographical mobility - Same house 1 year ago (%) - White
Geographical mobility - Same house 1 year ago (%) - Black or African American
Geographical mobility - Same house 1 year ago (%) - Asian
Geographical mobility - Same house 1 year ago (%) - Hispanic or Latino
Geographical mobility - Same house 1 year ago (%) - American Indian and Alaska Native
Geographical mobility - Same house 1 year ago (%) - Multirace
Geographical mobility - Same house 1 year ago (%) - Other Race
Geographical mobility - Moved within same county (%)
Geographical mobility - Moved within same county (%) - White
Geographical mobility - Moved within same county (%) - Black or African American
Geographical mobility - Moved within same county (%) - Asian
Geographical mobility - Moved within same county (%) - Hispanic or Latino
Geographical mobility - Moved within same county (%) - American Indian and Alaska Native
Geographical mobility - Moved within same county (%) - Multirace
Geographical mobility - Moved within same county (%) - Other Race
Geographical mobility - Moved from different county within same state (%)
Geographical mobility - Moved from different county within same state (%) - White
Geographical mobility - Moved from different county within same state (%) - Black or African American
Geographical mobility - Moved from different county within same state (%) - Asian
Geographical mobility - Moved from different county within same state (%) - Hispanic or Latino
Geographical mobility - Moved from different county within same state (%) - American Indian and Alaska Native
Geographical mobility - Moved from different county within same state (%) - Multirace
Geographical mobility - Moved from different county within same state (%) - Other Race
Geographical mobility - Moved from different state (%)
Geographical mobility - Moved from different state (%) - White
Geographical mobility - Moved from different state (%) - Black or African American
Geographical mobility - Moved from different state (%) - Asian
Geographical mobility - Moved from different state (%) - Hispanic or Latino
Geographical mobility - Moved from different state (%) - American Indian and Alaska Native
Geographical mobility - Moved from different state (%) - Multirace
Geographical mobility - Moved from different state (%) - Other Race
Geographical mobility - Moved from abroad (%)
Geographical mobility - Moved from abroad (%) - White
Geographical mobility - Moved from abroad (%) - Black or African American
Geographical mobility - Moved from abroad (%) - Asian
Geographical mobility - Moved from abroad (%) - Hispanic or Latino
Geographical mobility - Moved from abroad (%) - American Indian and Alaska Native
Geographical mobility - Moved from abroad (%) - Multirace
Geographical mobility - Moved from abroad (%) - Other Race
Place of birth for the foreign-born population - Ireland (%)
Place of birth for the foreign-born population - Denmark (%)
Place of birth for the foreign-born population - Norway (%)
Place of birth for the foreign-born population - Sweden (%)
Place of birth for the foreign-born population - United Kingdom (%)
Place of birth for the foreign-born population - England (%)
Place of birth for the foreign-born population - Scotland (%)
Place of birth for the foreign-born population - Other Northern Europe (%)
Place of birth for the foreign-born population - Austria (%)
Place of birth for the foreign-born population - Belgium (%)
Place of birth for the foreign-born population - France (%)
Place of birth for the foreign-born population - Germany (%)
Place of birth for the foreign-born population - Netherlands (%)
Place of birth for the foreign-born population - Switzerland (%)
Place of birth for the foreign-born population - Other Western Europe (%)
Place of birth for the foreign-born population - Greece (%)
Place of birth for the foreign-born population - Italy (%)
Place of birth for the foreign-born population - Portugal (%)
Place of birth for the foreign-born population - Spain (%)
Place of birth for the foreign-born population - Other Southern Europe (%)
Place of birth for the foreign-born population - Albania (%)
Place of birth for the foreign-born population - Belarus (%)
Place of birth for the foreign-born population - Bosnia and Herzegovina (%)
Place of birth for the foreign-born population - Bulgaria (%)
Place of birth for the foreign-born population - Croatia (%)
Place of birth for the foreign-born population - Czechoslovakia (%)
Place of birth for the foreign-born population - Hungary (%)
Place of birth for the foreign-born population - Latvia (%)
Place of birth for the foreign-born population - Lithuania (%)
Place of birth for the foreign-born population - North Macedonia (Macedonia) (%)
Place of birth for the foreign-born population - Moldova (%)
Place of birth for the foreign-born population - Poland (%)
Place of birth for the foreign-born population - Romania (%)
Place of birth for the foreign-born population - Russia (%)
Place of birth for the foreign-born population - Serbia (%)
Place of birth for the foreign-born population - Ukraine (%)
Place of birth for the foreign-born population - Other Eastern Europe (%)
Place of birth for the foreign-born population - China (%)
Place of birth for the foreign-born population - Hong Kong (%)
Place of birth for the foreign-born population - Taiwan (%)
Place of birth for the foreign-born population - Japan (%)
Place of birth for the foreign-born population - Korea (%)
Place of birth for the foreign-born population - Other Eastern Asia (%)
Place of birth for the foreign-born population - Afghanistan (%)
Place of birth for the foreign-born population - Bangladesh (%)
Place of birth for the foreign-born population - India (%)
Place of birth for the foreign-born population - Iran (%)
Place of birth for the foreign-born population - Kazakhstan (%)
Place of birth for the foreign-born population - Nepal (%)
Place of birth for the foreign-born population - Pakistan (%)
Place of birth for the foreign-born population - Sri Lanka (%)
Place of birth for the foreign-born population - Uzbekistan (%)
Place of birth for the foreign-born population - Other South Central Asia (%)
Place of birth for the foreign-born population - Burma (%)
Place of birth for the foreign-born population - Cambodia (%)
Place of birth for the foreign-born population - Indonesia (%)
Place of birth for the foreign-born population - Laos (%)
Place of birth for the foreign-born population - Malaysia (%)
Place of birth for the foreign-born population - Philippines (%)
Place of birth for the foreign-born population - Singapore (%)
Place of birth for the foreign-born population - Thailand (%)
Place of birth for the foreign-born population - Vietnam (%)
Place of birth for the foreign-born population - Other South Eastern Asia (%)
Place of birth for the foreign-born population - Armenia (%)
Place of birth for the foreign-born population - Iraq (%)
Place of birth for the foreign-born population - Israel (%)
Place of birth for the foreign-born population - Jordan (%)
Place of birth for the foreign-born population - Kuwait (%)
Place of birth for the foreign-born population - Lebanon (%)
Place of birth for the foreign-born population - Saudi Arabia (%)
Place of birth for the foreign-born population - Syria (%)
Place of birth for the foreign-born population - Turkey (%)
Place of birth for the foreign-born population - Yemen (%)
Place of birth for the foreign-born population - Other Western Asia (%)
Place of birth for the foreign-born population - Eritrea (%)
Place of birth for the foreign-born population - Ethiopia (%)
Place of birth for the foreign-born population - Kenya (%)
Place of birth for the foreign-born population - Somalia (%)
Place of birth for the foreign-born population - Uganda (%)
Place of birth for the foreign-born population - Zimbabwe (%)
Place of birth for the foreign-born population - Other Eastern Africa (%)
Place of birth for the foreign-born population - Cameroon (%)
Place of birth for the foreign-born population - Congo (%)
Place of birth for the foreign-born population - Democratic Republic of Congo (Zaire) (%)
Place of birth for the foreign-born population - Other Middle Africa (%)
Place of birth for the foreign-born population - Egypt (%)
Place of birth for the foreign-born population - Morocco (%)
Place of birth for the foreign-born population - Sudan (%)
Place of birth for the foreign-born population - Other Northern Africa (%)
Place of birth for the foreign-born population - South Africa (%)
Place of birth for the foreign-born population - Other Southern Africa (%)
Place of birth for the foreign-born population - Cabo Verde (%)
Place of birth for the foreign-born population - Ghana (%)
Place of birth for the foreign-born population - Liberia (%)
Place of birth for the foreign-born population - Nigeria (%)
Place of birth for the foreign-born population - Senegal (%)
Place of birth for the foreign-born population - Sierra Leone (%)
Place of birth for the foreign-born population - Other Western Africa (%)
Place of birth for the foreign-born population - Australia (%)
Place of birth for the foreign-born population - New Zealand (%)
Place of birth for the foreign-born population - Fiji (%)
Place of birth for the foreign-born population - Micronesia (%)
Place of birth for the foreign-born population - Bahamas (%)
Place of birth for the foreign-born population - Barbados (%)
Place of birth for the foreign-born population - Cuba (%)
Place of birth for the foreign-born population - Dominica (%)
Place of birth for the foreign-born population - Dominican Republic (%)
Place of birth for the foreign-born population - Grenada (%)
Place of birth for the foreign-born population - Haiti (%)
Place of birth for the foreign-born population - Jamaica (%)
Place of birth for the foreign-born population - St. Vincent and the Grenadines (%)
Place of birth for the foreign-born population - Trinidad and Tobago (%)
Place of birth for the foreign-born population - West Indies (%)
Place of birth for the foreign-born population - Other Caribbean (%)
Place of birth for the foreign-born population - Belize (%)
Place of birth for the foreign-born population - Costa Rica (%)
Place of birth for the foreign-born population - El Salvador (%)
Place of birth for the foreign-born population - Guatemala (%)
Place of birth for the foreign-born population - Honduras (%)
Place of birth for the foreign-born population - Mexico (%)
Place of birth for the foreign-born population - Nicaragua (%)
Place of birth for the foreign-born population - Panama (%)
Place of birth for the foreign-born population - Other Central America (%)
Place of birth for the foreign-born population - Argentina (%)
Place of birth for the foreign-born population - Bolivia (%)
Place of birth for the foreign-born population - Brazil (%)
Place of birth for the foreign-born population - Chile (%)
Place of birth for the foreign-born population - Colombia (%)
Place of birth for the foreign-born population - Ecuador (%)
Place of birth for the foreign-born population - Guyana (%)
Place of birth for the foreign-born population - Peru (%)
Place of birth for the foreign-born population - Uruguay (%)
Place of birth for the foreign-born population - Venezuela (%)
Place of birth for the foreign-born population - Other South America (%)
Place of birth for the foreign-born population - Canada (%)
Place of birth for the foreign-born population - Other Northern America (%)
Place of birth for the foreign-born population - Other (%)
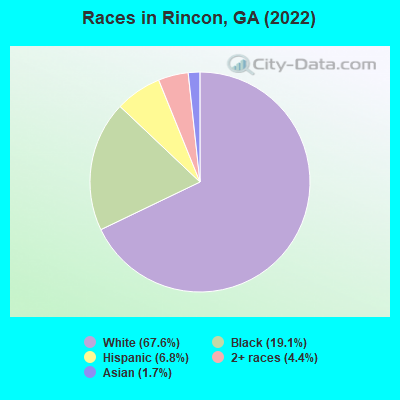
According to 2022 data, the most numerous races in Rincon, GA are White alone (7,502 residents), Black alone (2,120 residents), and Hispanic (758 residents). 94.2% of Rincon residents speak English at home. 3.9% of Rincon, GA residents are foreign-born (2.1% born in Latin America, 1.2% born in Asia, 0.5% born in Europe), which is 153.5% less than the foreign-born rate of 10.0% across the entire state of Georgia.
Race distribution in Rincon
2000 2022
5,128,661 62.6% White alone 2,331,465 28.5% Black alone 435,227 5.3% Hispanic 171,513 2.1% Asian alone 87,364 1.1% Two or more races 17,670 0.2% American Indian alone 11,275 0.1% Other race alone 3,278 0.04% Native Hawaiian and Other
5,415,657 49.6% White alone 3,349,240 30.7% Black alone 1,132,604 10.4% Hispanic 479,156 4.4% Asian alone 462,923 4.2% Two or more races 54,416 0.5% Other race alone 11,923 0.1% American Indian alone 6,957 0.06% Native Hawaiian and Other
Income and house value in Rincon Median household income in 2022 $78,830 White non-Hispanic householders$99,734 Black householders$96,929 Some other race householders$110,844 Two or more races householdersMedian 2022 house value $282,037 White Non-Hispanic householders$169,581 Black or African American householders $231,791 Asian householders$224,314 Some other race householders$224,314 Hispanic or Latino householders
Median age by race in Rincon
32.8 Median age for White residents31.1 36.4 30.6 Median age for Black or African American residents29.4 28.6 -597,462,513.8 Median age for American Indian / Alaska Native residents-666,666,666.0 -666,666,666.0 33.7 Median age for Asian residents38.8 30.9 -666,666,666.0 Median age for Native Hawaiian / Pacific Islander residents-666,666,666.0 -666,666,666.0 25.3 Median age for Other race residents38.4 18.0 21.3 Median age for Two or more races residents16.2 39.8 32.3 Median age for White alone residents30.9 36.5 29.8 Median age for Hispanic or Latino residents25.9 29.6
Owner/renter occupied households by race in Rincon
House owners and renters - White residents 1,959 62.3% Owner occupied1,185 37.7% Renter occupiedHouse owners and renters - Black or African American residents 518 62.3% Owner occupied313 37.7% Renter occupiedHouse owners and renters - Asian residents 33 63.8% Owner occupied19 36.2% Renter occupiedHouse owners and renters - Other race residents 102 100.0% Renter occupiedHouse owners and renters - Two or more races residents 157 100.0% Owner occupiedHouse owners and renters - White alone residents 1,943 62.3% Owner occupied1,174 37.7% Renter occupiedHouse owners and renters - Hispanic or Latino residents 250 100.0% Renter occupied
Language usage in Rincon
English speakers - Total 94.2% of residents of Rincon speak English at home.
3.5% of residents speak Spanish at home 260 74.1% Speak English very well91 25.9% Speak English less than very well2.1% of residents speak other language at home 144 68.9% Speak English very well65 31.1% Speak English less than very well
English speakers - Born in the United States 95.7% of residents of Rincon speak English at home.
4.1% of residents speak Spanish at home 189 100.0% Speak English very well0.1% of residents speak other language at home 3 100.0% Speak English very well
English speakers - Native, born elsewhere 77.7% of residents of Rincon speak English at home.
22.9% of residents speak Spanish at home 38 100.0% Speak English less than very well
English speakers - Foreign-born 41.4% of residents of Rincon speak English at home.
23.2% of residents speak Spanish at home 65 61.3% Speak English very well41 38.7% Speak English less than very well35.1% of residents speak other language at home 96 60.0% Speak English very well64 40.0% Speak English less than very well
White (Caucasian) - Speak only English Native:
98.1% (6,979)Foreign-born:
20.3% (12)
White (Caucasian) - Speak another language Native:
2.2% (155)Foreign-born:
75.6% (46)
Black or African American - Speak only English Native:
99.8% (1,748)Foreign-born:
97.7% (164)
Asian - Speak another language Native:
100.0% (21)Foreign-born:
95.3% (133)
Other race - Speak another language Native:
26.3% (50)Foreign-born:
99.0% (55)
Two or more races - Speak only English Native:
100.0% (520)Foreign-born:
100.0% (15)
White alone - Speak only English Native:
99.0% (6,803)Foreign-born:
39.7% (14)
White alone - Speak another language Native:
1.0% (71)Foreign-born:
60.3% (21)
Hispanic or Latino - Speak another language Native:
34.8% (197)Foreign-born:
99.8% (108)
Foreign-born residents in Rincon 455 residents are foreign born (2.1% Latin America , 1.2% Asia , 0.5% Europe ).
This city:
3.9%Georgia:
10.4%
Marital status for residents in Rincon Marital status - White (Caucasian) population 15 years and over
Males 28.1% Never married60.1% Now married1.2% Separated2.6% Widowed8.0% DivorcedFemales 19.6% Never married53.9% Now married6.9% Separated6.1% Widowed13.5% DivorcedWomen who gave birth in the past 12 months Now married:
100.0% (117)Unmarried:
0.0% (0)
Women who did not give birth in the past 12 months Now married:
57.3% (1,077)Unmarried:
42.7% (802)
Marital status - Black or African American population 15 years and over
Males 37.0% Never married46.5% Now married0.0% Separated15.7% Widowed0.8% DivorcedFemales 19.3% Never married47.5% Now married0.0% Separated2.3% Widowed30.9% DivorcedWomen who gave birth in the past 12 months Now married:
34.6% (18)Unmarried:
65.4% (34)
Women who did not give birth in the past 12 months Now married:
43.1% (126)Unmarried:
56.9% (166)
Marital status - Asian population 15 years and over
Males 0.0% Never married100.0% Now married0.0% Separated0.0% Widowed0.0% DivorcedFemales 15.8% Never married84.2% Now married0.0% Separated0.0% Widowed0.0% DivorcedWomen who did not give birth in the past 12 months Now married:
73.9% (35)Unmarried:
26.1% (12)
Marital status - Other race population 15 years and over
Males 0.0% Never married100.0% Now married0.0% Separated0.0% Widowed0.0% DivorcedFemales 30.3% Never married15.7% Now married0.0% Separated0.0% Widowed53.9% DivorcedWomen who did not give birth in the past 12 months Now married:
19.4% (18)Unmarried:
80.6% (75)
Marital status - Two or more races population 15 years and over
Males 0.0% Never married100.0% Now married0.0% Separated0.0% Widowed0.0% DivorcedFemales 16.8% Never married83.2% Now married0.0% Separated0.0% Widowed0.0% DivorcedWomen who gave birth in the past 12 months Now married:
100.0% (27)Unmarried:
0.0% (0)
Women who did not give birth in the past 12 months Now married:
80.2% (120)Unmarried:
19.8% (30)
Marital status - White alone, not Hispanic / Latino population 15 years and over
Males 25.8% Never married61.6% Now married1.3% Separated2.7% Widowed8.6% DivorcedFemales 19.6% Never married55.2% Now married7.4% Separated6.5% Widowed11.4% DivorcedWomen who gave birth in the past 12 months Now married:
100.0% (119)Unmarried:
0.0% (0)
Women who did not give birth in the past 12 months Now married:
60.3% (1,053)Unmarried:
39.7% (694)
Marital status - Hispanic or Latino population 15 years and over
Males 43.5% Never married56.5% Now married0.0% Separated0.0% Widowed0.0% DivorcedFemales 23.0% Never married27.2% Now married0.0% Separated0.0% Widowed49.8% DivorcedWomen who did not give birth in the past 12 months Now married:
22.1% (53)Unmarried:
77.9% (187)
Ancestries in Rincon
2,275 34.7% American760 11.6% English392 6.0% Irish300 4.6% German190 2.9% European171 2.6% African143 2.2% Scottish132 2.0% Italian72 1.1% Scotch-Irish62 0.9% Polish39 0.6% French Canadian31 0.5% Finnish18 0.3% Romanian13 0.2% Portuguese3 0.05% Swedish
Children Nativity (place of birth) in Rincon
Children under 6 years - Living with two parents Both parents native 602 100.0% NativeBoth parents foreign-born 64 100.0% NativeOne native, one foreign-born parent 24 100.0% NativeChildren under 6 years - Living with one parent Native parent 232 100.0% Native
Children 6 to 17 years - Living with two parents Both parents native 1,496 100.0% NativeBoth parents foreign-born 18 100.0% NativeOne native, one foreign-born parent 66 100.0% NativeChildren 6 to 17 years - Living with one parent Native parent 573 100.0% Native
Grandparents responsible for own grandchildren in Rincon
Grandparents (30 to 59 years) White / Caucasian 11 100.0% Responsible for grandchildrenAsian 10 100.0% Not responsible for grandchildrenWhite alone, not Hispanic / Latino 11 100.0% Responsible for grandchildren
Grandparents (60 years and over) White / Caucasian 11 100.0% Responsible for grandchildrenAsian 16 100.0% Not responsible for grandchildrenWhite alone, not Hispanic / Latino 11 100.0% Responsible for grandchildren