Races in Romulus, New York (NY) Detailed Stats
Ancestries, Foreign-born residents, place of birth

Data:
Latest news about races in Romulus, NY collected exclusively by city-data.com from local newspapers, TV, and radio stations
1.7% of Romulus, NY residents are foreign-born , which is 1179.8% less than the foreign-born rate of 22.0% across the entire state of New York.
Race distribution in Romulus

- 1,62179.6%White alone
- 26813.2%Black alone
- 1015.0%Hispanic
- 301.5%Two or more races
- 140.7%Asian alone
- 10.05%Other race alone
- 10.05%American Indian alone
2000
2022
-
- 11,760,98162.0%White alone
- 2,867,58315.1%Hispanic
- 2,812,62314.8%Black alone
- 1,035,9265.5%Asian alone
- 366,1161.9%Two or more races
- 75,4990.4%Other race alone
- 52,4990.3%American Indian alone
- 5,2300.03%Native Hawaiian and Other
Pacific Islander alone
-
- 10,408,93352.9%White alone
- 3,867,29919.7%Hispanic
- 2,633,84013.4%Black alone
- 1,776,2869.0%Asian alone
- 732,6703.7%Two or more races
- 216,1101.1%Other race alone
- 35,0820.2%American Indian alone
- 6,9310.04%Native Hawaiian and Other
Pacific Islander alone
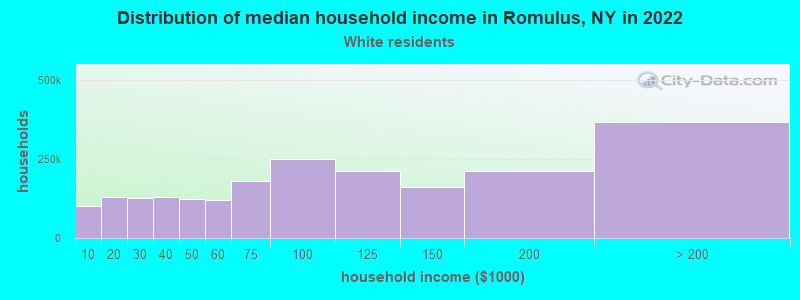
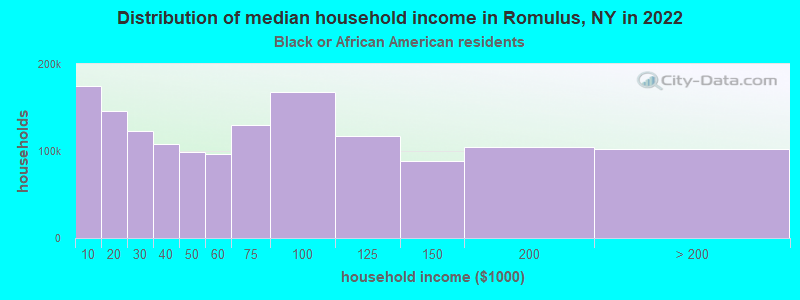
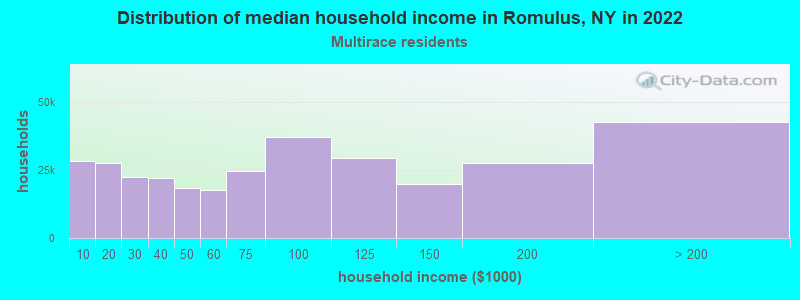
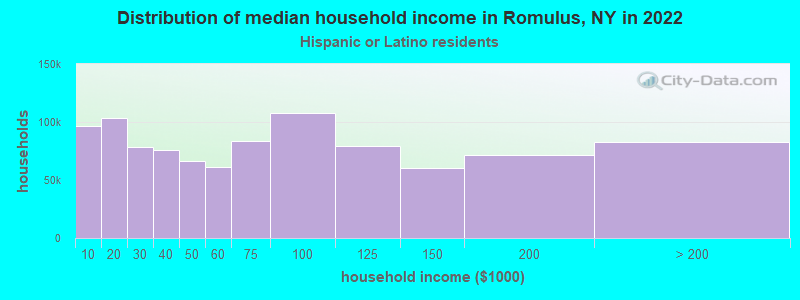
Income and house value in Romulus
- Median household income in 2022
- $77,185White non-Hispanic householders
- $184,877Black householders
- $66,958Two or more races householders
- $90,538Hispanic or Latino race householders
- Median 2022 house value
- $135,647White Non-Hispanic householders
- $122,160Two or more races householders
- $127,046Hispanic or Latino householders
Foreign-born residents in Romulus
35 residents are foreign born
| This city: | 1.7% |
| New York: | 20.4% |
Ancestries in Romulus

- 39919.7%German
- 35517.6%English
- 28314.0%Irish
- 21710.7%Other
- 1728.5%United States
- 1316.5%Italian
- 1256.2%Dutch
- 733.6%French
- 603.0%Polish
- 532.6%Scottish
- 402.0%Swiss
- 261.3%Scotch-Irish
- 160.8%Norwegian
- 140.7%Swedish
- 110.5%Welsh
- 90.4%Hungarian
- 90.4%Ukrainian
- 60.3%Danish
- 60.3%French Canadian
- 60.3%Greek
- 50.2%Czech
- 40.2%Russian
- 20.10%Slovak