Races in Rosebud, Montana (MT) Detailed Stats
Ancestries, Foreign-born residents, place of birth
Data:
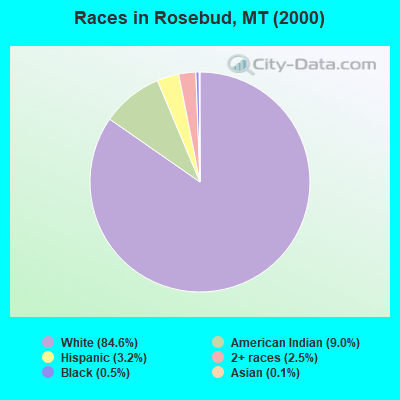
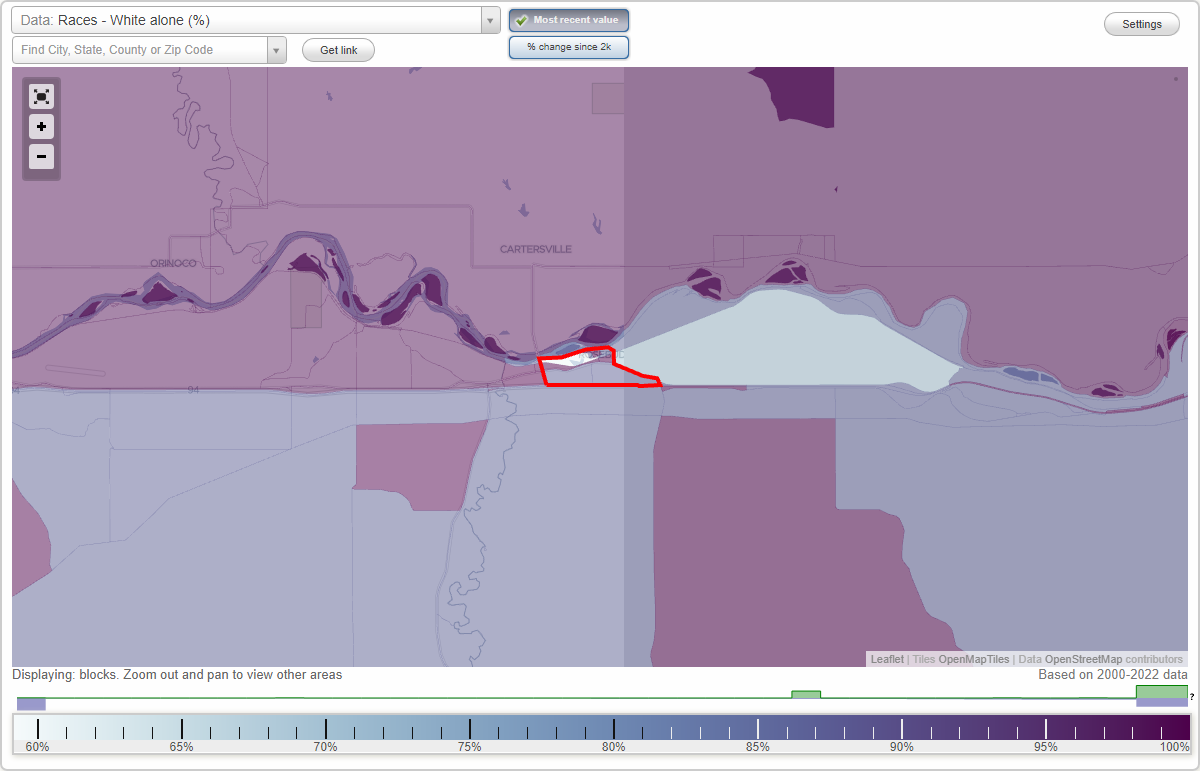
Race distribution in Rosebud

- 2,51684.6%White alone
- 2689.0%American Indian alone
- 963.2%Hispanic
- 732.5%Two or more races
- 150.5%Black alone
- 40.1%Asian alone
- 10.03%Other race alone
2000
2022
-
- 807,82389.5%White alone
- 54,4266.0%American Indian alone
- 18,0812.0%Hispanic
- 13,7681.5%Two or more races
- 4,5690.5%Asian alone
- 2,5340.3%Black alone
- 5690.06%Other race alone
- 4250.05%Native Hawaiian and Other
Pacific Islander alone
-
- 937,36583.5%White alone
- 58,7485.2%American Indian alone
- 55,1724.9%Two or more races
- 49,8304.4%Hispanic
- 9,0120.8%Other race alone
- 7,7000.7%Asian alone
- 3,4280.3%Black alone
- 1,6120.1%Native Hawaiian and Other
Pacific Islander alone
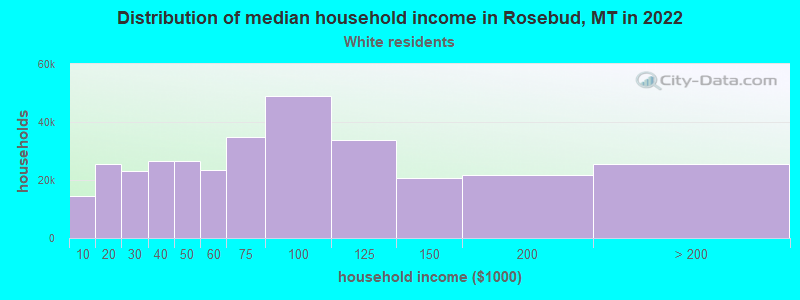
Income and house value in Rosebud
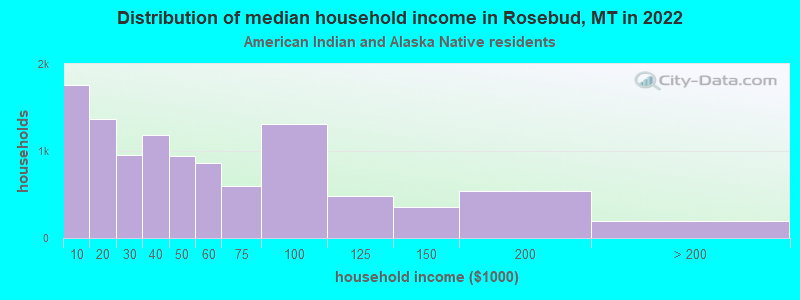
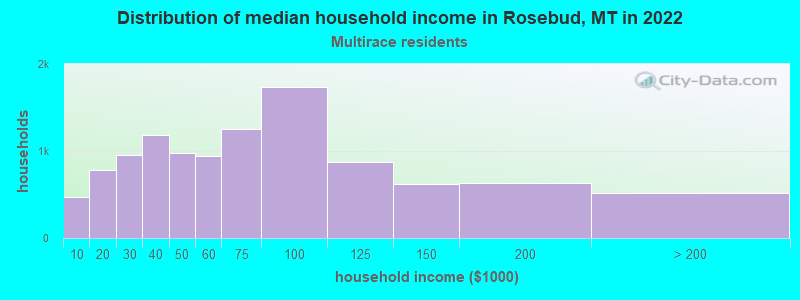
- Median household income in 2022
- $109,156White non-Hispanic householders
- $41,864American Indian and Alaska Native householders
- $123,774Some other race householders
- $41,494Two or more races householders
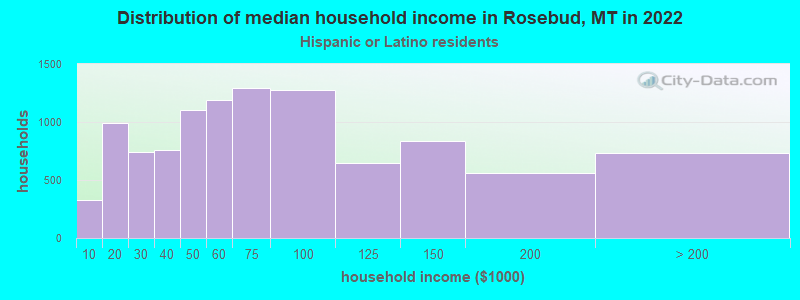
- $60,664Hispanic or Latino race householders
- Median 2022 house value
- $258,161White Non-Hispanic householders
- $222,848American Indian or Alaska Native householders
- $471,410Some other race householders
- $471,410Hispanic or Latino householders